A measurement of lifetime differences in the neutral -meson system
Abstract
Using a high statistics sample of photoproduced charm particles from the FOCUS experiment at Fermilab, we compare the lifetimes of neutral mesons decaying via to measure the lifetime differences between CP even and CP odd final states. These measurements bear on the phenomenology of mixing. If the is an equal mixture of CP even and CP odd eigenstates, we measure .
The FOCUS Collaboration
, , , , , , , , , , , , , , , , , , , , , , , , , , , , , , , , , , , , , , , , , , , , , , , , , , , , , , , , , , , , , , , , , , , , , , , , , , , , , , , , , , , , , , , , , , , , , , , , , , , , , , , , , , , ,
This paper contains a comparison of the lifetime of a CP even final state, , to the lifetime of a CP mixed decay, . The lifetime measurements are made using high signal-to-background samples consisting of 10 331 decays into , and 119 738 decays into . Throughout this paper, unless stated explicitly, the charge conjugate is implied when a decay mode of a specific charge is stated.
If CP violation in neutral -meson decays is negligible, the even CP and odd CP combinations of the and are mass eigenstates with well defined masses and widths. To the extent that mixing transitions occur, the widths of the CP even and odd states may differ. This paper reports a new, direct measurement of . Throughout this paper, we refer to the width asymmetry between neutral CP even and odd eigenstates as to differentiate it from a mixing parameter (generally called ) which is the fractional width asymmetry between true mass eigenstates and could differ from to the extent that charm decays violate CP symmetry.
Under the assumption that the decay is an equal CP even - odd mixture, the width difference asymmetry () is related to the measured lifetimes via:
Because is assumed to be a mixed state, a sizeable width difference between the CP even and odd lifetimes could, in principle, create a deviation from a pure exponential time evolution. Given the present limits on [1], this deviation is safely ignored given the scale of our statistical precision. Therefore, we will fit both lifetimes assuming a pure exponential decay.
The data for this paper were collected in the Wideband photoproduction experiment FOCUS during the Fermilab 1996–1997 fixed-target run. FOCUS is a considerably upgraded version of a previous experiment, E687 [2]. In FOCUS, a forward multi-particle spectrometer is used to measure the interactions of high energy photons on a segmented BeO target. We obtained a sample of over 1 million fully reconstructed charm particles in the three major decay modes: and . We briefly discuss those aspects of the detector which are particularly relevant for this analysis.
The FOCUS detector is a large aperture, fixed-target spectrometer with excellent vertexing and particle identification. A photon beam is derived from the bremsstrahlung of secondary electrons and positrons with an GeV endpoint energy produced from the 800 GeV/ Tevatron proton beam. The charged particles which emerge from the target are tracked by two systems of silicon microvertex detectors. The upstream system, consisting of 4 planes (two views in 2 stations), is interleaved with the experimental target, while the other system lies downstream of the target and consists of twelve planes of microstrips arranged in three views. These detectors provide high resolution separation of primary (production) and secondary (decay) vertices with an average proper time resolution of for 2-track vertices. The momentum of a charged particle is determined by measuring its deflections in two analysis magnets of opposite polarity with five stations of multiwire proportional chambers. Three multicell threshold Čerenkov counters are used to discriminate between electrons, pions, kaons, and protons. Our combination of a high quality, high resolution vertex detector, and an excellent Čerenkov system allows us to obtain clean and copious charm meson samples without the need of tagging although we employ both a tagged and untagged sample in this analysis.
Throughout this analysis we have chosen cuts designed to minimize non-charm backgrounds as well as reflection backgrounds from misidentified charm decays. To minimize potential systematic error, we use cuts and selection techniques which create very little bias in the reduced proper time. The reduced proper time is a traditional lifetime variable used in fixed-target experiments which use the detachment between the primary and secondary vertex as their principal tool in reducing non-charm background. The reduced proper time is defined by where is the distance between the primary and secondary vertex, is the resolution on , and is the minimum “detachment” cut required to tag the charm particle through its lifetime. If absorption and acceptance corrections are small enough that they can be neglected, and if is independent of , one can show that the distribution for decaying charmed particles, in the absence of mixing effects, will follow an exponential distribution. These assumptions are very nearly true in FOCUS.
With a few important differences, many of the basic cuts and analysis algorithms are described in reference [3]. We will summarize all important analysis issues here as well. Both states ( and ) were obtained using a data set which required a minimum detachment of the secondary vertex from the primary vertex of 2.5 and a high quality secondary vertex with a confidence level exceeding 1%. The primary vertex was found using a candidate driven vertex finder where a primary vertex was found by intersecting (nucleating) tracks about a “seed track” constructed using the secondary vertex and the reconstructed D momentum vector. The candidate driven algorithm finds the primary vertex with relatively high efficiency even at very low detachment. As we will demonstrate later in Figure 2, the use of candidate driven vertex finder meant that there was essentially no time dependent efficiency correction required to fit the reduced proper time to an exponential form. As a result, systematic uncertainties are greatly reduced since reliance on the Monte Carlo used to compute efficiency corrections is very minimal.
We begin by describing additional vertexing and kinematic cuts that were used to reduce the background to . These cuts, along with more stringent detachment cuts and particle identification cuts, were used to obtain our final sample. To maximize our yields while maintaining good signal-to-noise, we allow an event to enter our sample through either a tagged path or an inclusive path with additional clean-up cuts. Both paths required that the primary vertex fell within the boundaries of our segmented target.
The tagged path admitted any candidate consistent with the decay by virtue of having a mass difference within 3 MeV/ of nominal. The very powerful tagging cut reduced the background to the extent that no additional kinematic cuts were required. The inclusive path required that anticipated proper time resolution for a given event satisfied , and required that the two tracks did not have grossly asymmetric momenta (). We found from Monte Carlo studies, that background from partially reconstructed charm decays were often very highly asymmetric and effectively eliminated by the momentum asymmetry cut. We found that the proper time resolution cut was extremely effective at eliminating long lived backgrounds. Rather than separately fitting samples from the two paths, we combined the candidates admitted through either path into a single sample (in a way that insured no double counting) for the purpose of fitting. In doing this, we are implicitly assuming that the and have equal lifetimes and hence there is no need to discriminate between these two decays.
Because misidentified Cabibbo-allowed decays can be a significant background to the suppressed process , we have studied the charm particle lifetimes using a variety of Čerenkov cuts. The Čerenkov particle identification cuts used in FOCUS are based on likelihood ratios between the various stable particle identification hypotheses. These likelihoods are computed for a given track from the observed firing response (on or off) of all cells within the track’s () Čerenkov cone for each of our three, multicell threshold Čerenkov counters with pion thresholds of 4.5, 8.4, and 17.4 GeV/c. The probability that a given track will fire a given cell is computed using Poisson statistics based on the predicted number of photoelectrons striking the cell’s phototube under each particle identification hypothesis and an intensity dependent accidental firing rate determined for each of the 300 cells. The product of all firing probabilities for all cells within the three Čerenkov cones produces a -like variable called where ranges over the electron, pion, kaon, and proton hypotheses.
An important Čerenkov cut, which we will call kaonicity, is defined as . A kaonicity cut of implies that the track we are assigning to the kaon has an observed Čerenkov pattern under the kaon hypothesis that is favored over that of the pion hypothesis by a factor of = 7.39. Over the momentum spectrum of typical tracks in FOCUS, pions have significantly different Čerenkov response than kaons, and only a small fraction (typically ) have . Thus, even a mild cut on the likelihood ratio favoring the kaon hypothesis on the kaon candidate track reduces backgrounds to Cabibbo-favored decays such as and by a factor of .
As we will describe later, in order to assess systematic uncertainty, we varied the kaonicity and detachment cuts used to obtain the final sample prior to lifetime fitting. For each fit, a single detachment and kaonicity cut is used for both the and signal obtained through either the tagged or inclusive path. To further reduce backgrounds for the inclusive path of the signal, we required for tracks reconstructed as kaons, that the proton light pattern is not favored over the kaon hypothesis by more than . The inclusive path also required a pion consistency cut for the “pion” track in decay that demanded that no particle hypothesis is favored over the pion hypothesis with a exceeding 2. No additional Cerenkov cuts beyond kaonicity were used for the tagged path.
The mass distributions of Figure 1 illustrate several of the signals used in this analysis and specifically the use of these likelihood-based Čerenkov cuts. Figure 1(a) shows the signal obtained after requiring a kaonicity cut of for the . Figures 1(b) and 1(c) illustrate the use of tight kaonicity cuts to reduce the reflection background to . The reduction of the reflection is evident as , applied to both tracks, is raised from 1 to 4. The signal yield is estimated using a Gaussian signal peak over a background consisting of a 5th-order polynomial to represent general backgrounds along with a reflection line shape taken directly from Monte Carlo but scaled by a fit parameter to best match the data.


Signals for with a detachment cut of . The reflection in the background at higher masses is due to contamination from misidentified . (b) Requiring , we obtain a yield of 16 532 signal events. (c) Requiring , we obtain a yield of 10 331 signal events. The vertical dashed lines indicate the signal and sideband regions used for the lifetime and fits.
Because the signals have significant reflection backgrounds due to misidentified decays, we use a modified version of the mass sideband subtraction fitting technique used in our preceding experiment [3]. We will discuss the complete technique here. We fit the reduced proper time histogram for signal region events to a corrected exponential distribution for the signal added to a background reduced proper time histogram obtained directly from combinations falling in either a high or low mass sideband. Because this technique assumes that the events in symmetrically placed mass sidebands have the same lifetime evolution as events in the background within the signal region, it must be modified in light of the misidentification reflection shown in Figure 1 that only populates the upper sideband. In order to accommodate this reflection, we subtract the expected contribution from the reflection from the raw upper sideband, reduced proper time histogram. The overall normalization of the reflection contribution is computed from the integral over the sideband domain of the reflection peak found through the fit to the mass spectrum illustrated in Figure 1. The reduced proper time histogram shape is computed using the lifetime of the . This lifetime is taken from a joint fit of the reduced proper time distributions where the four fit parameters are (1) lifetime of the , (2) the parameter which relates the lifetime to the lifetime, (3) the background level under the signal, and (4) the background level under the signal. The normalization of the exponential time evolution of the signals is given by the total number of events in the signal region minus the background level fit parameters.
The reduced proper time contributions for the , and misidentified reflection are of the form where represents efficiency and absorption corrections to a pure exponential decay with lifetime . The use of a multiplicative “efficiency” correction, rather than an integral over a resolution function is justified since our reduced proper time resolution is less than 1/10 th of the lifetime. Because of the somewhat large (200 fs) bin widths, we actually integrate the exponential over the domain of the bin in computing the signal contribution rather than just evaluating the exponential at the bin center.
A separate correction factor, determined using a Monte Carlo simulation, is used for each of the three exponential contributions. Our Monte Carlo simulation includes the Pythia model for photon-gluon fusion and incorporates a complete simulation at digitization level of all detector and trigger systems, with all known multiple scattering and particle absorption effects. We have confirmed that it accurately reproduces the momentum and distribution for mesons and the multiplicity and profile of the primary vertex. The Monte Carlo was run with the statistics of the experiment.
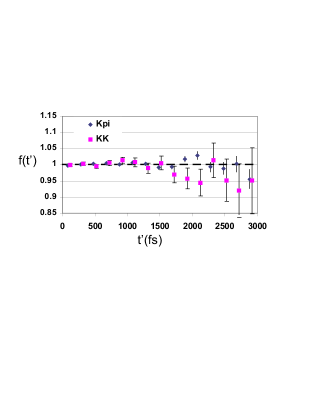
Figure 2 shows the efficiency and absorption corrections () obtained using this Monte Carlo for both decay modes in 200 fs bins of reduced proper time. The function is obtained by dividing the simulated reconstructed charm yield in each reduced proper time bin by the input decay exponential integrated over the bin. Figure 2 shows that the Monte Carlo corrections are typically less than 5% for both decay modes and the corrections for are statistically consistent with those for . Sources of potential variation include a minor relative depletion at low since the charm secondaries must lie within the fiducial area of the downstream microstrips, a depletion at large for charm candidates decaying downstream of the first microstrip detector, and a slight depletion at low since the upstream charm daughters need to travel through more material before exiting a target segment for the of events whose secondary vertex lies in target material. The charm daughter absorption effect is partially compensated when one considers absorption of the charm particle itself which tends to favor low for those events produced within the target material. We assume that the charm absorption cross section is 1/2 of the cross section for neutrons. Uncertainty in the charm cross section should cancel when the two charm decay lifetimes are divided to form .
Because FOCUS uses a segmented target consisting of four 6.75 mm thick BeO sections, each separated by 10 mm, many decays occur in air. The charm absorption is minimized in this configuration creating only minor corrections to the fitted lifetimes. Except for the difference between the absorption cross section for kaons and pions in the momentum range relevant to the ’s reconstructed in FOCUS, the minute absorption correction will be common to both decay modes[4] and cancel in . To give a feeling for the smallness of the absorption correction for lifetimes in FOCUS, we offer the following example. Computing the correction using a Monte Carlo where the absorption cross sections for charm secondaries have been scaled by a factor of 60% relative to their known values, causes the lifetimes for the and to decrease by only about 1.2 fs which implies a very small absorption systematic uncertainty for compared to the size of the statistical error.
The background levels in the and signal region are parameters in the lifetime fit. We have employed two ways of determining these parameters that are used to normalize the background contribution to the reduced proper time histogram in the signal region. The first method determines the background levels by finding the number which best fits the time evolution in the signal region. The second method combines information from the lifetime evolution with additional information from the fits to the mass distribution such as those shown in Figure 1. We accomplish this by adding additional likelihood terms which tend to “tie” the total background level to the one deduced from the mass fit. Specifically for the we add the log likelihood of a Poisson distribution which ties the level to half of the sum of the number of candidates in the upper and lower sideband. For the we add a -like likelihood penalty term which ties the background level to the integral of the polynomial used to represent the background under the peak in the signal region. The incorporation of information from the mass fit tends to reduce errors by 15–20% compared to the fits where the background level is determined from the time evolution alone.
Figure 3 shows the evolution for the and along with the predicted number from the lifetime fit. The confidence level for these fits are 2% and 55%, for the and , respectively. From these fits we obtain a lifetime asymmetry of:
and a lifetime of
Using our value for the fitted lifetime asymmetry, we compute .

The systematic uncertainty was studied by gauging the variation of the fitted lifetime estimates as the analysis cuts and fitting technique are varied. Because the Monte Carlo corrections shown in the plots (Figure 2) are consistent between the and sample, one expects the dominant systematic error on to come from potential differences in the background under the peak. By varying the minimum cut from 5 to 9 for the case of and , we significantly change the relative background level by eliminating non-charm backgrounds. Defining the signal-to-noise as the ratio of the signal height to background height at the location of the Gaussian signal peak, the fits used to measure the lifetimes have signal-to-noise ratios which range from 8.9 to 19.3 for the , from 2.3 to 5.7 for the . Changing the Čerenkov log likelihood ratio cuts from = 1 to 4 significantly changes the level of charm reflection contamination (as evidenced by Figure 1), and reduces contamination from combinatoric background.
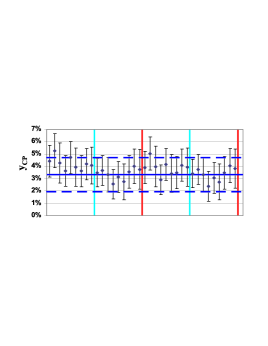
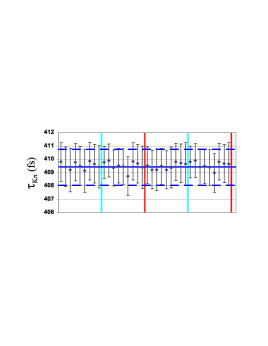
Figure 4 demonstrates the stability of the results for 9 sets of clean-up cuts and 4 different fit options. The 9 clean-up cut variants considered were 3 different kaonicity cuts (), each with three different detachment cuts . Each set of 9 points in Figure 4 are ordered as (, ), (, ), (, ) , (, ), (, ), (, ), (, ), (, ), and (, ). The four fit option results, summarized in Figure 4, include varying the lifetime range and the method used to obtain the background normalization. We show the fitted lifetime for each of the 9 cut variants and 4 fit options in Figure 5. Our quoted systematic error was evaluated by first calculating the shifts in for three different detachment cuts, three different kaonicity cuts, two different background normalization options, and three different lifetime fit ranges (10, 15, and 20 bins of 200 fs). These shifts were then combined in a conservative manner by adding them in quadrature to obtain the quoted systematic error.
Additional studies, beyond those used to obtain the quoted systematic error, were made to assess the validity of the Monte Carlo corrections and the background subtraction technique. We studied the consistency of the lifetime from four samples split according to momentum and primary vertex location for a variety of detachment and Čerenkov cuts. These studies include comparing the lifetime for 4 samples split according to the momentum and the location of the primary vertex (in the upstream two targets versus downstream or upstream two targets). Although the Monte Carlo () corrections for the high momentum, downstream sample were much severe than those for the other three samples , the lifetimes for all 4 samples were consistent within errors.
To assess the validity of the background subtraction method, we fit the values using two versions of the same set of 36 fit variants summarized in Figure 4. The first version used sideband regions that were set to 1/2 of the width of those shown in Figure 1. The second version restricted events to the tagged path only (but with full sideband width illustrated by Figure 1). The signal to background in tagged-only sample was 4 times larger than that for our standard tagged and inclusive combined sample. Besides reducing the overall background level, the tagging requirement should have substantially reduced any potential backgrounds from partially reconstructed and Čerenkov mis-identified or decays that have a substantially different lifetime than the . Significant variations in the result when the sideband width is changed might signify the presence of possible backgrounds (such as those from possible charm reflections) which have a mass spectrum which is sufficiently non-linear that the average of the high and low sideband reduced proper time evolution is no longer an inadequate representation for the evolution of the background in the signal region.
No problems with the background technique were uncovered by either of these alternative versions of the 36 standard fits. In all cases the value was consistent with our standard value. 80% of the 36 “tagged only” fits and 94% of the 1/2 sideband fits returned values within the dashed horizontal lines of Figure 4. The remaining fits were at most 3/4 of their error bar away from these lines.
We have presented a new measurement of the lifetime ratio between a CP even final state, and a CP mixed decay, of . Our analysis techniques have been designed to minimize the relative systematic errors between these samples, rather than to obtain the best statistical error on the lifetime under the assumption of a pure exponential decay. For example, inclusion of the decay mode would essentially double our statistics for the lifetime. In addition, there are systematic error sources such as the overall distance scale error which affects our absolute lifetime but not the lifetime ratio which is the principle result reported here.
E791 [1] measures . Combining this and their measurements of the and lifetimes, we obtain a value of which is consistent with our measured value of .
A more recent result exists from the CLEO Collaboration. CLEO searches for mixing effects by studying the possible interference of mixing with direct doubly-Cabibbo-suppressed decays in the time evolution of decays [5]. They report a 95% confidence level range on a variable they call of . If the level of CP violation in charm decays is negligible, the CLEO variable is a rotational transformation of the variable reported here and a variable which depends on the CP eigenstate mass difference with the angle of rotation being due to a strong phase shift. Theoretical estimates on the size of this angle differ significantly [6] making a precise comparison of our result with the CLEO result impossible at the present time.
Because of our high statistics, the error on reported here can be reliably interpreted as a Gaussian error for the purposes of combining with other measurements (e.g. The versus in a domain about the fit minimum is well fit by a parabola). Our measurement represents the most precise direct measurement of the neutral meson CP eigenstate lifetime difference. A wide range of Standard Model and non-Standard Model predictions on mixing through the width difference appear in the literature [7].
We wish to acknowledge the assistance of the staffs of Fermi National Accelerator Laboratory, the INFN of Italy, and the physics departments of the collaborating institutions. This research was supported in part by the U. S. National Science Foundation, the U. S. Department of Energy, the Italian Istituto Nazionale di Fisica Nucleare and Ministero dell’Università e della Ricerca Scientifica e Tecnologica, the Brazilian Conselho Nacional de Desenvolvimento Científico e Tecnológico, CONACyT-México, the Korean Ministry of Education, and the Korean Science and Engineering Foundation.
References
- [1] E791 Collab., E. M. Aitala et al., Phys. Rev. Lett. 83 (1999) 32.
- [2] E687 Collab., P. L. Frabetti et al., Nucl. Instrum. Methods Phys. A 320 (1992) 519.
- [3] See for example E687 Collab., P. L. Frabetti et al. Phys. Rev. Lett. 70 (1993) 1755 ; Phys. Rev. Lett. 71 (1993) 827 ; Phys. Lett. B323 (1994) 459.
- [4] Particle Data Group, C. Caso et al., Eur. Phys. J. C3 (1998) 1.
- [5] CLEO Collab., R. Godang et al., CLNS-99-1659, Dec 1999, submitted to Phys. Rev. Lett. e-Print Archive: hep-ex/0001060.
- [6] A. F. Falk, Y. Nir, A. A. Petrov, JHEP 9912:019,1999.
- [7] Harry Nelson, UCSB HEP 99-08 (Aug. 1999), e-Print Archive: hep-ex/0001060 and references therein; E. Golowich, Proceedings of the Conference on B Physics and CP Violation, Honolulu, HI (March 1997) and references therein; A.A. Petrov, Phys. Rev. D56 (1997)1685; E. Golowich and A.A. Petrov, Phys. Lett. B427 (1998) 172; J.F. Donoghue, E. Golowich,B.R. Holstein and J. Trampetic, Phys. Rev. D33 (1986) 179; T. Ohl et al., Nucl. Phys. B403 (1993) 605; S. Bergmann, Y. Grossman, Z. Ligeti, Y. Nir, A. A. Petrov , FERMILAB-Pub-00/102 (May 2000), e-Print Archive: hep-ph/0005181.