CURRENT STATUS OF THE K2K LONG-BASELINE NEUTRINO-OSCILLATION
EXPERIMENTaaaTalk at XXXVth Rencontres de Moriond “Electroweak
interactions and unified theories”, Les Arcs, Savoie, France,
March 11-18, 2000.
The transparencies used in this talk can be found in
http://neutrino.kek.jp/õyama/public.html
The K2K (KEK to Kamioka) long-baseline neutrino-oscillation experiment was successfully started in early 1999. A total intensity of protons on target, which is about 7% of the goal of the experiment, was accumulated in 39.4 days of data-taking in 1999. We obtained 3 neutrino events in the fiducial volume of the Super-Kamiokande detector, whereas the expectation based on observations in the front detectors is 12.3. An analysis of oscillation searches from the view points of absolute event numbers, distortion of neutrino energy spectrum, and ratio is in progress.
1 Introduction
The K2K experiment is the first long-baseline neutrino-oscillation experiment using an artificial neutrino beam. Almost a pure beam from decays is generated in the KEK 12-GeV/c Proton Synchrotron, and is detected in Super-Kamiokande (SK) 250km away. Neutrino oscillation can be examined from characteristics of the neutrino events observed in SK. The nominal sensitive region in the neutrino-oscillation parameters is eV2, which covers the parameter region suggested by the atmospheric neutrino anomaly observed by several underground experiments, and confirmed by SK. The sensitive regions on the neutrino oscillation parameters for oscillation and oscillation are shown in Figure 1.


2 Neutrino beam and detectors
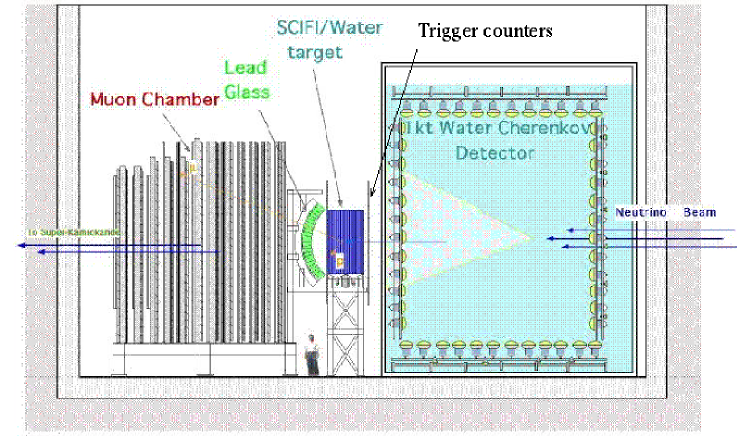
The K2K experiment consists of (1)a proton synchrotron and neutrino beam line including magnetic horns and various beam monitors, (2)two front detectors (1kt water Cherenkov detector (1KT) and so-called Fine Grained detector (FGD)) 300m downstream of the target and (3)SK as a far detector. The detailed design and performance of those components were already presented in Ref.2, and are not discussed in this report. Instead, the design of the neutrino beam line and the property of the neutrino beam are given in Table 1. The design, performance and event rate of the detectors are summarized in Table 2. A schematic view of the K2K front detector is also shown in Figure 2.
| Neutrino beam line | |
|---|---|
| proton momentum | 12 GeV/c |
| proton intensity | 5.4 |
| extraction mode | fast extraction |
| beam duration | second for every 2.2 second |
| target | 3cm 65cm Aluminum |
| decay tunnel | 200 m |
| Property of the neutrino beam | |
| mean energy | 1.4 GeV |
| peak energy | 1.0 GeV |
| flux at 300m downstream | 1.7 for p.o.t |
| flux at 250km downstream | 1.3 for p.o.t |
3 Summary of the data in 1999
The K2K experiment was successfully started in early 1999. The first neutrino beam was generated on January 27. After machine studies and beam tuning, the first physics run was started on March 3. In 1999, about 100 days of physics data-taking was scheduled. However, the successful physics data-taking was only for 39.4 days, due to some problems with the neutrino beam line. On June 19, the first neutrino event was observed in SK. In the 1999 run, the integrated proton intensity was p.o.t. (protons on target), which is about 7% of the goal of the experiment, p.o.t.
The neutrino beam direction has been confirmed to agree with the direction of the SK detector within 0.3 mrad based on the data of the beam monitors. Because the absolute flux and energy spectrum of the neutrino beam are expected to be almost the same within 3 mrad, the adjustment of the neutrino beam direction is sufficient.
The selection of neutrino events in SK employs the time difference between the neutrino beam and each event. Considering the neutrino beam duration (1.1sec) and accuracy of the absolute time determination (sec), events within a 1.5sec time window covering the neutrino beam period are selected. A total of 12 events have been found, which includes events in the inner counter, in the outer counter and interactions in the surrounding rock. Among them, 3 events were detected in the fiducial volume of the inner counter. Because the expected atmospheric neutrino background in the fiducial volume within the neutrino beam period is calculated to be events, the 3 events in the fiducial volume are a clear signal of neutrinos from KEK.
| Front detectors 300m downstream | |
|---|---|
| (A)1kt water Cherenkov Detector | |
| design | 1/50 (total volume) miniature of the Super-Kamiokande detector. 496 tons of |
| water are viewed by 860 20-inch PMTs. The fiducial mass is 50.3 ton. | |
| purpose | direct comparison with neutrino events in Super-Kamiokande |
| performance | identification capability: 99% |
| : 3%/ | |
| event rate | 0.01 events/spill in fiducial volume; 2 events for p.o.t. |
| (B)Fine Grained Detector | |
| design | consists of a scintillating fiber tracker, trigger counters, |
| lead-glass counters and muon chamber | |
| purpose | precise measurement of the neutrino-flux profile and energy distribution |
| (B-1)scintillating fiber tracker (SFT) | |
| design | 20 layers “sandwich” of scintillating fiber (0.7mm) sheets and water in aluminum |
| containers. The sensitive area is 2.4m 2.4m; the fiducial mass is 5.94 tons | |
| function | track reconstruction of charged particles and identification of the kinematics |
| of neutrino interactions. Water is used as the target material. | |
| performance | detection efficiency of each layer: 99% |
| position resolution: m | |
| event rate | 0.001 events/spill, 2 events for p.o.t. |
| (B-2)trigger counters (TRG) | |
| design | 80 large plastic scintillators (466cm (L)10.7cm(W)4.2cm(T)) |
| covering upstream and downstream of the scintillating fiber tracker | |
| function | rejection of cosmic ray muons and neutrino events from 1kt water |
| Cherenkov detector, and measurement of the absolute event time | |
| performance | timing resolution: 2nsec |
| position resolution: 5cm | |
| detection threshold@center of the scintillators: 1.7MeV | |
| detection efficiency for a penetrating charged particle: 99% | |
| (B-3)lead glass counters (LG) | |
| design | 600 lead glass counters with acceptance of 11.3cm 12.2 cm each |
| function | identification of electrons from the energy deposit in the counter |
| performance | : |
| (B-4)muon chamber (MUC) | |
| design | 12 layers “sandwich” of 900 drift chambers and iron filters(10cm-20cm thickness) |
| function | measurement of the muon energy from the range |
| performance | position resolution: 2.2mm |
| detection efficiency of each layer: 99%; | |
| Far detector (Super-Kamiokande) 250km downstream | |
| design | 50kt huge water Cherenkov detector at about 1000m underground |
| 22.5kt of the fiducial volume is viewed by 11164 20-inch PMTs | |
| performance | identification capability: 99 %; |
| : 3%/ | |
| : 3% | |
| accuracy of absolute event time adjustment with neutrino beam: 0.3sec | |
| event rate | 0.3 events/day, 172 events for p.o.t. |
4 Present status of data analysis
Strategies concerning oscillation searches at K2K are summarized as follows. The oscillation can be examined by a disappearance of neutrino events in SK because the energy of the neutrino beam is smaller than the production threshold. To recognize a reduction of neutrino events efficiently, expected event number without oscillation must be accurately estimated using the observed event numbers in the front detectors.
In addition, the neutrino energy spectrum in SK should be distorted in the case of oscillation because the oscillation probability depends on the energy of the neutrinos. Therefore, the expected neutrino energy spectrum for no oscillation must be calculated from an extrapolation of the spectrum in the front detectors.
An examination of the oscillation is an appearance search. A possible excess of electron neutrino events in SK is direct evidence of the oscillation, because the beam from KEK is almost pure muon neutrinos in the case of no oscillation, and because the particle identification capability in SK has already been proved to be excellent. In order to attain a better oscillation sensitivity, the fraction of electron neutrinos in the original neutrino beam, which is estimated to be about 1% from a Monte-Carlo simulation, must be experimentally measured as precisely as possible. Therefore, the ratio observed in the front detectors is a key point of the oscillation analysis.
The following three subsections discuss the present status of the front detector analysis along these three strategies, i.e. (1)absolute event number, (2)shape of the neutrino energy spectrum, and (3) ratio. At present, those studies are impossible in SK because the statistics is not sufficient.
4.1 absolute event numbers
The expected event numbers in SK () are calculated based on the observed event numbers in the front detectors, and extrapolation of the front detector to SK. is written as
where is the observed event numbers in the front detectors; and are the calculated event numbers in SK and the front detectors, respectively, using the same simulation program. We employed neutrino interactions in 50.3 tons fiducial volume of 1KT for and . In addition, neutrino interactions in the scintillating fiber tracker and the muon chamber were also used to examine the consistency between the observations in the front detectors. The results are summarized in Table 3. , which shows an agreement of observed event number with the simulation, is found to be for three independent observations, and is consistent with each other.
The expected event number in SK is calculated to be 12.3 in 22.5ktons of the fiducial volume, and 31 events in the total volume. Although the observed event numbers, 3 in fiducial volume and 12 in the total volume, are considerably smaller than the expectations, nothing can be concluded about the neutrino oscillation at this stage because of poor statistics.
| detector | Fiducial | Event | Event numbers in SK | ||
| mass (ton) | number | (fid. vol.) | (total vol.) | ||
| 1kt water Cherenkov | 50.3 | 17672 | 0.84 0.08 | 12.3 | 31 |
| Scintillating fiber tracker | 5.94 | 662 | 0.85 | ||
| muon chamber | 445 | 56062 | 0.85 0.11 | ||
| Super-Kamiokande data | 3 | 12 | |||


4.2 neutrino energy spectrum
To determine the neutrino energy spectrum, quasi-elastic interactions of muon neutrinos, , in the scintillating fiber tracker are employed. This is because most of the neutrino energy is transfered to the muons in quasi-elastic interactions, and the muon energy can be measured from the range in the muon chamber. The neutrino energy can be directly calculated from the muon energy with a small correction related to the scattering angle of the muon. It should also be noted that quasi-elastic scatterings are detected as single ring events in SK, and can be easily analyzed.
The muon energy distribution for quasi-elastic interactions in the scintillating fiber tracker is shown in Fig.3-(a) along with expectations from a Monte-Carlo simulation. For a comparison, the expected neutrino energy spectrum in SK is shown in Fig.3-(b) together with the spectrum for two sets of oscillation parameters, eV2 and eV2. The shape of the muon energy spectrum in Fig.3-(a) agrees with the spectrum from a Monte-Carlo simulation, and is somehow correlated with the expected neutrino energy distribution shown in Fig.3-(b). However, a calculation of neutrino energy spectrum from the muon energy distribution, and its extrapolation to SK is still being studied.
4.3 ratio
The ratio in the front detectors are independently measured using 1KT and FGD.
As reported in Ref.21, the e/ identification analysis in water Cherenkov detectors employs a likelihood function which quantitatively evaluates the agreement of the Cherenkov ring patterns with electrons and with muons. The likelihood distribution for the neutrino beam obtained in the 1KT is shown in Fig.4-(a) together with an expectation from a Monte-Carlo simulation. The likelihood distribution for atmospheric neutrino interactions obtained by SK is shown in Fig.4-(b) for a comparison. In Fig.4-(b), two peaks corresponding to electron neutrinos and muon neutrinos can be clearly distinguished. On the other hand, in Fig.4-(a), most of the Cherenkov ring patterns are judged to be muons, and the agreement with the distribution for a Monte-Carlo simulation is excellent. Although the ratio experimentally obtained in 1KT is found to be as small as the Monte-Carlo expectation, the numerical results are still being analyzed.

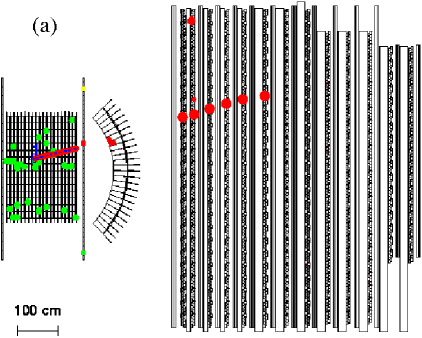
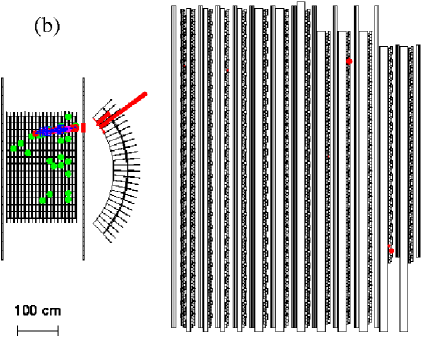
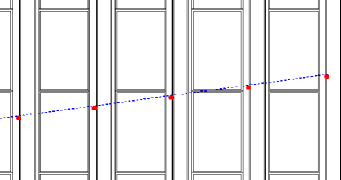
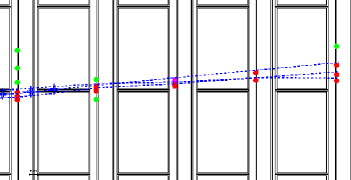
The identification of an electron neutrino event in the FGD uses the response of each detector component for electrons and muons. A typical muon neutrino event and an electron neutrino event are shown in Fig.5-(a) and Fig.5-(b), respectively. In Fig.5-(a), a muon is generated in the water target of the scintillating fiber tracker, and produces a clear and long single muon track. The muon penetrates the trigger counters and the lead-glass counters, and is stopped in the middle of the muon chamber. In Fig.5-(b), on the other hand, the electron produces an electromagnetic shower in the scintillating fiber tracker; three charged particles are generated as shown in the expanded view of Fig.5-(b). These charged particles lose all of their energies in the lead glass counters by producing a further electromagnetic shower. No particles escape from the lead-glass counters. Considering these characteristics, electron neutrino events are identified by (1)a large track multiplicity in the scintillating fiber tracker, (2)a large energy deposit in the lead glass counters, and (3)an absence of tracks in the muon chamber. Specially, the selection using the lead glass counters is efficient to separate muons and electrons because the energy deposit from a single muon in the lead-glasses is found to be 450150 MeV from cosmic-ray muon data, and energy resolution for 1 GeV electron is about 10% from an electron beam test. At present, the selection criteria for the electromagnetic shower events is being tuned.
Although a small ratio is indicated by both 1KT and FGD, the numerical results on the ratio are still being studied.
5 Summary and future prospect
During 39.4 days of successful data-taking, a total intensity of protons on target were accumulated in 1999. In Super-Kamiokande, we observed 3 neutrino interactions in the fiducial volume, where the expectation is 12.3. An oscillation analysis focusing on the absolute event number, the distortion of the neutrino energy spectrum, and the ratio is in progress.
From January 2000 to March 2001, about 160 days of physics data taking are scheduled. If the data can be accumulated with 100% efficiency, we will obtain a total intensity of p.o.t., and about 70 events will be accumulated by end of March 2001.
References
References
- [1] K.Nishikawa et al., KEK-PS proposal, Nucl.Phys.B (Proc. Suppl.) 59,289(1997).
- [2] Y.Oyama, hep-ex/9803014 (1998).
-
[3]
K.S.Hirata et al., Phys.Lett.B205, 416 (1988); K.S.Hirata et al., Phys.Lett.B280, 146 (1992);
E.W.Beier et al., Phys.Lett.B283, 446 (1992); Y.Fukuda et al., Phys.Lett.B335, 237 (1994);
S.Hatakeyama et al., Phys.Rev.Lett 81,2016(1998). -
[4]
D.Casper et al., Phys.Rev.Lett. 66, 2561 (1991);
R.Becker-Szendy et al., Phys.Rev. D46, 3720 (1992). - [5] W.W.M.Allison et al., Phys.Lett.B391, 491 (1997).
-
[6]
Y.Fukuda et al., Phys.Lett.B 433,9 (1998); Y.Fukuda et al., Phys.Lett.B 436,33 (1998);
Y.Fukuda et al., Phys.Rev.Lett. 81,1562 (1998); Y.Fukuda et al., Phys.Rev.Lett. 82,2644 (1999). - [7] C.Athanassopoulos et al. (LSND collaboration), Phys.Rev.Lett. 81, 1774 (1998).
- [8] M.Shiozawa, in these proceedings.
- [9] F.Dydak et al. (CDHS collaboration), Phys.Lett.B134, 281 (1984).
- [10] F.Bergsma et al. (CHARM collaboration), Z.Phys. C40, 171 (1988).
- [11] MINOS collaboration, “P-875:A long baseline neutrino oscillation experiment at Fermilab”, NuMI-L-63, Feb.1995.
- [12] L.Borodovsky et al. (E776 collaboration), Phys.Rev.Lett. 68, 274 (1992).
- [13] G.S.Vidyakin et al. (Krasnoyarsk collaboration), JETP Lett. 59, 390 (1994).
- [14] B.Achkar et al. (Bugey collaboration), Nucl.Phys. B434, 503 (1995).
- [15] B.Armbruster et al. (KARMEN collaboration), Phys.Rev. C57, 3414 (1998).
- [16] G.Zacek et al. (Gosgen collaboration), Phys.Rev. D34, 2621 (1996).
- [17] M.Apollonio et al. (Chooz collaboration), Phys.Lett.B 466,415 (1999).
- [18] F.Boehm et al. (Palo Verde collaboration), hep-ex/0003022 (2000).
- [19] Y.Oyama (Kamiokande high energy), Phys.Rev.D 57,6594 (1998).
- [20] Y.Yamanoi et al.,“Large Horn Magnet at KEK neutrino beam line”, KEK Preprint 97-225 (1997); Y.Yamanoi et al.,“Large Horn Magnet at KEK neutrino beam line — part2”, KEK Preprint 99-178 (1999).
- [21] S.Kasuga et al., Phys.Lett. B374, 238 (1996).
- [22] A.Suzuki et al.,“Design, construction and operation of SciFi tracking detector for K2K experiment”, in Proceedings of INSTR99, Hamamatsu (1999), to appear in Nucl.Instrum.Meth A.