Large-Area Scintillator Hodoscope with
50 ps Timing Resolution Onboard BESS
Abstract
We describe the design and performance of a large-area scintillator hodoscope onboard the BESS rigidity spectrometer; an instrument with an acceptance of 0.3 m2sr. The hodoscope is configured such that 10 and 12 counters are respectively situated in upper and lower layers. Each counter is viewed from its ends by 2.5 inch fine-mesh photomultiplier tubes placed in a stray magnetic field of 0.2 Tesla. Various beam-test data are presented. Use of cosmic-ray muons at ground-level confirmed 50 ps timing resolution for each layer, giving an overall time-of-flight resolution of 70 ps rms using a pure Gaussian resolution function. Comparison with previous measurements on a similar scintillator hodoscope indicates good agreement with the scaling law that timing resolution is proportional to 1/, where is the effective number of photoelectrons.
keywords:
BESS, cosmic-ray antiproton, particle identification, time-of-flight, scintillation counter, finemesh photomultiplier tube.PACS:
07.75.+h, 29.40.Mc, 95.55.Vj, 85.60.Ha, , , , , , , , ,
1 Introduction
BESS is a balloon-borne rigidity spectrometer having an acceptance of 0.3 m2sr designed [1] as an omni-purpose spectrometer with special emphasis given to the measurement of cosmic-ray antiprotons. In three consecutive scientific flights over northern Canada (1993–1995), we measured the rigidity (, momentum per charge), velocity, and d/d of about 12 million cosmic-ray particles transversing through it. The first mass-identified, and thus unambiguous, detection of cosmic-ray antiprotons was achieved by BESS’93 in the kinetic energy range from 0.3 to 0.6 GeV [2]. In 1995, time-of-flight (TOF) resolution was improved from 280 to 110 ps, which led to background-free detection of 43 antiprotons with energies from 0.18 to 1.4 GeV [3].
When we search for low energy “primary” antiprotons from novel sources [4], the statistical accuracy must be improved and the energy range of antiproton identification enlarged so that the expected peak of “secondary” antiprotons at 2 GeV, i.e., those produced by collisions of high energy cosmic-rays with Galactic interstellar medium, can be detected and its absolute flux measured. Independent of the search for the novel primary antiproton component, precise measurement of the secondary antiprotons is in itself crucially important both to understand solar modulation and determine the propagation mechanism of cosmic-rays in the Galaxy.
Accordingly, we proposed [5] obtaining background-free, positive (mass-identified) detection of antiprotons up to 3 GeV by improving the timing resolution of TOF counters to 50 ps [6] and eliminating the overwhelming background with a threshold-type aerogel Čerenkov counter having a refractive index of 1.02 to 1.03. A reduction in timing resolution is also necessary to identify light isotopes in cosmic-rays.
Having described the performance of the aerogel Čerenkov counter [7], here we present the design, construction, and performance of the enhanced TOF system.
2 Spectrometer
Figure 1 shows a cross-section of the BESS rigidity spectrometer [2, 8] in its ’97 configuration. The spectrometer consists of a superconducting solenoidal magnet, inner drift chambers (IDCs), a JET drift chamber, a TOF plastic scintillation hodoscope, and an aerogel Čerenkov counter. A uniform field of 1 Tesla is produced by a thin (4 g/cm2) superconducting coil [9] which allows particles to pass through with small interactions. The magnetic field region is filled with the central tracking volume. The employed geometry gives an acceptance of 0.3 m2sr, being an order of magnitude larger than that of previous cosmic-ray spectrometers. Tracking is performed by fitting up to 28 hit-points in the drift chambers, resulting in a magnetic-rigidity resolution of 0.5 % at 1 GV/. This continuous, redundant, three-dimensional tracking enables recognizing multi-track events and tracks having interactions or scattering: a feature minimizing such background. The upper and lower scintillators provide two independent d/d measurements and the TOF of particles. We also measure d/d in the drift chamber gas obtained as a truncated mean of the integrated charges of hit pulses.
Unlike the BESS’95 configuration in which two layers of TOF counters were both cylindrically arranged at a radius of 660 mm, in the new arrangement the upper and lower layers have a respective radius of 804 and 756 mm. The extension of path length from upper to lower layer and the upgraded timing resolution improve velocity measurements.

3 TOF hodoscope and PMT
The TOF hodoscope consists of 10 upper and 12 lower plastic scintillation counter paddles (950 100 20 mm3, BICRON BC-404, refractive index = 1.58). A light guide (Fig. 2), made of a UV-transparent acryl plate (Mitsubishi Rayon, = 1.52), is glued with optical epoxy (BICRON BC-600, = 1.56) to each end of the scintillator and connected to a 2.5 inch fine-mesh (FM) magnetic-field-resistant photomultiplier tube (PMT) (Hamamatsu R6504S) having an effective photocathode diameter of 52 mm. To minimize loss of photoelectrons due to magnetic effects, PMTs are placed tangential to the light guide with the result that the angle between PMT axis and magnetic field lines is less than (Fig. 3). For a nominal central magnetic field of 1 Tesla, the stray field at PMT positions is 0.2 Tesla. PMT ends with attached light guide are fit into circular holes in an aluminum plate. Four springs (Fig. 2) are used to prevent separation from the light guide. To minimize shock and vibration during shipping, launching, and landing, a 1-mm-thick silicon pad (Shin-Etsu OF113, = 1.51) is sandwiched between the light guide and PMT. Both sides of the pad are coated with optical grease (Shin-Etsu Optseal, = 1.47).


The most suitable shape of the light guide with regard to timing resolution and effective [10] number of photoelectrons () was determined by investigating various fish-tail-shaped light guides using a simulation code (GUIDE7 [11]) and cosmic-ray and beam test data. After selecting three candidates in which the shape of the planes were optimized based on simulations and cosmic-ray data, the best was determined using the beam test data.
In the ’95 flight, we individually wrapped scintillators with a white sheet (Millipore IPVH00010, white filter paper) for diffusive reflection of light. As the sheet ended up partially sticking to the scintillator, the light collection efficiency might have been reduced. Accordingly, other wrapping materials were considered and aluminized Mylar was selected. Scintillators and light guide are respectively wrapped in a 50- and 25-m-thick sheet of aluminized Mylar, and then collectively wrapped in a 200-m-thick sheet of black vinyl for light shield.
The PMTs have a bialkali (Sb-Rb-Cs, Sb-K-Cs) photocathode whose effective diameter is typically 52 mm, being about 2.0 times larger area compared to that of the 2 inch FM-PMT used in the ’95 flight. They exhibit a wide sensitivity for wavelengths from 300 to 650 nm, which well matches the scintillator light spectrum having maximum emission at 408 nm. The PMT has 19 dynodes which are situated parallel to the next dynode and separated about 0.8 mm apart. Electrons are accelerated by parallel electric fields between the dynodes; hence allowing the device to be used in a strong magnetic field as far as the direction of the magnetic field (0.2 Tesla) is parallel to the PMTs longitudinal axis. Figure 4 shows a circuit diagram of the voltage divider in which the signal from the anode provides timing information and that of the 19th dynode is used as a first-level trigger. Signals from the 13th and 18th dynodes are used for the charge measurement. Though the signal of FM-PMT is generally difficult to saturate, highly charged particles in the cosmic-ray experiment generate the signal with huge charge and cause the saturation of the signal. The signal from the 13th dynode is used for highly charged particles since it is difficult to saturate compared to the 18th one.

As indicated in Fig. 4, capacitors (C8–C12,C14) connect dynodes following the 13th and ground. These capacitors serve to reduce crosstalk of the 13th dynode, which is affected by the large charge in cascading dynodes due to highly charged particles. Accordingly, the signal from 13th dynode is available for these particles. Its performance was tested using a blue LED (NICHIA,NLPB) in which light input to PMT was reduced by an optical filter (Fuji-film, ND filter) while the light output of the LED was constant.
Figure 5 shows analog-to-digital converter (ADC) counts versus , i.e., light input illumination to the PMT, for both the anode and the 13th dynode, where the 13th dynode demonstrates good linearity and no saturation up to the = 4 ; a value corresponding to times the light output of minimum ionizing particles. is evaluated as , where ADC is mean ADC counts and the rms of the ADC distribution.

4 Principle of timing measurement
We discuss here on the crossing time of a particle and time-of-flight, i.e., their difference between upper and lower layers of TOF counters of the BESS spectrometer.
PMT signals have time jitter associated with pulse height variation, the so called time-walk effect [12]. The crossing time measured by time-to-digital converter (TDC) must therefore be corrected for this effect. The time-walk corrected timing for PMT , , can be well fitted with
| (1) |
where , , and are respectively the measured TDC time, measured integrated charge of the PMT signal, and a correction parameter determined by data fitting. Subscripts 1 and 2 are used to denote PMTs at each end of a TOF counter.
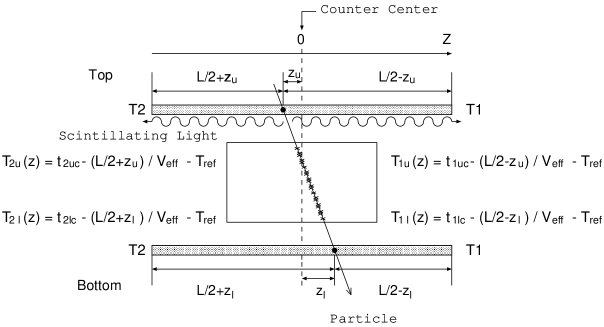
Using the time-walk corrected timing for each PMT, we can calculate the crossing time based on the hit position and timing information. The hit position of a counter is defined using the -axis along the counter’s longitudinal direction (Fig. 6) in which the center of the counter is considered . Extrapolation of the trajectory determined by the central trackers (JET, IDCs) with good precision enables tracing back exactly to the impact points ( and - position) on the TOF counters. Crossing time of a particle is measured as the time difference between the reference time, , taken as the TDC common start time, and the time when a particle crosses the TOF counter. That is, for PMT , are
| (2) |
where and are the time-walk corrected timing and reference time, while is the hit position of the counter, the length of the counter including light guides, and the effective velocity of light in the scintillator.
Crossing time of a TOF counter is then obtained using and in which the weighted average of these crossing time measurements, , is
| (3) |
where and are the timing resolution of , as a function of , respectively. Using the crossing time for upper and lower TOF counters, and , which are determined by Eq. (3), the TOF of the BESS spectrometer, , is expressed as . It is important to note that in the equation on , since in and cancel out, time jitter regarding reference time has no effect on the resolution of .
5 Beam test performance
5.1 Beam line
Performance of the TOF counter was evaluated by beam test under no magnetic field. Beam tests were performed at KEK in -2 beam line using 1 GeV/ proton()/ beams and a 4 GeV/ beam. Figure 7 shows the employed setup, where S1–S6 are trigger counters that provide data used for / separation by TOF measurement. S3 and S4 are reference counters (5(w) 10(h) 10(t) mm3) which generate TDC start and determine beam position. T1 and T2 are FM-PMTs of the TOF counter, each having an anode pulse height adjusted to 2 V for minimum ionizating ’s vertically incident to the counter center. For the data-taking, the CAMAC system was employed through the beam test. ADC (LeCroy 2249W, 0.25 pC/count), TDC (Phillips 7186, 25 ps/count), and discriminator (Phillips 708, 300 MHz) were used as the CAMAC modules. The optimal threshold to timing measurement was found to be 20 mV to obtain best timing resolution. Position dependence of counter performance was investigated by obtaining 19 data points along the -direction (Fig. 6) at 50 mm intervals.

5.2 Performance
5.2.1 Timing resolution
In the analysis of beam test data, the timings of the reference counters, S3 and S4, are used as the reference time . The position of the reference counters defines the beam position with an accuracy of mm. These values are used to determine and in Eqs. (2). Because the reference counters are located very close to the test counter (Fig. 7), the jitter caused by the change of the beam status during passing through these counters is negligibly small for the beam crossing times of these counters. Accordingly, there is a relationship among the measured rms of and the timing resolution of and the timing resolution of , i.e.,
| (4) |
where , , , and are respectively the measured rms of , timing resolution of , timing resolution of , and the time jitter due to beam width. The resolution of the reference time is estimated as described next. Considering the reference time to be the mean time of adjacent trigger counters S3 and S4 (Fig. 7), the time-walk corrected timing for S3 and S4 ( and ) gives . The rms of the distribution of is then used to estimate the timing resolution of , which allows determining as 33 ps. The can be estimated to be 4.6 ps(=15.92 ps/121/2) by assuming = 157 mm/ns (See section 5.2.2).
Estimation of the timing resolution for a particular PMT at the counter center () is then possible. That is, since the rms of the distribution, , was found to be 76 ps, the relation allows determining the timing resolution per PMT, , as 68.3 ps.
Estimation of the timing resolution per counter is similarly performed. Assuming that the timing resolution of and are the same at the counter center (), namely , the beam crossing time for the counter at is simply given as the mean time from Eq. (3), i.e.,
| (5) |
From Eq. (5) the timing resolution per counter, , can be estimated from the rms of the distribution. As the term subtracts out in , the rms of can be regarded as the timing resolution per counter at . From the rms of for a pion beam, is estimated to be 49.0 ps (Fig. 8). Since the rms of the distribution of , , includes and in quadrature (), 60.3 ps obtained from the rms is consistent with ps.
Now, using the timing resolution per PMT, 68.5 ps at , the timing resolution per counter at can also be estimated in another way. Since we assume that and are the same at , can be expressed as
| (6) |
is accordingly estimated to be 48.4 ps, which is consistent with 49.0 ps estimated from the rms of the distribution.
Apart from the ’s beam, we also estimate the timing resolution using a 1 GeV/ proton beam. Since 1 GeV/ proton has smaller ) than that of 1 GeV/ , the d/d is larger than that of , resulting in better timing resolution. In a 1 GeV/ proton beam, from is similarly estimated to be 41.5 ps.

Hereafter we discuss on the -dependence. We studied the scale factor of per ADC count in advance by using LED and electronics of beam test setup. Using the scale factor, per PMT is at the counter center for a minimum ionizing . This value is substantially larger compared to BESS’95 [8] due mainly to using a larger photocathode to improve light collection. The increase in is considered essential in the improvement of timing resolution per counter from 78 to 50 ps.
Figure 9(a) shows detected by PMT1 as a function of , where is about 2 times larger at the nearest point than that at the furthest point. Corresponding plots for timing resolution of each PMT and TOF counter (by weighted average from Eq. (3)) are shown in Fig. 9(b). Although a PMT’s timing resolution improves as increases, ranging 50 to 100 ps, the resolution of the counter is 50 ps over the entire scintillator length (95 cm) and is independent of the hit position.

5.2.2 Effective propagation velocity of scintillation light
Figure 9(c) shows variations in and (Eq. (1)) over , and streight lines corresponding to = 157 mm/ns. Figure 9(d) and (e) show the deviation() of and from the timing calculated using = 157 mm/ns. The -corrected timing determined with constant does not show good linearity along . When the timing resolution should be evaluated at any -position, it is mandatory to correct for . The for each counter shows the same tendency, but they are slightly different counter by counter. Their differences seem to come from the wrapping condition of each counter. In a beam test, we confirmed the differences among several counters of the same type and the differences among counters with different wrapping materials.
6 Performance Test with Cosmic-Rays
Using the full BESS’97 configuration (Fig. 1), counter performance was evaluated with cosmic-ray data collected at ground-level at KEK during May 1997. That is, cosmic-ray muons were measured under a nominal central magnetic-field of 1 Tesla using the full electronics and trigger system of the BESS detector [8]. We use 2 hours of data (215,014 events) to estimate TOF performance. An off-line selection criteria was applied to all events: (i) proper energy loss (d/d) is required to select particles with the electric charge = 1 in the upper and lower scintillator as well as in the JET chamber, and (ii) track quality cuts [2, 3] are applied to ensure sufficient quality of tracks.
The measured timing was corrected for time-walk correction, and -dependent timing using . To evaluate counter performance for particles with , negatively charged muons are selected in the rigidity range from –5 to –2.5 GV/. Figure 10 shows electron/muon (/) bands after the cuts of d/d, track quality, and , where the / sample area is indicated (dashed rectangle). Since the selected sample mainly consists of muons, we treated all of them as muons. Based on the selected sample, timing resolution was determined by calculating , which is the difference between the TOF obtained from the data of TOF PMTs, (defined in section 4), and the TOF expected from the tracking information, , i.e.,
| (7) |
| (8) |
where is the path length of the incident particles from upper to lower layer, and the velocity of light. Since the error in is relatively small, the error in (Eq. (8)) is also negligible and the rms of , being 71 ps which is consistent with the result of the beam test, therefore represents the resolution of the TOF hodoscope in the BESS detector.


Figure 11 shows the distribution fitted to a pure Gaussian resolution function with no tail. Actually, however, since is the time-of-flight between upper and lower TOF counters, each individual counter has a timing resolution of 50 ps.
7 BESS’97 vs. BESS’95 data
The improvement in TOF resolution from BESS’95 to BESS’97 is easily seen in Figs. 13 and 13 for ground (using the same muon sample as selected in section 6) and flight data (using proton sample with momentum more than 20 GeV/), respectively, being consistent with the increase in . The per PMT at counter center increased from 200 (BESS’95) to 500 (BESS’97), with timing resolution being proportional to 1/ [13]. The linear relation between timing resolution per PMT and is shown in Fig. 14, where the is the effective number of photoelectrons per one PMT. The data were taken both at the counter center in beam tests. The solid line in Fig. 14 is a fit with a function of , where ps. The scintillators of the BESS’95 and BESS’97 TOF counters are the same size, and their light guides have similar shapes. As mentioned earlier , however, the use of a 2.5 inch vs. 2 inch PMT provides an effective photocathode area that is 2.0 times larger; a change that is mainly responsible for the higher value.


8 Summary and conclusions
Described here are improvements in the BESS TOF hodoscope due to incorporating 2.5 inch PMTs along with optimization of light guide and the wrapping material. That is, the 13th dynode, developed for highly charged particles, exhibits good linearity and no saturation up to the range corresponding to times for minimum ionizing particle, the effective number of photoelectrons at the counter center increased from 200 to 500, and the timing resolution per TOF counter was enhanced from 78 to 50 ps as measured in beam tests. Performance of the complete detector configuration was also confirmed at ground-level under a magnetic field. This improvement in the TOF counter, together with the extension of the distance from the upper to lower layer of TOF counters, contributed to achieving better mass identification of charged particles. In particular, by utilizing the TOF hodoscope together with an aerogel Čerenkov counter, the upper bound of the antiproton detectable kinetic energy range was raised from 1.4 to 3.5 GeV [14], and the capability of separating light isotopes accordingly enhanced.
References
- [1] S. Orito, Proc. ASTROMAG Workshop, KEK Report 87-19 (1987) 111.
- [2] K. Yoshimura et al., Phys. Rev. Lett. 75 (1995) 3792; A. Moiseev et al., Astrophys. J. 474 (1997) 479.
- [3] H. Matsunaga et al., Phys. Rev. Lett. 81 (1998) 4052.
- [4] K. Maki, T. Mitsui, S. Orito, Phys. Rev. Lett. 76 (1996) 3474; T. Mitsui, K. Maki, S. Orito, Phys. Lett. B389 (1996) 169.
- [5] S. Orito, KEK Proceedings 96-9 (1996) 105, edited by A. Yamamoto and T. Yoshida.
- [6] Timing resolution of 50 ps for each layer corresponds to TOF resolution of 70 ps.
- [7] Y. Asaoka et al., Nucl. Instr. and Meth. A416 (1998) 236.
- [8] Y. Ajima et al., to be published in Nucl. Instr. and Meth.
- [9] A. Yamamoto et al., IEEE Trans. Magn. 24 (1988) 1421.
- [10] R. Enomoto et al., Nucl. Instr. and Meth. A332 (1993) 129; T. Iijima et al., Nucl. Instr. and Meth. A387 (1997) 64; R. Suda et al., Nucl. Instr. and Meth. A406 (1998) 213.
- [11] T. Massam, GUIDE7: a general program for evaluating the properties of scintillation and Čerenkov counter optical systems, CERN 76-21 (1976).
- [12] W. Braunschweig et al., Nucl. Instr. and Meth. 134 (1976) 261.
- [13] W.B. Atwood, Time of flight measurements, SLAC-PUB-2620, October 1980.
- [14] S. Orito et al., Phys. Rev. Lett. 84 (2000) 1078.