GLAS-PPE/1999-22Dec 1999 00footnotetext: University of Cambridge, Cavendish Laboratory, Madingley Road, Cambridge CB3 0HE, UK. 00footnotetext: CERN, EP Division, 1211 Geneva 23, Switzerland. 00footnotetext: University of Glasgow, Department of Physics, Glasgow G12 8QQ, UK. 00footnotetext: Imperial College of Science Technology & Medicine, Blackett Laboratory, Prince Consort Road, London SW7 2AZ, UK. 00footnotetext: University of Oxford, Department of Nuclear Physics, Keble Road, Oxford OX1 3RH, UK. 00footnotetext: Rutherford Appleton Laboratory, Chilton, Didcot, Oxon OX11 0QX, UK.
The performance of a prototype Ring Imaging Cherenkov Detector is studied using a charged particle beam. The detector performance, using and air as radiators, is described. Cherenkov angle precision and photoelectron yield using hybrid photo-diodes and multi-anode PMTs agree with simulations and are assessed in terms of the requirements of the LHCb experiment.
1 Introduction
This paper reports results from a prototype Ring Imaging Cherenkov (RICH) counter and compares the performance of Multi- Anode Photomultiplier tubes (MAPMT) and two types of Hybrid Photo-diode Detectors (HPD) for detecting the Cherenkov photons. The experimental arrangement represents a prototype of the downstream RICH detector of the LHCb experiment [1] at CERN.
The LHCb experiment will make precision measurements of CP asymmetries in B decays. Particle identification by the RICH detectors is an important tool and an essential component of LHCb. For example, separating pions and kaons using the RICH suppresses backgrounds coming from , and when selecting decays, and backgrounds coming from when selecting the decay mode.
LHCb has two RICH detectors. Together they cover polar angles from 10 to 330 mrad. The upstream detector, RICH1, uses aerogel and radiators to identify particles with momenta from 1 to 65 GeV/c. The downstream detector, RICH2, has 180 cm of radiator and identifies particles with momenta up to 150 GeV/c. It uses a spherical focusing mirror with a radius of curvature of 820 cm which is tilted by 370 mrad to bring the image out of the acceptance of the spectrometer. A flat mirror then reflects this image onto the photodetector plane. For tracks with , RICH2 is expected to detect about 30 photoelectrons [1].
The LHCb collaboration intends to use arrays of photodetectors with a sensitive granularity of covering an area of with a total of 340,000 channels, to detect the Cherenkov photons in both RICH detectors. These photodetectors are expected to cover an active area of at least 70% of the detector plane. Current commercially available devices111 Commercial HPD devices from Delft Electronische Producten (DEP), The Netherlands, Commercial MAPMT devices from Hamamatsu Photonics, Japan. have inadequate coverage of the active area and their performance at LHC speeds remains to be proven. The beam tests described here used prototypes of three of the new photodetector designs that have been proposed for LHCb.
The results from the LHCb RICH1 prototype detector tests carried out during 1997 are reported in an accompanying publication [2]. The data used in this paper were collected during the summer and autumn of 1998 at the CERN SPS facility. The main goals of these RICH2 prototype studies are:
-
To test the performance of the radiator, using the full-scale optical layout of RICH2,
-
To test the performance of the photodetectors using the RICH2 geometry by measuring the Cherenkov angle resolution and photoelectron yields.
Section 2 of this paper describes the main features of the test beam setup. Section 3 describes the simulation of the experiment and is followed by a discussion of the photoelectron yields and Cherenkov angle resolution measurements for each of the photodetectors. Finally a summary is given in Section 6, with plans for future work.
2 Experimental Setup
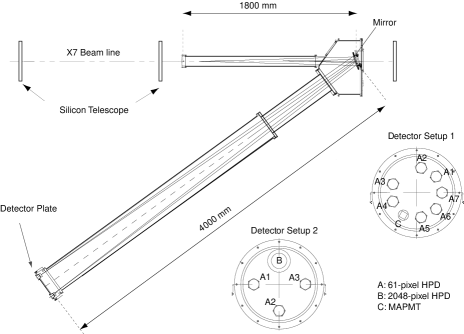
The setup included scintillators and a silicon telescope which defined and measured the direction of incident charged particles, a radiator for the production of Cherenkov photons, a mirror for focusing these photons, photodetectors and the data acquisition system. A brief description of these components is given below, and a more complete description of the experimental setup can be found in [3]. The photodetectors were mounted on a plate customised for particular detector configurations. A schematic diagram of the setup is shown in Figure 1.
2.1 Beam line
The experimental setup was mounted in the CERN X7 beam line. The beam was tuned to provide negative particles (mainly pions) with momenta between 10 and 120 GeV/c. The precision of the beam momentum for a given setting (p/p) was better than 1%. Readout of the detectors was triggered by the passage of beam particles which produced time-correlated signals from two pairs of scintillation counters placed 8 metres apart along the beam line. The beam size was as defined by the smaller of these counters.
2.2 Beam Trajectory Measurement
The input beam direction and position were measured using a silicon telescope consisting of three planes of pixel detectors. Each of these planes has a array of silicon pixels with dimensions . Two of the planes were placed upstream of the radiator and the third one downstream of the mirror. The first and third planes were separated by 8 metres.
Using the silicon telescope, the beam divergence was measured to be typically 0.3 mrad and 0.1 mrad in the horizontal and vertical planes respectively.
2.3 The RICH Detector
- Radiators:
-
During different data-taking periods, air and were used as radiators. The pressure and temperature of these radiators were monitored for correcting the refractive index [2]. The gas circulation system which provided the is described below.
During the runs, data were taken at various pressures ranging from 865 mbar to 1015 mbar and at different temperatures between and . The refractive index of as a function of wavelength at STP using the parametrization in [4] is plotted in Figure 2.

Figure 2: Refractive index of as a function of the photon wavelength at STP using the parametrization in [4]. - gas circulation system:
-
As shown in the schematic diagram in Figure 3, the prototype Cherenkov vessel was connected into the gas circulation system, which was supplied by gas 222 as supplied by CERN stores: reference SCEM 60.56.10.100.7 at high pressure. A molecular sieve (13X pore size) was included in the circuit to remove water vapour. The system used a microprocessor interface 333Siemens S595U to set and stabilise the required gas pressure and to monitor and record pressure, temperature and concentrations of water vapour and oxygen throughout the data taking. The absolute pressure of the in the Cherenkov vessel was maintained to within 1 mbar of the required value using electromagnetic valves which controlled the gas input flow and the output flow to the vent. Throughout the data taking the oxygen concentration was below 0.1 and the water vapour concentration was below 100 ppm by volume.
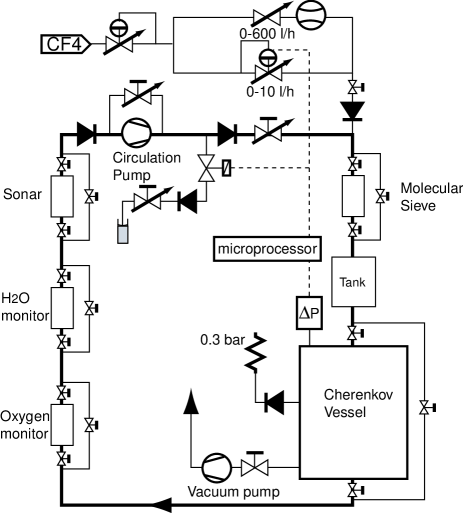
Figure 3: Schematic diagram of the gas circulation system. - Mirror:
-
The Cherenkov photons emitted were reflected by a mirror of focal length 4003 mm which was tilted with respect to the beam axis by 314 mrad, similar to the optical layout of the LHCb RICH2. Using micrometer screws, the angle of tilt of the mirror was adjusted to reflect photons on different regions of the photodetector plane which was located 4003 mm from the mirror. The reflectivity of the mirror, measured as a function of the wavelength, is shown in Figure 4.

Figure 4: Mirror reflectivity measured as a function of the photon wavelength. - Photodetectors:
-
The important characteristics of the three different designs of photodetectors tested are briefly summarised as follows:
-
The 61-pixel Hybrid Photo-Diode (HPD) is manufactured by DEP and has an S20 (trialkali) photocathode deposited on a quartz window. The quantum efficiency of a typical HPD measured by DEP, is plotted in Figure 5 as a function of the incoming photon wavelength. Photoelectrons are accelerated through a 12 kV potential over 12 mm onto a 61-pixel silicon detector. The image on the photocathode is magnified by 1.06 on the silicon detector surface. This device gives an approximate gain of 3000. The pixels are hexagonally close packed and measure 2 mm between their parallel edges. The signal is read out by a Viking VA2 [5] ASIC.
-
The 2048-pixel HPD is manufactured in collaboration with DEP. It has electrostatic cross-focusing by which the image on the photocathode is demagnified by a factor of four at the anode. The operating voltage of this HPD is 20 kV. The anode has a silicon detector, which provides an approximate gain of 5000, with an array of 2048 silicon pixels bump bonded to an LHC1 [6] binary readout ASIC. Details of this device and its readout can be found in [7].
Using the measurements made by DEP, the quantum efficiency of the S20 photocathode used on the 2048-pixel HPD is plotted in Figure 5 as a function of the photon wavelength. This tube has an active input window diameter of 40 mm and the silicon pixels are rectangles of size 0.05 mm 0.5 mm. It represents a half-scale prototype of a final tube which will have an 80 mm diameter input window and 1024 square pixels with 0.5 mm side.
-
The 64-channel Multi-Anode PMT (MAPMT) is manufactured by Hamamatsu. It has a bialkali photocathode deposited on a borosilicate-glass window and 64 square anodes mounted in an 8 8 array with a pitch of 2.3 mm. The photoelectrons are multiplied using a 12-stage dynode chain resulting in an approximate overall gain of when operated at 900 V. From the measurements made by Hamamatsu, the quantum efficiency of a typical MAPMT as a function of the wavelength is shown in Figure 5.
During some runs, pyrex filters were placed in front of the photodetectors in order to limit the transmission to longer wavelengths where the refractive index of the radiators is almost constant. In Figure 6 the transmission of pyrex as a function of photon wavelength is plotted.
-


2.4 Experimental Configurations
The detector configurations used are summarised in Table 1. In configuration 1, seven 61-pixel HPDs and one MAPMT were placed on a ring of radius 113 mm on the detector plate. In configurations 2 and 3, a 2048-pixel HPD and three 61-pixel HPDs were placed on a ring of radius 90 mm on the detector plate. In addition to these configurations, the different radiator, beam and photodetector conditions used for the various runs are shown in Table 2.
| Detector | Detector | Azimuthal |
|---|---|---|
| Configu- | Type | Location |
| ration | in Degrees | |
| 1 | A1 | 310 |
| A2 | 345 | |
| R=113 mm | A3 | 75 |
| A4 | 105 | |
| Radiator | C | 150 |
| A5 | 195 | |
| A6 | 230 | |
| A7 | 270 | |
| 2 | B | 0 |
| R=90 mm | A1 | 90 |
| Radiator | A2 | 180 |
| Air | A3 | 250 |
| 3 | A3 | 340 |
| R=90 mm | B | 90 |
| Radiator | A1 | 180 |
| Air | A2 | 270 |
| Run | Beam | Detector | Detectors |
| Num- | Type | configu- | with |
| ber | ration | Pyrex | |
| Filter | |||
| 1 | 120 GeV/c | 1 | none |
| 2 | 120 GeV/c | 1 | all HPDs |
| 3 | 100 GeV/c | 2 | none |
| 4 | 100 GeV/c | 2 | all |
| 5 | 10.4 GeV/c | 3 | none |
| 6 | 50 GeV/c | 1 | none |
2.5 Data Acquisition System
The 61-pixel HPDs and the MAPMT use analogue readout whereas the 2048-pixel HPD uses binary readout. A detailed description of their respective data acquisition systems can be found in [3] and [7].
For the analogue readout system, the mean and width of the pedestal distributions for each pixel were calculated using dedicated pedestal runs, interleaved between data runs triggered with beam. Some data were also taken using light emitted from a pulsed Light Emitting Diode (LED) for detailed studies of the photoelectron spectra. Zero suppression was not used on analogue data from the photodetectors.
A pixel threshold map was established on the 2048-pixel HPD using an LED [7]. For this, the high voltage applied on the tube was varied, and the voltage for each channel to become active was recorded. This threshold map was used to identify pixels with too low a threshold, which were then masked. It was also used to identify pixels with too high a threshold and hence insensitive to photoelectrons. A histogram of the threshold map is shown in Figure 7 where the pixels which were masked or insensitive (26) are indicated by the entries in the first bin. For this device, the noise () of the readout electronics is 160 electrons (0.6 kV Silicon equivalent) and the distribution of the silicon pixel thresholds has an rms width of 1.6 kV.

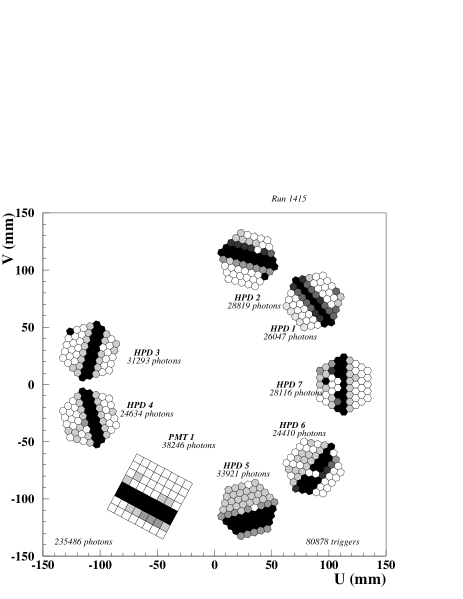
In Figure 8 an online display, integrating all events in a run, with seven 61-pixel HPDs and an MAPMT in configuration 1 is shown. Part of the Cherenkov ring falls on the photodetectors and is clearly visible.
3 Simulation of RICH2 prototype
The RICH2 prototype configurations are simulated to allow detailed comparisons of expected performance with that found in data. The simulation program generates photons uniformly in energy and with the corresponding Cherenkov angle. The trajectories of these photons, and the photoelectrons they produce, are simulated using the beam divergence, beam composition and the optical characteristics of the various components of the RICH detector shown in Figures 2 to 6. The air radiator is simulated using a gas mixture consisting of 80% Nitrogen and 20% Oxygen.
The program also simulates the response of the various photodetectors. Since the 2048-pixel HPD used binary readout, to study its response the program simulates the threshold map ( Figure 7) used for this readout. The simulation of the response of the silicon detector of this HPD is described in Section 4.1
4 Estimates of Photoelectron yield
The average number of photoelectrons detected per event in a photodetector defines the photoelectron yield for that detector. This is determined for the configurations 1 and 2 indicated in Table 1. Since the 61-pixel HPD and the MAPMT use analogue readout, the distinction between signal and background depends upon the threshold above the pedestal peak assigned to the measured photoelectron spectrum. To get the true photoelectron yield at a given threshold, estimates are made for the level of background present and for the amount of signal loss that occurs as a result of applying the threshold cut, specified in terms of the width () of the pedestal spectrum.
In the two types of HPDs, there is 18 probability [8] at normal incidence, for electrons to backscatter at the silicon surface, causing some loss of signal. In the 61-pixel HPD, the backscattered electrons can “bounce“ off the silicon surface more than once, whereas in the 2048-pixel HPD the electric field is such that they do not return to the silicon detector. Passage through the dead layers of the silicon wafer can also cause a small amount of signal loss in the HPDs. Since the 2048-pixel HPD uses binary readout, its photoelectron yield depends mainly upon the threshold map of the readout system.
From the estimate of the photoelectron yield () of a photodetector,
the figure of merit () is calculated using:
where is the fraction of the Cherenkov ring covered by the
photodetector, L is the length of the radiator and is the
mean Cherenkov angle measured using the method described in Section 5.
4.1 Photoelectron yield for the 2048-pixel HPD
The response of the silicon detector of this HPD is simulated as follows:
Each photoelectron is accelerated through a potential of 20 kV towards the silicon surface. The probability for backscattering at the silicon surface is 18 [8]. During the backscattering process, only a fraction of the 20 keV energy is released in the silicon detector. For an energy release varying from 5 to 20 keV, the energy loss in the dead layer of the silicon ranges from 5 to 1.2 keV as described in [7] and references therein. A readout channel is expected to fire only when the charge signal generated in the silicon detector exceeds the corresponding pixel threshold by at least 4 times the electronic noise.
A flat background of 0.01 photoelectrons per event is observed in the real data on the detector surface from beam related sources such as photons and photoelectrons reflected in random directions from different surfaces in the prototype. This is also incorporated into the simulation. The resultant photoelectron yield from the simulation in the presence of a pyrex filter is shown in Figure 9(a), and in the absence of any filter is shown in Figure 9(b).
The systematic error in the photoelectron yield is evaluated from the simulation by varying the parameters which are listed below. The result of these variations are tabulated in Table 3.
-
Quantum efficiency of the phototube: The quantum efficiency of the 2048-pixel HPD is found to be approximately half that of the 61-pixel HPD. The simulation is repeated by replacing the quantum efficiency of the 2048-pixel HPD with those from the 61-pixel HPD, scaled down by a factor of two.
-
Amount of photon absorption in oxygen: The simulation is repeated with and without activating the photon absorption although this is significant only for wavelengths below 195 nm.
-
Wavelength cutoff of the photocathode: To account for any variation in the active wavelength range among different versions of the photocathodes, the simulation is repeated by varying lower cutoff between 190 nm and 200 nm, and the upper cutoff between 600 nm and 900 nm.
-
Backscattering probability at the silicon surface: The simulation is repeated by varying the backscattering probability between 16 and 20 .
| Variation of yield | ||
| Simulation | with | with no |
| parameters | Pyrex | Filter |
| Quantum | 0.020 | 0.030 |
| Efficiency | ||
| Oxygen | 0.003 | 0.060 |
| Absorption | ||
| Active | 0.003 | 0.030 |
| Wavelength | ||
| Range | ||
| Back- | 0.006 | 0.014 |
| scattering | ||
| Overall | 0.021 | 0.074 |
| Variation | ||
The simulated photoelectron yield per detector in the case without any filter is 0.46 0.07, whereas in real data the yield is 0.49 (Figure 9 (b)). The simulated yield per detector, for the case with the pyrex filter, is 0.18 0.02 and the corresponding yield in real data is 0.15 (Figure 9 (a)). Using these yields, the figure of merit is estimated to be 97 16 in the case without any filter and 30 5 in the case with the pyrex filter. For the case without any filter, an independent determination [9] of the figure of merit for the same tube, agrees with the present estimate.

4.2 Photoelectron yield for the 61-pixel HPD
Figure 10 shows a typical photoelectron spectrum obtained from a single pixel in a 61-pixel HPD. The peaks corresponding to the pedestal and signal can be clearly seen. In similar distributions obtained for each of the pixels, the background contamination in the photoelectron yield and the amount of signal lost are estimated as a function of the threshold cut using two different analysis methods. One of these methods is described below and the other one is described in Section 4.3 where similar estimates are made for the MAPMT.

- Signal loss estimate:
-
The signal loss is estimated using data where the signals were provided by photons from an LED as only these runs have adequate statistics for this purpose. The signal loss is considered to have a Gaussian component and a backscattering component which are described below.
An example of the spectra for each detector pixel in LED data is shown in Figure 11. It can be divided mainly into three parts identified as distributions for the pedestal, one photoelectron and two photoelectrons, in addition to two underlying distributions corresponding to the backscattering contributions to the single and double photoelectron spectra. In order to estimate these backscattering contributions, a backscattering probability of 18 [8] is assumed. The energy distribution of the backscattered electrons is made by convoluting the distribution of the energy fraction of the backscattered electrons for 10 keV electrons incident on aluminium, obtained from [8], with a Gaussian that has the same width as that of the pedestal spectrum in LED data.
The adc spectrum in LED data is fitted with a function that modelled the spectrum as a sum of three Gaussians with contributions from two backscattering components. The three Gaussians correspond to the distributions of pedestal, one photoelectron and two photoelectrons. The result of the fit is superimposed over the adc spectrum in Figure 11. The widths of the Gaussians for the photoelectrons are then corrected to account for the slight difference in the widths of the pedestal observed in LED data and Cherenkov photon data.
In the region below the threshold cut, the sum of the area which is under the one photoelectron Gaussian and the corresponding backscattering component is then taken as the sum of the Gaussian and backscattering components of the signal loss.
This procedure is repeated using a different LED run and varying the backscattering probability between 16 and 20. The resultant variations obtained in the signal loss estimate are taken as contributions to systematic error from this method.
At the threshold cut of 3, the Gaussian component of the signal loss is 0.9 whereas the backscattering component is 11.2.

Figure 11: LED spectrum in 61-pixel HPD. The three peaks correspond to 0, 1 and 2 photoelectrons. Backscattering contributions estimated from [8] are shown as broken lines. - Background estimate:
-
The background remaining in the Cherenkov photoelectron spectrum after a given threshold cut is considered to have a Gaussian component due to electronic noise, and a non-Gaussian component induced by detector noise and photons from extraneous sources. For the first component, a single Gaussian is fit to the pedestal part of this spectrum. The area under this fit spectrum above the threshold cut is then taken as the Gaussian component of the background. This procedure was repeated changing the upper range of the Gaussian fit from 1.2 to 2 and the resultant variation in the background estimate is taken as a contribution to the systematic error.
In order to evaluate the second component, data from pedestal runs are used. The fraction of the spectrum above the threshold cut, after removing the fit single Gaussian to the pedestal spectrum, is taken as the non-Gaussian component. The variation in this estimate obtained using different pedestal runs is taken as a contribution to the systematic error.
After correcting the distribution of the number of photoelectrons in each pixel for background and signal loss, their spatial distribution on the silicon surface is fitted with a function which assumes the Cherenkov angle distribution to be a Gaussian. A residual flat background observed in this fit is considered as beam related background and is subtracted from the photoelectron signal. The fit is repeated by varying the parameters of the function and the resultant variations in the background estimate is taken as a contribution to the systematic error.
- Estimates of yield:
-
The results obtained for the photoelectron multiplicities after correcting for background and signal loss using the above method are reported below. These are in agreement with the results obtained from the alternative method described in the next section.
In these estimates, the statistical error is found to be negligible compared to the overall systematic error which is obtained by adding the various contributions in quadrature. The contributions to the systematic error are shown in Table 4. In Table 5, the corrected photoelectron yields for the data with pyrex filter and with no filter are shown along with the corresponding expectations from simulation. The yields from data and simulation agree.
As a systematic check, the stability of the corrected photoelectron yields obtained by varying the threshold cut from 2 to 5 for the data with pyrex filter, is shown in Table 6. The small variation seen in the yields between 3 and 4 is quoted as a systematic error contribution in Table 4. The fact that the corrected photoelectron yields estimated are independent of the threshold cut and that the two analysis methods yield similar results give confidence in the results shown in Table 5.
Using the yield estimates in Table 5, the figure of merit is estimated to be 89 8 in the case with pyrex filter and 258 24 in the case without any filter.
| Error Source | with | No |
| pyrex | Filter | |
| Background : | ||
| Electronics | 0.003 | 0.011 |
| Noise | ||
| (b)Detector | 0.005 | 0.009 |
| Noise | ||
| (c)Beam | 0.001 | 0.010 |
| Related | ||
| Signal loss: | ||
| (a)backscattering | 0.004 | 0.012 |
| fraction | ||
| (b)Fit Stability | 0.004 | 0.014 |
| Change of | 0.002 | 0.007 |
| Threshold | ||
| Overall error | 0.008 | 0.027 |
| Photo- | Using | Using |
| electron | Pyrex | No |
| yield | Filter | Filter |
| Real | 0.29 0.01 | 0.86 0.03 |
| Data | ||
| Simulated | 0.31 | 0.86 |
| Data |
| Threshold | Back- | Signal | Photo- |
|---|---|---|---|
| in | ground | Loss | electron |
| Number | (%) | yield | |
| of | |||
| 2 | 1.36 | 7.8 | 0.29 |
| 3 | 0.19 | 12.1 | 0.29 |
| 4 | 0.08 | 18.2 | 0.29 |
| 5 | 0.06 | 31.4 | 0.30 |
4.3 Photoelectron yield for MAPMT

Figure 12 shows a typical pulse height distribution for a pixel in the MAPMT in beam triggered runs. The photoelectron signal and pedestal peaks can be clearly distinguished. The amount of signal lost and the amount of background contamination to the photoelectron yield are estimated using the method described below.
- Signal loss estimate:
-
This method also uses data where the photons from an LED provided signals to the MAPMT. A Gaussian is fit to the pedestal part of the pulse height distribution. The contribution of the pedestal is removed, and in the remaining spectrum that part below the threshold cut is taken to be the signal loss. The contributions to the systematic error in this estimate are listed below:
-
The change in signal loss obtained by swapping the width of the pedestal in Cherenkov photon data with that from LED data, is taken as a contribution to the systematic error.
-
In the Cherenkov photon data and LED data, the ranges of the fits to the pedestals are varied and any resultant change in the signal loss is taken as the contribution to the systematic error.
-
- Background estimate:
-
In order to estimate the background level, data from a special run are used where the pressure in the radiator was reduced such that the Cherenkov ring passed through a different set of pixels than in the other runs. In these data, the photoelectron yield is estimated after applying the threshold cut to the spectrum from the pixels which are selected to be off the Cherenkov ring. Assuming a uniform background across the MAPMT, this yield is taken as the background contribution. This procedure is repeated by varying the set of pixels which are selected for this estimate and the resultant change in the background estimate is taken as contribution to the systematic error.
- Estimate of yield:
-
These estimates for the background level and signal loss are repeated for different threshold cuts in the spectra with the results given in Table 7. The photoelectron yields resulting from these estimates are independent of the threshold cuts applied. The systematic error in this measurement is estimated in the same way as for the 61-pixel HPD described in the previous section. Above a threshold cut of 3 , the yield after the corrections is estimated to be 0.48 0.03. The corresponding expectation from simulation is 0.52. The discrepancy between data and simulation is attributed to the uncertainty in the knowledge of the quantum efficiency of the particular MAPMT used in these tests. Using this yield estimate, the figure of merit is estimated to be 155 13 .
| Thre- | Back- | Signal | Number |
| shold in | ground | Loss | of Photo- |
| Number | (%) | electrons | |
| of | per Event | ||
| 2 | 1.87 | 0.4 | 0.43 0.07 |
| 3 | 0.17 | 3.0 | 0.48 0.03 |
| 4 | 0.02 | 6.0 | 0.47 0.03 |
| 5 | 0.01 | 8.5 | 0.47 0.03 |
5 Resolution of the Reconstructed Cherenkov Angle
As described in [2], the reconstruction of the Cherenkov angle requires the coordinates of the hit on the photodetector, the centre of curvature of the mirror and the photon emission point (E) which is assumed to be the middle point of the track in the radiator. The point (M) where the photons are reflected off the mirror, is reconstructed using the fact that it lies in the plane defined by the aforementioned three points. The reconstructed Cherenkov angle is the angle between the beam direction and the line joining E and M.
Figures 13(a),(b) show the Cherenkov angle distribution obtained using air radiator and 100 GeV/c pions for the 2048-pixel HPD and a 61-pixel HPD which were diametrically opposite to each other on the detector plate in configuration 2 with pyrex filter. The 2048-pixel HPD has a better resolution than the 61-pixel HPD since the pixel granularity is 0.2 mm for the former and 2 mm for the latter. Figure 13(c) shows the Cherenkov angle distribution obtained using radiator and 120 GeV/c pions for an MAPMT with 2.3 mm pixel granularity in configuration 1.

5.1 Sources of Uncertainty in the Cherenkov Angle Measurement
-
Chromatic Error: This is due to the variation of refractive index of the radiator with wavelength and is largest in the UV region. Use of pyrex filters reduces this contribution.
-
Emission point uncertainty: This comes from the fact that the mirror is tilted with respect to the beam axis and that the emission point is assumed to be in the middle of the radiator, regardless of the true but unknown point of emission.
-
Pixel size of Photodetector.
-
Measurement of beam trajectory: This contribution comes from the granularity of the pixels in the silicon detectors which are used to measure the direction of the incident beam particle.
-
Alignment: This contribution comes from residual misalignments between the silicon telescope, the mirror and the photodetectors.
In Table 8 the resolutions from each of the above components are tabulated for each of the three photodetectors in typical configurations. In each case, the overall simulated resolution is in good agreement with that measured in the beam triggered data.
| Resolution | 2048- | 61- | MAPMT |
| Component | pixel | pixel | |
| HPD | HPD | ||
| Chromatic | 0.15 | 0.13 | 0.14 |
| Error | |||
| (with Pyrex | |||
| on HPDS) | |||
| Emission | 0.05 | 0.05 | 0.08 |
| Point | |||
| Pixel | 0.02 | 0.13 | 0.17 |
| Size | |||
| Telescope | 0.06 | 0.06 | 0.06 |
| Pixel | |||
| Size | |||
| Alignment | 0.06 | 0.08 | 0.10 |
| Overall MC | 0.17 | 0.21 | 0.26 |
| Overall Data | 0.18 | 0.26 | 0.27 |
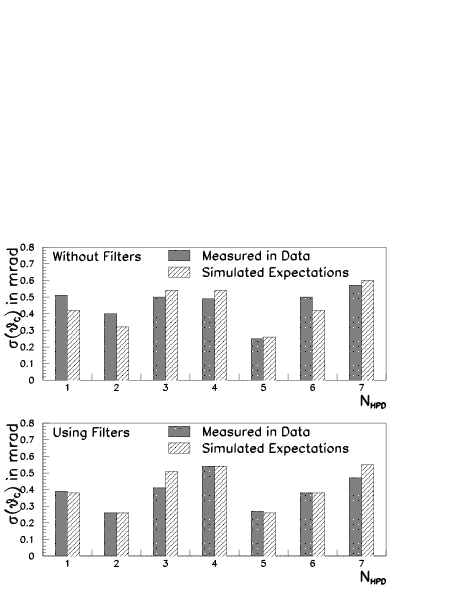
In configuration 1 with seven HPDs it was possible to perform a detailed investigation of the Cherenkov angle resolution. Figure 14(a) shows the resolution measured in data and from simulation for each of the seven 61-pixel HPDs in this configuration. Agreement is seen between data and simulation in all cases. Each HPD in this figure was located at a different azimuth on the detector plate and hence has a different emission point uncertainty. Hence the overall resolution for different HPDs are different. Figure 14(b) shows the same resolutions, for the data using the pyrex filter, which reduces the contribution from chromatic error.
The expectation from the LHCb Technical proposal [1] is to have a resolution of 0.35 mrad which is already achieved for the MAPMT, the 2048-pixel HPD and some of the HPDs shown in Figure 14.
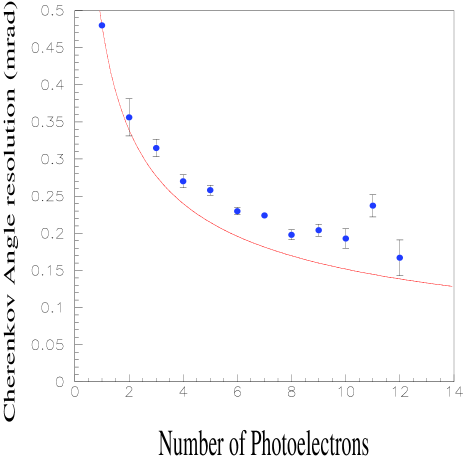
5.2 Multiphoton Resolution
The mean value of the Cherenkov angle from all the photoelectron hits in each event is calculated for the data from the seven 61-pixel HPDs in configuration 1 without pyrex filters. The width of this distribution versus the number of photoelectrons detected per trigger is plotted in Figure 15. For a perfectly aligned system, the width is expected to be inversely proportional to the square root of the number of photoelectrons as indicated by the curve. The disagreement between data and simulation is compatible with the residual misalignment in the system which is of the order of 0.1 mrad.
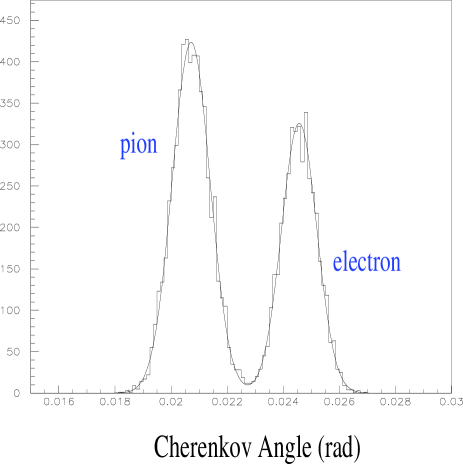
5.3 Particle Identification
Figure 16 shows the Cherenkov angle distribution for the 2048-pixel HPD without pyrex filter in configuration 3 where the beam used was a mixture of pions and electrons at 10.4 GeV/c. Good separation is obtained between the two particle types. Figure 17 shows the plot of the the mean Cherenkov angle calculated from the hits in the 61-pixel HPDs without pyrex filter in configuration 1, where the beam was a mixture of kaons and pions, approximately in the ratio 1:9, at 50 GeV/c. Peaks corresponding to the two charged particle types can be seen in this figure.

6 Summary and Outlook for the Future
The goals set for the RICH2 prototype tests have largely been accomplished. The performance of the radiator and the optical layout of the RICH2 detector have been tested. Photoelectron yields from the prototype HPDs and MAPMTs have been measured and found to agree with simulations. A Cherenkov angle precision of 0.35 mrad as assumed in the LHCb technical proposal [1] has been demonstrated with all three photodetectors.
Improvements in the integrated quantum efficiency of both HPDs and MAPMTs are expected in future devices. The LHCb RICH detector will require photodetectors with higher active to total area than those tested here. HPDs with 80% active area [10] and a lens system for MAPMTs are currently being developed. These will be tested with LHC compatible readout (25 ns shaping time) during 1999-2000.
7 Acknowledgements
This work has benefited greatly from the technical support provided by our colleagues at the institutes participating in this project. In particular the mirror reflectivity and the pyrex transmission were measured by A. Braem. The radiator vessel extensions were manufactured by D. Clark and I. Clark. The printed circuits for the MAPMT were designed and assembled by S. Greenwood. The silicon telescope was provided by E. Chesi and J. Seguniot. We also received valuable advice and assistance from our colleagues in the LHCb collaboration, in particular from R. Forty, O. Ullaland and T. Ypsilantis.
Finally, we gratefully acknowledge the CERN PS division for providing the test beam facilities and the UK Particle Physics and Astronomy Research Council for the financial support.
References
- [1] LHCb Technical Proposal, CERN/LHCC 98-4.
- [2] E. Albrecht , Submitted as an accompanying article to Nucl. Instr. and Meth. A in November, 1999.
- [3] E. Albrecht , Nucl. Instr. and Meth. A411(1998) 249.
- [4] R. Abjean , Nucl. Instr. and Meth A292(1990) 593.
- [5] O. Toker ., Nucl. Instr. and Meth. A340(1994) 572.
- [6] E. Heijne , Nucl. Instr. and Meth 383(1996) 55.
- [7] M. Alemi ., Submitted to Nucl. Instr. and Meth. in July, 1999. Also CERN EP/99-110.
- [8] E. Darlington, J. Phys D8 (1975) 85.
- [9] M. Alemi ., Nucl. Phys. B (Proc. Suppl.) 78 (1999) 360-365.
- [10] E. Albrecht ., Proceedings of the second conference on New Developments in Photodetection,Beaune99, France, June 21-25 1999. Submitted to Nucl. Instr. and Meth.