STATUS OF EXPERIMENTS AND RECENT RESULTS FROM CMD-2 DETECTOR AT VEPP-2M
Abstract
The Cryogenic Magnetic Detector (CMD-2) is shortly described. Preliminary results for the cross sections of annihilation into hadrons and leptons are presented in the c.m. energy range from 0.37 to 1.39 GeV. The total integrated luminosity of about 26 has been collected. The new results for the and meson parameters are reported. The major decay modes of the meson as well as its rare decays have been observed.
1 Introduction
The investigation of the reaction of annihilation into hadrons at low energies accounts about thirty years history of the experimental studies. Nevertheless, the understanding of the field is still rather far from the completeness. More precise measurements of the -, - and -meson parameters are needed as well as properties of the continuum which provide unique information about interaction of light quarks and spectroscopy of their bound states. The knowledge of the total cross section of annihilation into hadrons at low energies and the magnitude of the exclusive cross sections is also necessary for precise calculations of various quantities. One of them is the strong interaction contribution into anomalous magnetic momentum of muon . Tab. 1 shows contributions of various channels into (details of calculations can be found in[1] and[2]). One can see, that the main contribution (about 87%) comes from the energy region below 1.4 GeV and the dominant contribution (71%) in this region is from the channel .
| GeV | GeV | |||
|---|---|---|---|---|
| Mode | % | % | ||
| 502.2 | 71 | 0.78 | 0.1 | |
| 50.96 | 7.2 | 0.67 | 0.1 | |
| 20.62 | 2.9 | 2.21 | 0.7 | |
| 0.76 | 0.1 | 14.22 | 2.0 | |
| 10.78 | 1.5 | 8.54 | 1.2 | |
| 5.16 | 0.7 | 10.22 | 1.5 | |
| 5.09 | 0.7 | |||
| 0.31 | 2.53 | 0.4 | ||
| 0.951 | 0.1 | |||
| 0.815 | 0.1 | |||
| 0.692 | 0.1 | |||
The energy behavior of cross section of the process at low energies is rather complicated. It is characteristic of various resonances (, , and their recurrences) and onsets of the separate hadronic channels. Thus, to determine the value of the total cross section of annihilation into hadrons, one need to measure individual channels one by one and study decay modes of and mesons.
These physical tasks became the goal of the general-purpose detector CMD-2[3] which has been running at the VEPP-2M collider[4] in Novosibirsk since 1992 studying the c.m. energy range from threshold of hadron production to 1.4 GeV.
The CMD-2 detector is described in detail elsewhere[3]. It is a general purpose detector consisting of a drift chamber (DC)[5] with about 250 resolution in the plane transverse to the beam axis and multiwire proportional chamber (ZC)[6] with an accurate measurement (0.5 mm) of the z-coordinate of particle track along the beam direction. Both chambers are inside a thin (0.38 ) superconducting solenoid with a field of 1 T.
The barrel calorimeter placed outside of the solenoid and consists of 892 CsI crystals[7] of size. The crystals are arranged in eight octants. The light readout is performed by PMTs. The energy resolution is about for photons with the energy more than 100 MeV. Both azimuthal and polar angle resolution is about 0.02 radian.
The endcap calorimeter[8] consists of 680 BGO crystals of size. The light readout is performed by vacuum phototriodes placed on the crystals. The energy and angular resolution were found to be and radians respectively. The solid angle covered by both parts of the calorimeter is about 96% of 4.
The muon range system[9] consists of two double layers of the streamer tubes operating in a self-quenching mode and is aimed to separate pions and muons. The inner and outer parts of this system are arranged in 8 modules each and cover 55% and 48% of the solid angle respectively.
2 Measurement of the pion form factor and , meson parameters
A large data sample of about 2
million events was collected by CMD-2
detector in the energy range from 0.360 to 1.370 GeV.
Analysis is completed for 10% of the data only.
The beam energy was measured by the resonance
depolarization technique at almost all energies. The pion form factor
presented in fig.2 is based on the data sample at 53 energy
points in the
energy range from 0.37 to 0.96 MeV. The obtained meson parameters based
on Gounaris-Sakurai parametrization were found to be:
= MeV,
= MeV,
= keV,
=.
Here and below the first errors are statistical and the second are
systematic.
More details about the pion form factor can be found
in[10].
![[Uncaptioned image]](/html/hep-ex/0001049/assets/x1.png)
![[Uncaptioned image]](/html/hep-ex/0001049/assets/x2.png)
The energy range around the meson has been scanned at 13 energy
points with a total integrated luminosity of about 1.5 , but
the detailed analysis was performed for of the data.
The meson
parameters were measured with high accuracy using the decay mode.
The following parameters have been obtained from the fit:
= MeV,
= nb,
= MeV,
= keV.
The common excitation curve for the and meson is presented in
fig.2.
3 Measurements of meson parameters
The -meson parameters were measured using data on the four major decay
modes of , , .
The first
results based on a relatively small integrated luminosity of about 300
were published in[11]. The new more precise
results were
obtained for the channel when
decays into a [12]. The data sample
was collected in four scans of the energy range from 984 to 1040
MeV with the integrated luminosity of 2.37 and contains
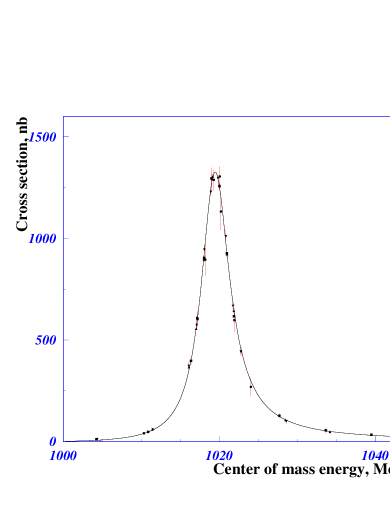
of selected . Fig.3 shows energy dependence of the cross
section of the reaction and
the excitation curve of the meson. The following parameters
have been obtained from the fit:
nb,
MeV, MeV,
=
MeV.
4 Study of decay
![[Uncaptioned image]](/html/hep-ex/0001049/assets/x4.png)
![[Uncaptioned image]](/html/hep-ex/0001049/assets/x5.png)
The radiative magnetic dipole transition of into has been studied with the integrated luminosity of about 1.9 . Events with two charged particles and one recoil photon with the energy more than 250 MeV were selected. The direction of the recoil photon should be close to the opposite direction of two charged pions. The reconstructed invariant mass of all other photons in this system (fig.5) forms a peak near the mass or near zero corresponding to the events of the decay into . The small fraction of the background comes from decays into and was subtracted according to the simulation results. Fig.5 shows the energy behavior of the cross section of the process . Using the branching ratio for the decay from PDG[16], the following value for branching ratio has been determined: .
5 Process
The reaction when decays into
has been studied in the energy range from 0.6 to 1.4 GeV with
the integrated luminosity about 21 . The preliminary
results of measurement of the cross section of the process are
shown in fig.7. The curve in this figure shows the fit of
the energy dependence of the cross section which takes into account
the interference of , and mesons in the
intermediate state. The following branching ratios were obtained from
the fit:
,
,
![[Uncaptioned image]](/html/hep-ex/0001049/assets/x6.png)
![[Uncaptioned image]](/html/hep-ex/0001049/assets/x7.png)
6 Observation of decay
A search of this rare radiative decay was performed with the integrated luminosity of about 14 at 14 energy points around the meson when decays into . The analysis of events has been performed using three different decay modes of : a. , b. and c. .
For the first case (a), there are two charged pions and three photons in the final state. The monochromatic recoil photon has a fixed energy of 60 MeV. The invariant mass of two other (more hard) photons should equal . Fig.7 shows the distribution of the invariant mass of two hard photons versus the softest photon energy . The main source of the background comes from the decay when decay into . In this case the final state has the same particles but their kinematics is drastically different. The hardest photon is monochromatic with the energy 362 MeV and the invariant mass of two others is . The decay is two orders of magnitude more probable. The branching ratio of was calculated relative to . This ratio is not sensitive to systematic uncertainties from luminosity, detector inefficiency, resolution and so on. Using the values of the all needed branching ratios from PDG[16] the following result has been obtained: .
For the second(b) and third(d) decay modes of there are four charged particles and two or three photons in the final state. The softest photon is monochromatic with the energy of 60 MeV. One of the combinations of two particles with opposite charges has to form a missing mass to or zero. The kinematic constrained fit with additional angular cuts was applied to select events with the best . The main source of the background comes from decays: when and . The number of these background events was subtracted according to the simulation results. The following result has been obtained : .
7 Direct observation of decay
While the semileptonic decays of have been well measured, the information on the similar decays of is extremely scarce. PDG evaluates the corresponding decay rate indirectly using the semileptonic decays and assuming the rule: S=Q.

We present results of the direct measurement of the branching ratio for decay using the unique opportunity to study events containing a pure system in the final state produced in the reaction: . The data with the integrated luminosity of 14.8 were used for this analysis. Fig.8 shows the distribution of the selected events over the parameter , where is the particle momentum measured in drift chamber, is the energy deposition in CsI calorimeter and is the an ionization energy loss in the material in front of CsI calorimeter. An enhancement in this distribution around zero corresponds to the electrons from the decay . After background subtraction the corresponding number of the events was found to be: . Using the decay for normalization, the following branching ratio was obtained: = . This result is consistent with the PDG value obtained by recalculation from semileptonic rates. More details on the analysis can be found in[13].
8 Study of the conversion decays
Conversion decays, when a virtual photon is converted into a lepton pair, are closely related to corresponding radiative decays. The branching ratios for conversion decays , as well as Dalitz decay were determined using a data sample with the integrated luminosity of 15.5 .
The decay was detected via the mode and , the decay – via the and the decay – via the mode . The process was used to determine the number of -mesons.
Events were selected with two charged particles in DC and photons in the calorimeter. These events were subject to the kinematic fit with energy-momentum conservation. The conversion decays have a peculiar feature of their kinematics: the angle between and is as a rule close to zero.

The significant background for these events comes from
the -quantum conversion in the detector material.
The detection efficiencies for these processes were determined by simulation.
The decay has background from via the same final state.
This background was suppressed by using the information about
energy deposition by electrons and pions in the calorimeter.
Fig.9 shows the distribution over the invariant mass of
pair of photons for the events of the process .
As a preliminary result the following branching ratios were obtained:
= when
,
= when
,
= ,
= .
The obtained results are in agreement with the theoretical predictions
and have better statistical accuracy than
previous measurements quoted by PDG.
9 Reactions and
![[Uncaptioned image]](/html/hep-ex/0001049/assets/x10.png)
![[Uncaptioned image]](/html/hep-ex/0001049/assets/x11.png)
The reaction of annihilation into four pions (with two
possible channels and ) was studied in the energy range
1.05–1.38 GeV. Simultaneous analysis of both modes allowed to
establish that the final state is dominated by a mixture of
and mechanisms whereas only the latter
contributes to the final state[14].
The reaction was also studied in the energy range 0.6–0.97
GeV[15]. The energy dependence of the cross section in this
range agrees with the assumption of the intermediate
state.
Fig.11 shows the energy behavior of the cross section
of the reaction in the energy range 0.6 to 2 GeV. Also
shown in this figure are the measurements of other groups.
For the first time events were observed at the meson
energy. Under the assumption that all these events come from
meson decay, the following value of the decay width was obtained:
keV
or the branching ratio:
Fig.11 shows the preliminary results of measurement of
the cross section of the process near meson. A
signal of the decay is well seen in this
figure. The following branching ratio was obtained from the fit:
10 Reaction
![[Uncaptioned image]](/html/hep-ex/0001049/assets/x12.png)
![[Uncaptioned image]](/html/hep-ex/0001049/assets/x13.png)
11 Conclusion
New interesting results were obtained with CMD-2 detector on VEPP-2M collider. Among them are the high precision measurement of the cross section of annihilation into hadrons in the energy range from the threshold of hadron production to 1.4 GeV, investigation of exclusive hadron channels as well as decays of , and mesons. Some of these results are outlined in the tab.2. Analysis is in progress to produce final results with a low systematic uncertainty to meet the original goals of CMD-2.
| CMD-2 Data | PDG’98 | |
| , MeV | ||
| , MeV | ||
| , keV | ||
| , MeV | ||
| , MeV | ||
| , keV | ||
| , | ||
| , | ||
| no data | ||
| , MeV | ||
| , MeV | ||
| , | ||
| , | ||
| , | ||
| , | ||
| or | ||
| , | ||
| , | ||
| , | ||
| no data | ||
| no data | ||
This work is supported in part by the grants: RFBR-98-02-17851, RFBR-99-02-17053, RFBR-99-02-17119, INTAS 96-0624.
References
- [1] S.Eidelman and F.Jegerlehner, Z. Phys. C67 (1995) 585.
- [2] D.H.Broun and W.A.Worstell, Phys.Rev., D54 (1996) 3237.
- [3] G.A.Aksenov et al., Preprint BINP 85-118, Novosibiresk, 1985.
- [4] V.V.Anashin et al., Preprint BINP 84-114, Novosibiresk, 1984.
- [5] F.V.Ignatov et al., Preprint BINP 99-64, Novosibirsk, 1999.
- [6] E.V.Anashkin et al., Nucl. Instr. and Meth., A323 (1992) 178.
- [7] V.M.Aulchenko et al., Nucl. Instr. and Meth., A336 (1993) 53.
- [8] D.N.Grigoriev et al., IEEE Trans. Nuc. Sci., 42, N4 (1995) 505.
- [9] G.A.Aksenov et al., Preprint BINP 85-118, Novosibirsk, 1985.
- [10] R.R.Akhmetshin et al., Preprint BINP 99-10, Novosibirsk, 1999.
- [11] R.R.Akhmetshin et al., Phys.Lett., B364 (1995) 199.
- [12] R.R.Akhmetshin et al., Phys.Lett., B466 (1999) 385.
- [13] R.R.Akhmetshin et al., Phys.Lett., B456 (1999) 90.
- [14] R.R.Akhmetshin et al. hep-ex/9904024 (1999).
- [15] R.R.Akhmetshin et al. hep-ex/9912020 (1999).
- [16] Review of Particle Physics, The European Physical Journal, C3 (1998).