Decay
Abstract
The process
has been studied with the SND detector at VEPP-2M
collider in the vicinity of
resonance.
From the analysis of the energy dependence of measured cross section
the branching ratio
and the phase of interference
with the non-resonant production amplitude were obtained.
PACS: 13.25.-k; 13.65.+i; 14.40.-n
Keywords: collisions; Vector meson; Hadronic decay; Detector
1 Introduction
The decay reveals itself as an interference pattern in the energy dependence of the cross section of the process in the region close to peak. The decay was previously studied at VEPP-2M collider [1, 2] and current PDG value [3] is based on these results.
The decay violates both OZI rule and G-parity conservation. The decay amplitude in Vector Dominance Model (VDM) was calculated in [4]. The main contribution into the amplitude of the decay in this work comes from the electromagnetic mixing. The contribution of the transitions through the meson and other intermediate states such as , , etc. is estimated to be of electromagnetic mixing. The value of the branching ratio of the decay calculated from the decay amplitude obtained in the work [4] is almost 2 times higher than current PDG value [3]. Different mixing models were scrutinized in respect to this decay in [5]. The branching ratio calculated in this work is lower than that in [4], but discrepancy between the experimental results, especially [2], and the theoretical prediction [5] still exists. Possible mechanisms, which could decrease the theoretical branching ratio, are discussed in [5]. One of them is the existence of direct decay .
2 Experiment
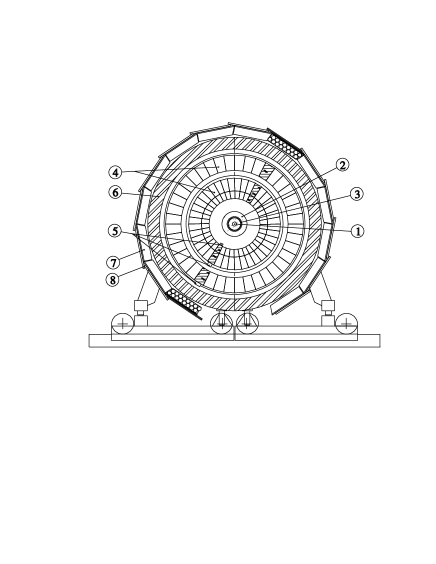
The experiments with SND detector (Fig. 1) at VEPP-2M collider are being conducted since 1995. SND is a general purpose non-magnetic detector [6]. The main part of the SND is a 3-layer spherical electromagnetic calorimeter, consisting of 1632 NaI(Tl) crystals [7]. The solid angle of the calorimeter is of steradian. The angles of charged particles are measured by two cylindrical drift chambers covering 95% of full solid angle. The important part of the detector for the process under study is the outer muon system, consisting of streamer tubes and plastic scintillation counters.
The 1998 experiment was carried out in the energy range =984–1060 MeV in 16 energy points and consisted of 2 data taking runs [8]: PHI_9801, PHI_9802. The total integrated luminosity pb-1 collected in these runs corresponds to produced mesons. The integrated luminosity was measured using events selected in the same acceptance angle as the events of the process under study. The interference term in the cross section due to decay was also taken into account. The systematic error of the luminosity measurement was estimated to be 2%.
3 Event selection
The energy dependence of the cross section of the process
| (1) |
was studied in the vicinity of meson. Events containing two collinear charged particles and no photons were selected for analysis. The following cuts on angles of acollinearity of the charged particles in azimuthal and polar directions were imposed: , . To suppress the beam background the production point of charged particles was required to be within cm from the interaction point in the azimuthal plane and cm along the beam direction (the longitudinal size of the interaction region is about cm). The polar angles of the charged particles were required to be in the range , determined by acceptance angle of the muon system.
The main sources of background are cosmic muons and the following processes:
| (2) | |||
| (3) | |||
| (4) | |||
| (5) |
To suppress the background from the process (2) a procedure of separation was used. It utilizes the difference in the longitudinal energy deposition profiles in the calorimeter for electrons and pions. The separation parameter was calculated for each charged particle in an event:
| (6) |
where — the probability for an electron (pion) with the energy to deposit the energy in the -th calorimeter layer. in our case is equal to the beam energy. The separation parameters distribution for both particles in collinear events with no hits in the muon system, is shown in Fig. 2. This distribution is asymmetric because the particles are ordered according to their energy depositions in the calorimeter. To select the events of the process (1) the cut was imposed. The background from the process (2) was suppressed by a factor of , while only 7% of the events of the process under study were lost. Remaining background from the process was about 1.5%.

The events of the process (3) and cosmic muons can be efficiently suppressed by the muon system. We required no hits in the scintillation counters of the muon system. The efficiency of these counters was estimated using cosmic muons selected by special cuts. Due to possible admixture of beam events which actually produce no hits in the muon counters only the lower boundary of the efficiency was obtained: 99.8%. Thus estimated contribution of cosmic muons does not exceed 0.7% of the total number of events of the process (1) and was neglected.
The energy dependences of the probabilities for muons and pions to produce hits in outer scintillation counters were obtained from the experimental data. With energy increasing from 492 MeV up to 530 MeV these probabilities rise from 84% up to 94% for muons and from 0.5% to 11% for pions. In the final selection of the process (1) the background from the process (3) was about 15%.
To suppress the resonant background from the processes (4) and (5) the following cuts on energy depositions in the calorimeter were applied:
-
1.
the energy deposition in the first calorimeter layer of the most energetic particle in an event is less than 75 MeV;
-
2.
the energy deposition in the third calorimeter layer of the least energetic particle in an event is more than 50 MeV.
In the events of the process (4), which satisfy the geometrical cuts, the energetic photon from decay propagates along the direction of a charged pion producing unusually large energy deposition in the first calorimeter layer for this pion. Such events are suppressed by the first cut. The pions from process (5) are relatively soft with a maximum energy of about 300 MeV and low probability of significant energy deposition in the third calorimeter layer. The second cut is crucial for the rejection of the process (5). The residual cross sections of resonant background processes were estimated by Monte Carlo (MC) simulation: 0.06 nb for the process (4), 0.09 nb for the process (5).
To determine the remaining resonant background more accurately the selected events were divided into two data samples using the parameter : and . The resolution in is about . The main part of the events of the process (1) is contained in the first sample. Due to the emission of hard photons by initial or final particles and errors in the reconstruction of the particle angles some events of the process (1) can migrate into the second sample. The level of the resonant cross section , determined in the second sample, was used to estimate the resonant background in the first sample: . The coefficient was obtained by MC simulation of the processes (4) and (5), its error is determined by accuracy of simulation of energy depositions of pions in the calorimeter. Because the level of the resonant background is low, the error in does not give significant contribution into the errors of the interference parameters. The cut reduces the level of resonant background down to as low as 0.09 nb. This value is less than 1% of the process (1) detection cross section.
The pion polar angle distribution for the process (1) at beam energy higher than 520 MeV is shown in Fig. 3. At this energy the cross sections of the resonant processes (4) and (5) are small. The additional cut on the total energy deposition in the calorimeter MeV rejects the events of the process (3). A good agreement between experimental distribution and the simulation of the process (1) shows that selected pion sample is quite pure and the level of QED background is low.

4 Data analysis
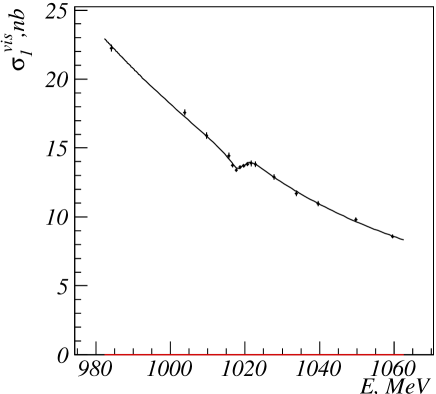
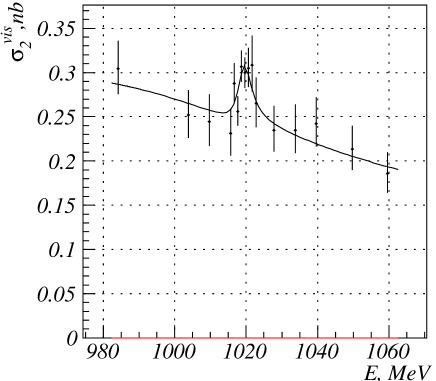
The fitting of the detection cross sections for the first and the second samples were performed simultaneously (Fig. 4, 5). To describe the cross sections the following formulae were used:
| (7) | |||||
| (8) | |||||
where is the CM energy; — the detection cross section of the process (1); — the contribution of the process (3) (this process was studied in our work [9]); — the contribution of the process (2). The ratio 0.39:0.61 between the processes (4) and (5) was taken from the simulation. The coefficients , and were free fit parameters.
The following expression was used for :
| (9) |
where is the fine structure constant; ; , , — -meson mass, width and propagator respectively; — the Born cross section of the process ; — complex parameter characterizing strength of the interference. Two representations of are used in different works: . is the pion form factor without -meson contribution:
| (10) |
with as the pion form factor at the maximum of resonance. , , , and are free fitting parameters. is a factor taking into account detection efficiency and radiative corrections:
| (11) |
is the result of MC integration of differential cross section of the process (1) with all geometrical restrictions [10]. Since the probability for pions to hit the outer scintillation counters depends on energy, it was taken into account during calculation. The remaining contributions into the detection efficiency do not depend on CM energy and pions energies and were included into . The value was obtained using MC simulation and experimental data. It is mainly determined by the cuts on energy depositions. Its independence of the pions energy was checked in the range 430 – 530 MeV using the pions from the process (4) with energies up to 450 MeV and pions from the process (1) at the beam energy 530 MeV. The geometrical cuts and the requirement on no hits in the outer scintillation counters led to 50% efficiency losses, so the total detection efficiency of the process (1) was approximately 12% at .
The was calculated by iteration method. As a first approximation the interference parameters and from [2] were used. The pion form factor was taken from [11] while calculating . After fitting was recalculated with corrected and . This procedure was repeated until convergence was reached.
The branching ratio is related to the interference parameters by the following formula:
| (12) |
where [3].
The fitting has been performed for each experimental run separately. The results are listed in Table 1. The fit parameters for two runs are in statistical agreement, therefore combined fit was performed to obtain the final results also listed in Table 1. The observed level of resonant background 0.07 nb is in a good agreement with the MC estimation of 0.09 nb. The fitted values of the coefficients and from the equation (10) are and .
To check the accuracy of the process (3) background subtraction, the fit to the data with more stringent event selection cuts has been done. The additional requirement that the total energy deposition in the calorimeter is higher than 400 MeV significantly reduced the muon background. The obtained interference parameters:
agrees well with the results from the Table 1.
The additional contribution into the shape of interference pattern may come from the process
| (13) |
The process (13) interferes with the process (1) when soft photon is emitted by pions. This contribution estimated using CMD-2 analysis of the process in the vicinity of resonance [12] does not exceed 1.5% of the interference under study. This value was included into the systematic error.
| Parameter | PHI_9801 | PHI_9802 | Combined |
|---|---|---|---|
The representation is suitable to present the different contributions into the systematic error of the interference parameters:
-
1.
the calculation of the radiative corrections: — 5%, — 3%;
-
2.
the subtraction of the non-resonant background: — 0.8%, — 0.6%;
-
3.
the contribution of the process (13): — 1.5%, — 1.5%;
-
4.
the model dependence on the choice of the function approximating the pion form factor: — 1%, — 8%;
-
5.
the subtraction of the resonant background: — 3%.
The systematic error of is determined by the error of the detection efficiency ( 5%) and the accuracy of luminosity determination (2%).
The final results are the following:
| (14) | |||||
For another representation of we obtained:
5 Discussion
The obtained value of the branching ratio
agrees well with the world average value [3] and has a 3 times higher accuracy. However there is a discrepancy between our result and the preliminary result of CMD-2 experiment [13]:
The measured value agrees with the theoretical predictions [4] while the value is 2.5 times lower than the expected value. The different models of the mixing were examined in the work [5]. The lowest value from this work also contradicts our results. This disagreement could be understood if the direct decay exists or/and in case of nonstandard mixing. One can notice that the measured branching ratio of another rare decay [14], which violates OZI rule and G-parity, disagrees with theoretical predictions.
6 Acknowledgement
This work is supported in part by Russian Fund for basic researches (grant 99-02-16815) and STP ”Integration” (No.274).
References
- [1] I.B.Vasserman et al., Phys. Let. B 99 (1981) 62.
- [2] V.B.Golubev et al., Yad. Fiz., V.44 (1986) 633.
-
[3]
Review of Particles Physics,
Europ. Phys. Jour. C, V.3 (1998). - [4] V.A.Karnakov, Yad. Fiz., V.42 (1985) 1001.
-
[5]
N.N.Achasov, A.A.Kozhevnikov,
Inter. Jour. Mod. Phys. A, V.7, No.20 (1992) 4825. - [6] M.N.Achasov et al., hep-ex/9909015, submitted to NIM, Section A.
- [7] M.N.Achasov et al., hep-ex/9907038.
- [8] M.N.Achasov et al., Preprint Budker INP 98-65 (1998).
- [9] M.N.Achasov et al., Phys. Let. B456 (1999) 303.
- [10] A.B.Arbuzov et al., Radiative corrections for pion and kaon production at e+ e- colliders of energies below 2-GeV, hep-ph/9703456, JHEP 9710 (1997) 006.
- [11] L.M.Barkov et al., Nucl. Phys. B 256 (1985) 365.
- [12] R.R. Akhmetshin et al., Phys.Lett.B 462 (1999) 371.
- [13] R.R.Akhmetshin et al., Preprint Budker INP 99-11 (1999).
- [14] M.N.Achasov et al., Phys. Let. B449 (1999) 122.