Titania-doped tantala/silica coatings for gravitational-wave detection
Abstract
Reducing thermal noise from optical coatings is crucial to reaching the required sensitivity in next generation interferometric gravitational-waves detectors. Here we show that adding TiO2 to Ta2O5 in Ta2O5/SiO2 coatings reduces the internal friction and in addition present data confirming it reduces thermal noise. We also show that TiO2-doped Ta2O5/SiO2 coatings are close to satisfying the optical absorption requirements of second generation gravitational-wave detectors.
pacs:
04.80.Nn,62.40.+i, 95.55.YmI Introduction
Interferometric gravitational-wave detectors are now operating in the United StatesS1Instrument , EuropeS1Instrument ; virgo , and Japantama . Second generation detectorsadvLIGO are being designed which will have the sensitivity to make likely an actual detection of a gravitational waveThorne_Cutler . This will require reducing all noise sources, but especially the thermal noise which is predicted to be the limiting noise in the most sensitive band around 100 Hz. Much of this thermal noise will come from the optical coatings of the interferometer mirrorssyracuse . Coatings with improved thermal noise performance will allow for greater sensitivity to gravitational waves and improved astrophysical performance. Coating thermal noise is also the limiting noise source for laser frequency stabilization Jordan , making this research effort important for other precision experiments.
Thermal noise is caused by mechanical loss in the system in accordance with the Fluctuation-Dissipation TheoremCallen . Directly applying this theorem to the case of a Gaussian-profile laser sensing the position of a coated mirror yieldsYuri
| (1) |
for the thermal noise. Here is the power spectral density of position noise, is Boltzmann’s constant, is the temperature, is the Poisson ratio of the substrate material, is the half-width of the Gaussian laser beam, and is the effective loss angle of the mirror. The loss angle can be written asOttawa
where is the coating thickness, , , and are the Young’s moduli, Poisson’s ratios, and loss angles of the substrate (no subscript), and for the coating for stresses perpendicular (⟂) and parallel (||) to the optic face.
In addition to low thermal noise, the coatings must also satisfy strict thermal and optical requirements. The Fabry-Perot cavities that make up the arms of these detectors must have high finesse, limiting the acceptable transmission and scatter to a few parts per million (ppm). In addition, the transmission must be matched between mirrors to better than 1 percent so that the two arms will have nearly equal finesse. The absorption has a stricter requirement, better than 0.5 ppm, due to thermal lensing considerationsRyan . Thermal considerations also dictate that the absorption be as uniform as possible across the face of the optic.
II Background
Study of multilayer dielectric optical coatings is an ongoing research project in the gravitational-wave detection communitysyracuse ; Ottawa ; Yamamoto1 ; Yamamoto2 ; Beauville ; Crooks ; Penn ; Crooks2 ; tni ; Fejer ; Braginsky03 . The coating used in initial interferometers, alternating layers of SiO2 and Ta2O5, was studied to determine if the mechanical loss was enough to cause thermal noise problemssyracuse ; Crooks . The particular coatings measured were coated by Research-Electro Optics (REO) of Boulder CO, USA. When it was determined that the loss was enough to cause limiting noise in next generation gravitational-wave detectors, research was carried out to determine the source of the mechanical loss in SiO2/Ta2O5 coatingsPenn . This was done in collaboration with LMA/Virgo of Lyon, France, who coated the samples. This established that the loss came from internal friction in the coating materials rather than any interface effects between layers or between the substrate and the coating. It was also found that the Ta2O5, rather than the SiO2, was the dominant contributor to the coating mechanical loss. The loss angles of the SiO2 and the Ta2O5 were found to beCrooks2
| (3) |
| (4) |
as a function of frequency .
The thermal noise from optical coatings has also been directly observed in two small scale interferometers, one at Caltechtni and one in JapanNumata . The Caltech measurement was on an REO coating and found thermal noise at a few kiloHertz to be consistent with
| (5) |
where is from Eq. I. The values determined from the modal Q measurements in Eqs. 3 and 4 predict
| (6) |
Optical absorption was also measured for Ta2O5/SiO2 coatings. Coatings from REO and LMA/Virgo gave similar resultsCimma ,
| (7) | |||||
| (8) |
III Measurement
The next stage of coating research has been to improve the mechanical loss without significantly degrading the optical absorption. Adding TiO2 as a dopant to the Ta2O5 was tried because it has a high Young’s modulus, its atomic size allows for dense packing in the Ta and O matrix, and the melting point of TiO2/Ta2O5 alloy is relatively high, indicating a stable amorphous structure.
Silica substrates were coated with the TiO2-doped Ta2O5/SiO2 coating using ion beam deposition. Details of the coating process can be found in a recent paper jmm . There were two different coating chambers used to make the samples studied, one large and one small. The primary difference between the chambers is that the ion source in the small chamber is a Kaufman source with tungsten filaments, whereas in the large chamber it is two Radio Frequency ion sources. In the small chamber, the tungsten filament heats the target as well as the substrate. After coating, each sample was annealed at 600 degrees C. X-ray examination showed that no large crystals had formed in the coating after annealing.
Each coating consisted of 30 (at 1.064 m) layers alternating between the two materials, TiO2-doped Ta2O5 and SiO2. The total thickness was measured two ways, using reflectivity measurements and with an electron microscope. The methods agreed with each other within 5%, for an average coating thickness of m. One sample was different, a single layer of TiO2-doped Ta2O5 4.7 m thick.
The concentration of TiO2 in Ta2O5 for each coating was measured two different ways. First, an estimate was made by comparing the index of refraction of the TiO2-doped Ta2O5 with pure Ta2O5 and pure TiO2. A linear relationship was assumed between TiO2 concentration and index so the TiO2 concentration was obtained by interpolation. This is only valid when done between coatings from the same chamber, large or small. A more detailed measurement was made on some samples using electron energy loss spectroscopy, which is described in the Appendix. The two methods agreed fairly well when the same coating was studied by both, as seen in Table 1.
| Coating | [TiO2] - Index | [TiO2] - EELS |
|---|---|---|
| 0 | 0% | - |
| 1 | % | |
| 2 | % | - |
| 3 | % | |
| 4∗ | % | |
| 5∗ | % | - |
| 6∗∗ | % | - |
| ∗ Coated in large coating chamber | ||
| ∗∗ Single layer of TiO2-doped Ta2O5 | ||
III.1 Mechanical loss
Coated silica disks were used to determine the mechanical loss in the coating. All disks were 7.6 cm in diameter, with some 2.5 cm thick and some 0.25 cm thick. The thicker disks were suspended in a wire sling, and had normal mode Q’s measured with an interferometric readout. The thinner disks were suspended with a welded silica suspension and had modal Q’s measured using a birefringence readout. Details of the suspension and readout systems for both types of disks can be found in a recent publicationPenn .
Modal Q’s were measured on multiple modes of both thin and thick samples for all coated samples. The results are shown in Table 2. The values for the coating loss angles are calculated from the modal Q’s from
| (9) |
where is the modal Q, measured for the disk both coated and uncoated, is the thickness of the coating, and is the ratio of energy stored in the coating per unit coating thickness to the total energy for each given mode shape. These values of were calculated using a finite element modelCrooks , using Young’s moduli Pa and Pa, and are shown in Table 3. To determine the coating loss coming from internal friction, the loss predicted from coating thermoelastic dampingFejer ; Braginsky03 was subtracted from the calculated in Eq. 9.
| Coating | Thickness | Frequency | Modal Q | Loss angle |
| 0 | Thin | 2733 | 5.4 | 2.5 |
| 2735 | 5.3 | 2.5 | ||
| 4130 | 4.3 | 2.8 | ||
| Thick | 20180 | 4.8 | 2.2 | |
| 20183 | 3.6 | 3.2 | ||
| 28383 | 3.0 | 3.3 | ||
| 28387 | 3.3 | 2.9 | ||
| 47349 | 5.6 | 3.7 | ||
| 47363 | 6.3 | 2.9 | ||
| 73454 | 3.0 | 4.0 | ||
| 73458 | 3.8 | 2.7 | ||
| 1 | Thin | 2653 | 7.6 | 1.8 |
| 2666 | 2.0 | 7.1 | ||
| 4026 | 3.6 | 3.6 | ||
| 6045 | 7.4 | 1.9 | ||
| 6078 | 7.6 | 1.8 | ||
| Thick | 20191 | 4.9 | 2.2 | |
| 28428 | 3.5 | 2.6 | ||
| 47423 | 5.4 | 4.1 | ||
| 73515 | 3.4 | 3.4 | ||
| 2 | Thin | 2706 | 8.9 | 1.5 |
| 2711 | 8.8 | 1.5 | ||
| 4101 | 6.8 | 1.7 | ||
| 6165 | 8.4 | 1.6 | ||
| 6184 | 8.6 | 1.6 | ||
| 9464 | 6.3 | 2.0 | ||
| 9465 | 6.1 | 2.0 | ||
| Thick | 20239 | 6.7 | 1.9 | |
| 28488 | 5.4 | 1.8 | ||
| 47466 | 10.0 | 2.5 | ||
| 73599 | 5.2 | 2.5 | ||
| 3 | Thin | 2722 | 9.3 | 1.5 |
| 4111 | 6.4 | 1.9 | ||
| 6197 | 9.1 | 1.5 | ||
| 9517 | 6.4 | 2.0 | ||
| 9519 | 6.6 | 1.9 | ||
| Thick | 20245 | 7.0 | 1.7 | |
| 28500 | 6.3 | 1.4 | ||
| 47485 | 11.3 | 2.0 | ||
| 73620 | 7.0 | 1.5 | ||
| 4∗ | Thin | 2723 | 9.2 | 1.5 |
| 2724 | 9.7 | 1.4 | ||
| 4114 | 6.0 | 2.0 | ||
| 6200 | 8.1 | 1.7 | ||
| 9524 | 6.1 | 2.1 | ||
| Thick | 20241 | 5.4 | 2.5 | |
| 28493 | 4.1 | 2.7 | ||
| 47467 | 6.1 | 5.3 | ||
| 73598 | 5.0 | 2.7 | ||
| 5∗ | Thick | 20193 | 6.5 | 2.0 |
| 28400 | 5.4 | 1.8 | ||
| 47398 | 10.9 | 2.2 | ||
| 73524 | 6.2 | 1.9 | ||
| 6∗∗ | Thick | 20226 | 2.9 | 2.6 |
| 28462 | 1.9 | 3.7 | ||
| 47430 | 3.6 | 4.4 | ||
| 73588 | 2.4 | 3.3 | ||
| ∗Coated in large coating chamber | ||||
| ∗∗Single layer of TiO2-doped Ta2O5 | ||||
| Thickness | Approximate modal frequency (Hz) | d (1/m) |
|---|---|---|
| Thin | 2700 | 1584 |
| 4100 | 1659 | |
| 6200 | 1581 | |
| 9500 | 1624 | |
| Thick | 20200 | 142.4 |
| 28500 | 153.2 | |
| 47400 | 52.33 | |
| 73500 | 109.1 |
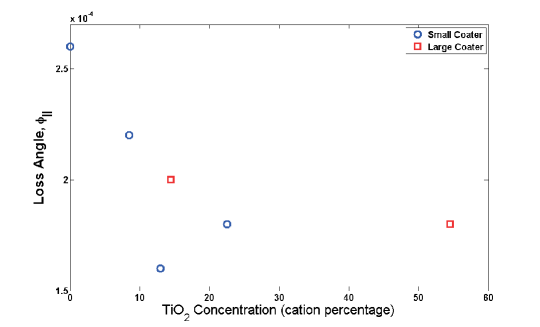
The coating loss for each concentration of TiO2, calculated mode by mode for all samples measured, was fit to a frequency dependant model, following a recent paperCrooks2 . The results are shown in Table 4. The results of extrapolating these formulas to 100 Hz, where interferometers will be limited by coating thermal noise, are shown in Fig. 1.
III.2 Thermal noise
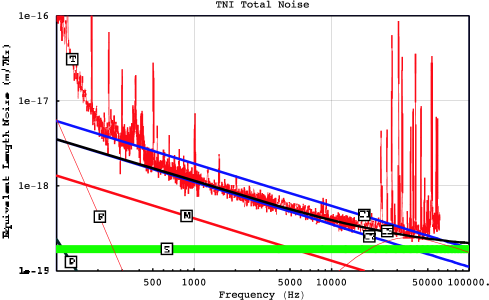
A direct, interferometric broadband measurement was made of the thermal noise of the TiO2-doped Ta2O5/SiO2 coatings using the small scale interferometer at Caltech. The measurement apparatus and the results for undoped coatings are described elsewhere tni . Figure 2 shows the result for coated mirrors done in a separate coating run, but using the same coating formula as coating 2 in Table 2 except that these mirrors were coated in LMA/Virgo’s large coating chamber, while the samples used for the Q measurements were done in the small chamber. The value for the loss angle obtained by this direct measurement and fit is
| (10) |
where is from Eq. I. The clear reduction in thermal noise is shown graphically in Fig. 2 and quantitatively between Eqs. 5 and 10. The result in Eq. 10 is to be compared with the value predicted from the modal Q results in Table 4,
| (11) |
assuming . The reason for the discrepancy between Eqs. 10 and 11 is not known.
| Coating | |
|---|---|
| 0 | |
| 1 | |
| 2 | |
| 3 | |
| 4∗ | |
| 5∗ | |
| 6∗∗ | |
| ∗Coated in large coating chamber | |
| ∗∗Single layer of TiO2-doped Ta2O5 | |
III.3 Optical absorption
Optical absorption was measured using photothermal, common-path interferometry (PCI), which is a modified thermal lensing technique that exploits the thermo-optic effect (index of refraction dependence on temperature: d). It differs from standard far-field thermal lensing by utilizing a near-field detection scheme which approaches in sensitivity that of interferometric absorption measurement methods. Phase distortions, , of the probe beam due to heating by an intersecting pump beam in a skewed cylindrical region (approximately 75 m diameter by x 500 m long) are transformed into perturbations of the probe beam intensity, , that are easily detectable using a lock-in detection technique which gives both amplitude and phase. For materials with d around K and with pump powers of 1 W, resolutions of ppm in terms of the absorbed fraction of pump power are readily achievable. The signal phase can be used to discriminate between probe light scattered from surface imperfections compared to that diffracted by the thermal wave emanating from the heated surface.
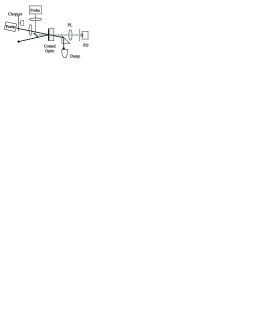
The PCI technique used here utilizes a chopped pump beam at 1064 nm which is crossed with a wider 632.8 nm probe beam inside the sample, see Fig. 3. In the case of high reflectivity (HR) coatings, virtually all the pump beam is reflected. As long as substrate losses are negligible as is the case with fused silica, the heat deposited in the coating due to optical absorption of the pump wavelength is the only source that heats the underlying substrate (by thermal conduction). In order for the probe beam to sense the change in the local optical index via the resulting phase distortions, it is necessary that the multi-layer dielectric HR coatings be transparent to the probe beam, as are the coatings studied here. Results of optical absorption measurements as well as index of refraction results are shown in Table 5.
| Coating | Index | Absorption (ppm) |
|---|---|---|
| 0 | ||
| 1 | ||
| 2 | ||
| 3 | ||
| 4∗ | ||
| 5∗ | ||
| 6∗∗ | ||
| ∗ Coated in large coating chamber | ||
| ∗∗ Single layer of TiO2-doped Ta2O5 | ||
In these experiments, a commercial neutral density (ND) filter consisting of a partially transparent metallic film on a low-loss fused silica substrate is used as a coating optical absorption standard. In the PCI technique, the detected signal amplitude is linear with respect to pump beam intensity and, therefore, straightforward linear scaling can be used to relate the signal levels from unknowns to those of the easily measured ND filters. With both coated standards and unknowns, the coated surfaces are positioned near the center of the sampling volume where maximum signal is achieved. With 10 W of pump power, resolutions of ppm are achievable.
IV Conclusion
The mechanical loss results in Table 4 and Fig. 1 show that adding TiO2 to the Ta2O5 reduces the mechanical loss. Differing concentrations of TiO2 do not effect the loss nearly as much as simply the presence or absence of TiO2. This reduction of nearly half in the loss angle of the coating corresponds to a significant improvement in thermal noise, which translates into greater astronomical reach for advanced interferometers. The optical absorption seen in Table 5 would be problematic in an advanced interferometer, but slight improvements in coating technique may be able to bring these numbers down to acceptable levels. The addition of TiO2 does appear to increase the optical absorption slightly, so using minimal concentrations will be useful. Changes in annealing cycles are known to effect optical absorption, as does levels of contamination, so both of these variables could potentially be improved as well. Further measurements on the inhomogeneity of the optical loss, the scatter, and the reproducibility of all properties will be necessary before a TiO2-doped Ta2O5/SiO2 could be accepted for use in an actual gravitational-wave interferometer.
Acknowledgements
The LIGO Observatories were constructed by the California Institute of Technology and Massachusetts Institute of Technology with funding from the National Science Foundation under cooperative agreement PHY-9210038. The LIGO Laboratory operates under cooperative agreement PHY-0107417. We thank for Zhigang Pan and Slawomir Gras for checking the thermal noise formulas. We also gratefully acknowledge funding from NSF grant PHY-0355118(HWS). This paper has been assigned LIGO Document Number LIGO-P050048-00-R.
Appendix: Measurement of the composition of the Ta2O5-TiO2 layers
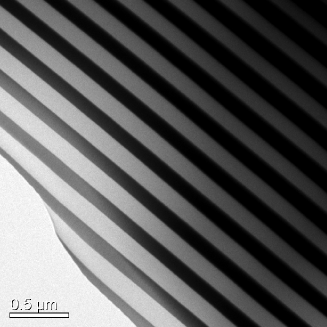
The measurement of Ti dopant concentration was performed using electron energy loss spectroscopy (EELS) eels on a FEI Tecnai T20 transmission electron microscope operated at 200 kV equipped with a Gatan Image Filter (GIF). A bright field TEM image of a coating is shown in Fig. 4. The edges used for quantification were the O-K edge at 532 eV, the Ti-L2,3 pair starting at 456 eV, and the Ta-N4,5 edge at 229 eV. The O-K and Ti-L edges arise from fairly simple atomic shells and Hartree-Slater calculations of the partial cross sections are readily available and reliable. In contrast to this, N-shells are rather more complex and no analytical representation of this partial cross section was available. This problem was circumvented by determining the partial cross section experimentally from 20 spectra from the Ta2O5 layers in the undoped coating 0, assuming that the Ta:O ratio was the stoichiometric 2:5. This was then used with the calculated Ti partial cross section to quantify spectra recorded for the three coating samples 1, 3 and 4.
Quantification of the doped Ta2O5 layers in coating 1 was carried out using 20 spectra collected from different thin regions ( nm) and gave a result of cation percentage of Ti (with the balance Ta). Only 4 spectra could be collected from coating 3 due to much of the sample being too thick for accurate EELS analysis, quantification yielded a result of cation percentage of Ti. For coating 4, 20 spectra were recorded, but more difficulties were encountered with the analysis. Accurate quantification relies on correct subtraction of the background under the edge, but this can become difficult when the edge is only a small feature above the background. The Ta edge is fairly weak and has a delayed onset and background subtraction was a problem in coating 4. Different background models were tried, some which subtracted too much, and others which subtracted too little. The best-fit background model led to a consistent quantification of the 20 spectra to give cation percentage of Ti, although it is believed that too much background was removed here. An alternative background model which did not remove enough led to quantifications in the low 40’s (cation percentage of Ti). It seems likely that the real figure is about 5 cation percentage lower than the above quoted figure and is of the order of 50 cation percentage Ti.
References
- (1) B. Abbott et al., “Detector Description and Performance for the First Coincidence Observations Between LIGO and GEO”, Nuclear Inst. and Methods in Physics Research A, 517/1-3, 154-179, (2004).
- (2) F. Acernese et al.,“Status of VIRGO”, Class. Quantum Grav., 19, 1421, (2002).
- (3) M. Ando and the TAMA collaboration, “Current status of TAMA”, Class. Quantum Grav., 19, 1409, (2002).
- (4) P. Fritschel, Second generation instruments for the laser interferometer gravitational wave observatory,” in Gravitational-Wave Detection, M. Cruise and P. Saulson, Proc. SPIE 4856, pp. 282 291, (2003).
- (5) K. S. Thorne and C. Cutler, “An Overview of Gravitational Wave Sources”, in Proceedings of 16th International Conference on General Relativity and Gravitation, N. T. Bishop and S. D. Maharaj,(World Scientific, Singapore, 2002), pp. 72-112.
- (6) G. M. Harry, A. M. Gretarsson, P. R. Saulson, S. E. Kittelberger, S. D. Penn, W. J. Startin, S. Rowan, M. M. Fejer, D. R. M. Crooks, G. Cagnoli, J. Hough, and N. Nakagawa, “Thermal noise in interferometric gravitational wave detectors due to dielectric optical coatings”, Class. Quantum Grav., 19, 897-917, (2002).
- (7) K. Numata, A. Kemery, and J. Camp, Phys. Rev. Lett. 93, 250602 (2004).
- (8) H. B. Callen and R. F. Greene, “On a theorem of irreversible thermodynamics”, Phys. Rev., 86, 702-710, (1952).
- (9) Yu. Levin, “Internal thermal noise in the LIGO test masses: A direct approach”, Phys. Rev. D 57, 659-663 (1998).
- (10) R. Lawrence, D. Ottaway, P. Fritschel, and M. Zucker, “Active correction of beam heating induced phase distortions in optics via external radiative thermal acutation”, Optics Letters, 29, 2635-2637, (2004).
- (11) G. M. Harry , H. Armandula, E. Black, D. R. M. Crooks, G. Cagnoli, M. M. Fejer, J. Hough, S. D. Penn, S. Rowan, R. Route, P. H. Sneddon, “Photonic Applications in Astronomy, Biomedicine, Imaging, Materials Processing, and Education”, Proceedings of SPIE: 5578 (SPIE, Bellingham, WA, 2004).
- (12) K. Yamamoto, S. Miyoki, T. Uchiyama T, H. Ishitsuka, M. Ohashi, K. Kuroda, T. Tomaru, N. Sato, T. Suzuki, T. Haruyama, A. Yamamoto, T. Shintomi, K. Numata, K. Waseda, K. Ito, K. Watanabe, “Mechanical loss of the reflective coating and fluorite at low temperature”, Class. Quantum Grav., 21-5, S1075-S1081, (2004).
- (13) K. Yamamoto, M. Ando, K. Kawabe, K. Tsubono, “Thermal noise caused by an inhomogeneous loss in the mirrors used in the gravitational wave detector ”, Phys. Lett. A 305, 18-25, (2002).
- (14) F. Beauville for The VIRGO Collaboration, ”The VIRGO large mirrors: a challenge for low loss coatings”, Class. Quantum Grav., 21, S935-S945, (2004).
- (15) D. R. M. Crooks, P. Sneddon, G. Cagnoli, J. Hough, S. Rowan, M. M. Fejer, E. Gustafson, R. Route, N. Nakagawa, D. Coyne, G. M. Harry, and A. M. Gretarsson, “Excess mechanical loss associated with dielectric mirror coatings on test masses in interferometric gravitational wave detectors”, Class. Quantum Grav., 19-5, 883-896, (2002).
- (16) S. D. Penn, P. H. Sneddon, H. Armandula, J. C. Betzweiser, G. Cagnoli, J. Camp, D. R. M. Crooks, M. M. Fejer, A. M. Gretarsson, G. M. Harry, J. Hough, S. E. Kittelberger, M. J. Mortonson, R. Route, S. Rowan, and C. C. Vassiliou, “Mechanical Loss in Tantala/Silica Dielectric Mirror Coatings”, Class. Quantum Grav., 20, 2917-2928, (2003).
- (17) D. R. M. Crooks, G. Cagnoli, M. M. Fejer, G. M. Harry, J. Hough, B. T. Khuri-Yakub, S. Penn, R. Route, S. Rowan, P. H. Sneddon, I. O. Wygant, and G. G. Yaralioglu, “Experimental measurements of mechanical dissipation associated with dielectric coatings formed using SiO2, Ta2O5, and Al2O3”, Class. Quantum Grav., 23, 4953-4965, (2006).
- (18) E. D. Black, A. Villar, K. Barbary, A. Bushmaker, J. Heefner, S. Kawamura, F. Kawazoe, L. Matone, S. Meidt, S. R. Rao, K. Schulz, M. Zhang, and K. G. Libbrecht, “Direct observation of broadband coating thermal noise in a suspended interferometer”, Phys. Lett. A 328, 1-5, (2004).
- (19) M. M. Fejer, S. Rowan, G. Cagnoli, D. R. M. Crooks, A. Gretarsson, G. M. Harry, J. Hough, S. D. Penn, P. H. Sneddon, and S. P. Vyatchanin, “Thermoelastic dissipation in inhomogeneous media: loss measurements and displacement noise in coated test masses for interferometric gravitational wave detectors”,70, 082003, (2004).
- (20) V. B. Braginsky, S. P. Vyatchanin, “Thermodynamical fluctuations in optical mirror coatings”, Phys. Lett. A, 312/3-4, 224-255, (2003).
- (21) K. Numata, M. Ando, K. Yamamoto, S. Otsuka, and K. Tsubono, “Wide-band direct measurement of thermal fluctuations in an interferometer”, Phys. Rev. Lett., 91, 260602, (2003).
- (22) B. Cimma, D. Forest, P. Ganau, B. Lagrange, J. M. Mackowski, C. Michel, J. L. Montorio, N. Morgado, R. Pignard, L. Pinard, A. Remillieux, “Original optical metrologies of large componants”, Proceedings of SPIE: 5252 (SPIE, Bellingham, WA, 2004).
- (23) J. M. Mackowski, N. Morgado, L. Pinard, A. Remillieux, “Low loss coatings for the Virgo large mirrors”, Proceedings of SPIE: 5250 (SPIE, Bellingham, WA, 2004).
- (24) R.F. Egerton, Electron Energy-Loss Spectroscopy in the Electron Microscope, second edition (Plenum Press, New York, 1996).