Achieving geodetic motion for LISA test masses: ground testing results
Abstract
The low-frequency resolution of space-based gravitational wave observatories such as LISA (Laser Interferometry Space Antenna) hinges on the orbital purity of a free-falling reference test mass inside a satellite shield. We present here a torsion pendulum study of the forces that will disturb an orbiting test mass inside a LISA capacitive position sensor. The pendulum, with a measured torque noise floor below 10 fN m from 0.6 to 10 mHz, has allowed placement of an upper limit on sensor force noise contributions, measurement of the sensor electrostatic stiffness at the 5% level, and detection and compensation of stray dc electrostatic biases at the millivolt level.
pacs:
04.80.Nn,07.87.+vAmong the most challenging technologies needed for the LISA gravitational wave mission is that of placing test masses in pure free fall. Accelerations due to stray forces change the distance between orbiting test masses, directly contaminating an interferometric measurement of gravitational wave strain. The LISA sensitivity goal requires acceleration noise, , with spectral density below at frequencies down to 0.1 mHz, or force noise of order fN for a 1 kg test mass big .
Environmental force noise can be screened by a satellite shield employing precision thrusters and a relative position sensor to remain centered about the free-falling test mass. The satellite, however, creates disturbances, particularly due to the close proximity of the position sensor. While noise analyses have shown proposed electrostatic sensor designsDolesi et al. (2003); Schumaker (2003), with 2-4 mm test mass - sensor separations, to be compatible with the LISA goals, the low frequencies and extreme force isolation goals require force disturbance measurements to provide confidence in the LISA sensitivity predictions.
An ideal test of stray forces for LISA compares the differential noise in the orbits of two nearby free-falling test masses. This test will be performed, with a target acceleration noise limit of 30 fm/s2 at 1 mHz, by the LISA Test-Flight Package (LTP) Bortoluzzi et al. (2003) and Disturbance Reduction System (DRS) Hanson et al. (2003). In preparing for such flight tests, we study the forces acting on a test mass that is nearly “free” in a single rotational degree of freedom, suspended by a thin torsion fiber inside a capacitive position sensor. The thermal torque noise limit, approached in similar apparatuses Smith et al. (1999), is several fN m at 1 mHz for the torsion pendulum used hereHueller et al. (2002). Dividing by half the 40 mm test mass width, this converts to a force noise near 100 fN, within a factor 100 (10) of the LISA (LTP/DRS) force noise target.
The translational acceleration noise relevant to LISA can be divided into contributions from random forces acting on the test mass (mass ) and from coupling to the relative motion of the satellite (mass ) via any dc force gradient (or “stiffness” ) . The spacecraft motion noise arises in the position sensing noise, , and in the imperfect compensation of the external forces acting on the satellite by the finite gain control loop (gain ). The residual acceleration noise is
| (1) |
To characterize , we use the torques, measured from the pendulum twist , acting on a LISA-like test mass inside a realistic capacitive position sensor designed for LISA’s sensing noise (spectral density nm) and electrostatic force gradient ( nN/m) requirements. The measured pendulum angular noise in the LISA measurement band establishes an upper limit on the contribution of noisy surface forces to . Measurement of the rotational stiffness due to the AC sensing voltage characterizes a key part of the translational stiffness . Finally, measurement and compensation of the sensor rotational electrostatic bias imbalance quantify and demonstrate neutralization of a potentially important contribution of stray dc electric fields to .
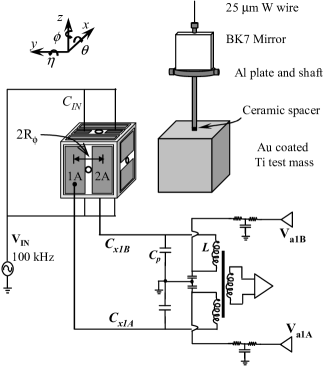
The capacitive position sensor tested here (sketched in Fig. 1 and discussed in Refs. Cavalleri et al. (2001); Weber et al. (2002a)) is a variation of that projected for LTPWeber et al. (2002b); Dolesi et al. (2003). With the 40 mm test mass centered, the gap between all electrodes and the mass is 2 mm. The electrodes are gold coated Mo, and are separated from the electrically grounded Mo housing by ceramic spacers. Differential gap sensing measurements from six sensing electrode pairs are combined to yield the three translational and three rotational test mass displacements. The sensor noise floor is dominated by transformer thermal noise, with and . Integrated actuation circuitry can apply voltages to the sensing electrodes, used here for occasional pendulum control in and for electrostatic characterization of the sensor. All electrode surfaces have a dc path to a single circuit ground.
The main pendulum component is the test mass itself, a hollow gold coated Ti cube nominally 40 mm on a side, with 2 mm walls. The test mass hangs inside the sensor, connected to the torsion fiber by an Al shaft passing through a hole on the top face of the sensor. The shaft supports an Al stopper plate, which limits the pendulum torsional range, and a silvered glass mirror, which allows an independent autocollimator readout of the pendulum torsional () and swing () angles. The shaft assembly is grounded through the torsion fiber and isolated from the test mass by a ceramic spacer. The total pendulum mass is 101.4 g (the test mass weighs 80.6 g), and has a calculated moment of inertia g cm2.
The torsion fiber is a nominally 25 m W wire of length 1 m. It hangs from an upper pendulum stage with an eddy current magnetic damper, which damps the pendulum swing mode with a 200 s decay time. The pendulum and sensor are mounted on independent micropositioners, allowing six degree of freedom adjustment of the relative position of test mass inside the electrode housing. The apparatus vacuum chamber is evacuated below 10-5 mBar and sits in a thermally controlled room with 50 mK long term stability.
With the sensor excitation on, the free torsional oscillation period is 515.1 seconds, with a quality factor 1700. The period falls to 510.3 seconds with the sensor bias off (the period change is due to a negative torsional sensor stiffness, to be discussed shortly). These pendulum dynamics, combined with the calculated moment of inertia, allow conversion of measured angular deflections in into torques, using the transfer function
| (2) |
where and we assume a frequency independent pendulum loss angle .
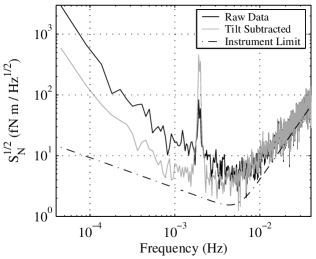
Figure 2 shows typical torque noise data, calculated from the pendulum angular noise using Eqn. 2. Also shown is the instrument limit given by the quadrature sum of the pendulum thermal noise, , and the sensor readout noise, , converted into torque noise, which dominates above 5 mHz. Near 1 mHz, the raw torque noise is roughly 10 times the thermal limit. We found the main excess noise source to be a coupling to translational motion between the sensor and pendulum, due to laboratory tilt noise. This coupling, with magnitude of order 10-7 Nm/m, is considerably stronger than reported torsion fiber “tilt - twist” couplingsSmith et al. (1999) and is likely related to an electrostatic interaction involving the dielectric mirror edges. To better characterize the sensor contribution to , in the absence of this coupling to lab motion, we calculate the instantaneous coupling torque and subtract the resultant twist from the time series. The tilt, measured in the and sensor readouts, is converted to torque through the measured “tilt-twist” coupling coefficients and then to angular twist through the pendulum transfer function (Eqn. 2). The remaining torque noise is roughly twice the pendulum thermal noise at millihertz frequencies and below 10 fN m from 0.6 to 10 mHz. The excess low frequency noise is highly correlated with the temperature fluctuations, but, to avoid subtracting a possible sensor-related temperature effect, no further correction has been made.
The low noise pendulum allows precise measurement of coherently modulated torque disturbances; we present here two such measurements. The first concerns the electrostatic stiffnessCavalleri et al. (2001); Weber et al. (2002a, b) associated with the 100 kHz sensor excitation voltage. In the approximation that all electrode surfaces are grounded, directly or by the readout circuitry, the test mass feels a negative electrostatic spring proportional to the square of the bias amplitude, in rotation as well as translation. Considering only the dc average , ignoring the torque at 2100 kHz, the stiffness torque is given by
| (3) |
Here is the (unstable) electrostatic equilibrium angle where this torque vanishes.
To measure the sensing stiffness , we modulate the effect by switching the 6 VRMS injection voltage on and off at frequency = 5 mHz. The resultant pendulum deflection, measured by the autocollimator, is proportional to , and the amplitudes at odd multiples of reflect the dependence of the squarewave torque’s Fourier coefficients. The measurement is made over a range of test mass angles by rotating the pendulum suspension point. Linear fitting of torque amplitude versus for each odd harmonic of gives estimates of and (the latter measured relative to the sensor zero).
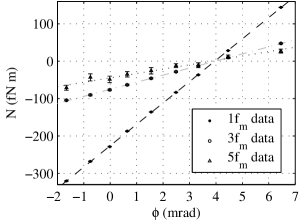
Figure 3 shows modulated stiffness torques for the first three odd harmonics of . The resulting estimates for and , shown with their statistical uncertainties in Table 1, are in agreement for the three harmonics. Though the statistical resolution for (for ) in a given measurement is below 1%, repeated measurements have yielded a scatter of , which is currently being investigated. The measurement has also been performed at a fixed angle for a range of , verifying the expected dependence. The range of measured with the modulation technique is consistent with the observed period change for sensor bias on and off, which yield fN m/mrad. A prediction for obtained using a finite element capacitance calculationShaul and Sumner (2002) gives 5 fN m/mrad, with the uncertainty dominated by machining tolerances. The measured several mrad offsets between the torque and sensor zeros, which would coincide in a geometrically perfect sensor, are also consistent with the machining tolerances.
| Component | (fN m/mrad) | (mrad) |
|---|---|---|
| 1 | -89.76 0.11 | 3.95 0.01 |
| 3 | -89.3 0.7 | 3.97 0.07 |
| 5 | -92 6 | 3.8 0.4 |
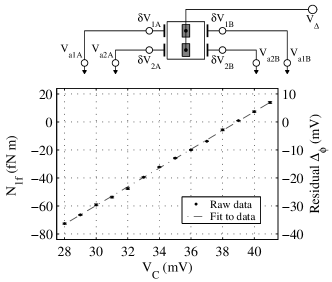
Another potentially important noise source for LISA is stray dc electrostatic fields, associated with patch or surface contamination effects. A charged test mass feels force (torque) proportional to the net linear (rotational) imbalances in the electrostatic potential on the surrounding sensor surfaces. For the cosmic ray charging expected for LISA Araùjo et al. (2003), net dc potential imbalances of order 10 mV can produce significant low frequency acceleration noise Weber et al. (2002b); Bender (2003). To measure dc imbalances, we simulate a charge modulation by biasing the mass with a voltage applied to the injection electrodes and measure the resulting pendulum torquecos .
Assigning a mean stray dc voltage to each conductor, the torque produced in this measurement is
| (4) |
In principle, to reflect the electrostatic potential non-uniformity, the sum over electrodes should be an integral over all surface domains with different potentials. In the naive but useful model where each electrode has a spatially uniform potential, the sum in Eqn. 4 reduces to , where is the rotational dc imbalance in the four electrodes (see Fig. 4) and we assume an infinite plate model for the capacitance derivatives.
The torque in Eqn. 4, and likewise the associated random charge disturbance, is proportional to a net rotational dc bias imbalance, which can be compensated by counter-biasing the sensing electrodes with the actuation circuitry. Figure 4 shows measured torques as a function of the compensation voltage . The measured torque is nulled very close to = 39 mV (thus -160 mV), with balancing of the residual possible within 1 mV. An additional long measurement made for = 39 mV has shown millivolt level stability in the residual imbalance over a 50 h period.
The results presented here, derived from measurements of torque on a suspended hollow test mass that is free only along a single rotational axis, merit some discussion concerning their representativity of the translational forces acting on an orbiting, solid Au/Pt LISA test mass. For the rotational stiffness measurement, is proportional to the translational sensing stiffness , with replaced by in Eqn. 3. The sensor ac bias is likely the dominant stiffness source, but it is not the only one. The apparatus is being upgraded to measure the full sensor-test mass coupling by modulating the sensor rotation in . The measurements here confirm the sensor electrostatic model and convert to a translational stiffness uncertainty of 15 nN/m, roughly 5% of the total LISA stiffness budget Bortoluzzi et al. (2003).
The rotational dc bias measurement and compensation shown here is also directly applicable to the translational dc bias imbalance of relevance to LISA acceleration noise. Modulating also excites a coherent force, detectable in flight cos , proportional to the translational imbalance, . The uniform potential model for is valid only as a rough number, as it neglects spatial surface potential variation. However, the measurement itself is sensitive to a sum over all surface domains, and thus the compensation that nulls the modulated torque (or force) will also null the torque (or force) produced by test mass charging. Compensating a 100 mV-level imbalance to within 1 mV reduces the potentially important random charging effect to an insignificant acceleration noise level.
The torque noise data can be cautiously converted into upper limits on specific contributions to the force noise acting on LISA test masses. The hollow test mass used here is largely immune to gravitational or magnetic fields coupling to the bulk LISA test masses, and the torsional mode is insensitive to net forces from important linear temperature or field gradient effects Dolesi et al. (2003). This pendulum is designed for maximum sensitivity to surface forces, arguably the most dangerous and unpredictable sources for sensors with several-mm gaps. Any electrostatic interaction between 100 kHz circuit noise and the sensor excitation, or between dc biases and low frequency voltage noise, produces torque noise proportional to the net force noise. For these effects, the appropriate arm length for converting to force noise is the electrode half-separation mm, which gives a force noise upper limit of 1 pN between 0.6 and 10 mHz for such sources. Molecular impacts give force and torque noise on all test mass faces and have a 20 mm effective arm length, yielding a 500 fN upper limit from 0.6 - 10 mHz, with 250 fN around 3 mHz. This last number corresponds, for a solid Au/Pt test mass of the same dimensions, to acceleration noise of 200 fm/s2, a factor 7 above the LTP flight goal.
Acknowledgements.
We thank E. Adelberger and B. Hamilton for reviewing this manuscript and D. Shaul for electrostatic analysis. This work was supported by ESA, INFN, and ASI.References
- (1) P. Bender et al, LISA ESA-SCI(2000)11, 2000.
- Dolesi et al. (2003) R. Dolesi et al., Class. Quant. Grav. 20, S99 (2003).
- Schumaker (2003) B. Schumaker, Class. Quant. Grav. 20, S239 (2003).
- Bortoluzzi et al. (2003) D. Bortoluzzi et al., Class. Quant. Grav. 20, S89 (2003).
- Hanson et al. (2003) J. Hanson et al., Class. Quant. Grav. 20, S109 (2003).
- Smith et al. (1999) G. L. Smith et al., Phys. Rev. D 61, 022001 (1999).
- Hueller et al. (2002) M. Hueller et al., Class. Quant. Grav. 19, 1757 (2002).
- Cavalleri et al. (2001) A. Cavalleri et al., Class. Quant. Grav. 18, 4133 (2001).
- Weber et al. (2002a) W. J. Weber et al., Class. Quant. Grav. 19, 1751 (2002a).
- Weber et al. (2002b) W. J. Weber et al., SPIE Proc. 4856, 31 (2002b).
- Shaul and Sumner (2002) D. N. A. Shaul and T. J. Sumner, SPIE Proc. 4856, 43 (2002).
- Araùjo et al. (2003) H. M. Araùjo, A. Howard, D. N. A. Shaul, and T. J. Sumner, Class. Quant. Grav. 20, S311 (2003).
- Bender (2003) P. L. Bender, Class. Quant. Grav. 20, S305 (2003).
- (14) W. J. Weber et al., gr-qc/0309067 (to be published).