High quality factor measured in fused silica
PREPRINT August 11, 2000.
Abstract
We have measured the mechanical dissipation in a sample of fused silica drawn into a rod. The sample was hung from a multiple-bob suspension, which isolated it from rubbing against its support, from recoil in the support structure, and from seismic noise. The quality factor, , was measured for several modes with a high value of 57 million found for mode number 2 at 726 Hz. This result is about a factor 2 higher than previous room temperature measurements. The measured was strongly dependent on handling, with a pristine flame-polished surface yielding a 3–4 times higher than a surface which had been knocked several times against a copper tube.
I Introduction
Several interferometric gravitational wave detectors are currently being built and commissioned around the world [1, 2, 3, 4], with additional interferometers planned for the future [5, 6]. The extremely weak interaction between gravitational waves and laboratory sized masses requires noise in the interferometer from all sources to be aggressively minimized.
Thermal excitations represent one of the limiting noise sources and are expected to be a major constituent of the LIGO II [6] noise budget in the intermediate frequency range (roughly 20 Hz to a few hundred Hertz). Thermal noise is caused primarily by dissipation in the interferometer test masses and their suspensions. To minimize thermal noise, these components must be made from materials with low internal friction.
Fused silica, an extremely pure form of silicate glass, has been found to have low internal friction at room temperature [7, 8, 9, 10, 11, 12]. The current design for LIGO II specifies that the optic suspensions be composed entirely of fused silica. Single-crystal sapphire is being considered for the mirrors themselves, with fused silica as a fallback material [6]. We have made dissipation measurements on fused silica samples to help design the next generation of interferometers.
II Experiment
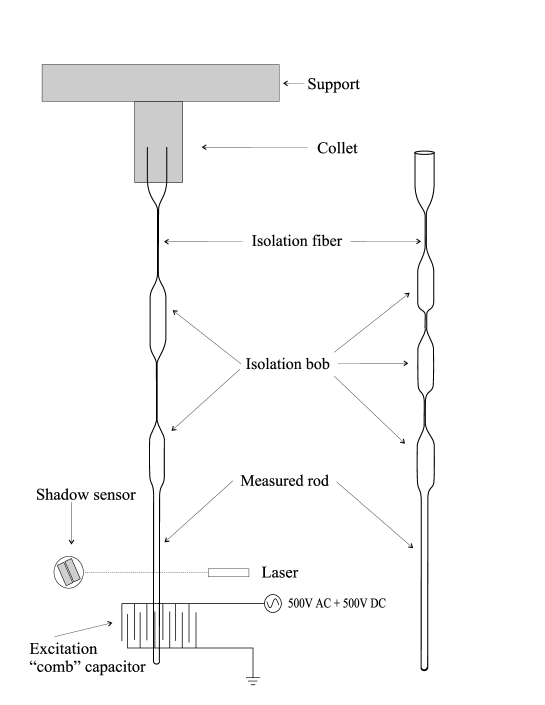
Our sample was composed of Suprasil 2 brand fused silica manufactured by Heraeus Amersil, Inc. We started with a silica rod 8 mm in diameter and drew it down to a rod 3.5 mm in diameter and 18.8 cm in length, using a natural gas flame. A bob of the 8 mm stock was left attached to one end of the 3 mm sample. A fused silica suspension was drawn above the sample from the same 8 mm stock. We made measurements with two different suspensions, both shown in Figure 1. These suspensions were distinguished by the number and size of the intermediate isolation bobs. The topmost bob was secured in a stainless steel collet which was bolted to a thick aluminum plate supported by four aluminum legs. The whole structure was contained in a vacuum bell jar which was pumped down below 1 mPa (typically below 0.1 mPa).
This sample had been previously measured in 1998 [11]. The current experimental procedure and data analysis are nearly identical to those described in that reference. The sample was excited at the resonant frequency using a comb capacitor exciter [13]. Then, with the exciter grounded, the sample was allowed to ring down. The position of the sample was measured using a shadow sensor. The data was fit to a damped sinusoid from which we extracted the ringdown time, . Using the mode frequency, , we calculate .
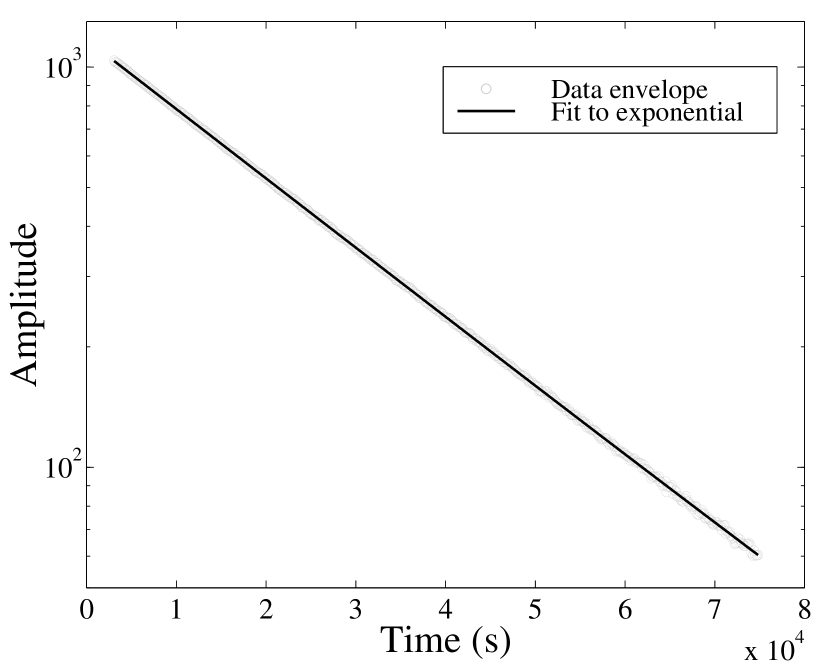
The ring down that yielded our best is shown in Figure 2. The fit to an exponential decay is excellent. On the whole, the fit residuals for our data runs were featureless gaussian noise, with . We observed no evidence for external excitations (ie. seismic) in the data, nor did we account for such excitations in the data analysis.
The scatter in the results of repeated measurements was typically about 5%, which is substantially higher than expected given our gaussian measurement noise (statistical error). For example, the fiber mode that yielded our best results had the following scatter: , , . We believe this scatter arises from small excess losses which vary from run to run. Possible examples of such losses include rubbing friction in the clamp, temperature dependence of recoil loss, and eddy current damping. These losses would all diminish the measured and would not obey gaussian statistics. Therefore we quote the highest measured as the best indication of the level of dissipation in a given sample.
The highest found previously for this sample was in both modes 2 and 3 [11]. After these earlier experiments, the sample’s diameter was measured with steel calipers at about 1 cm intervals along its length. It was then placed in a borosilicate glass tube and stored at room temperature on a laboratory shelf for sixteen months.
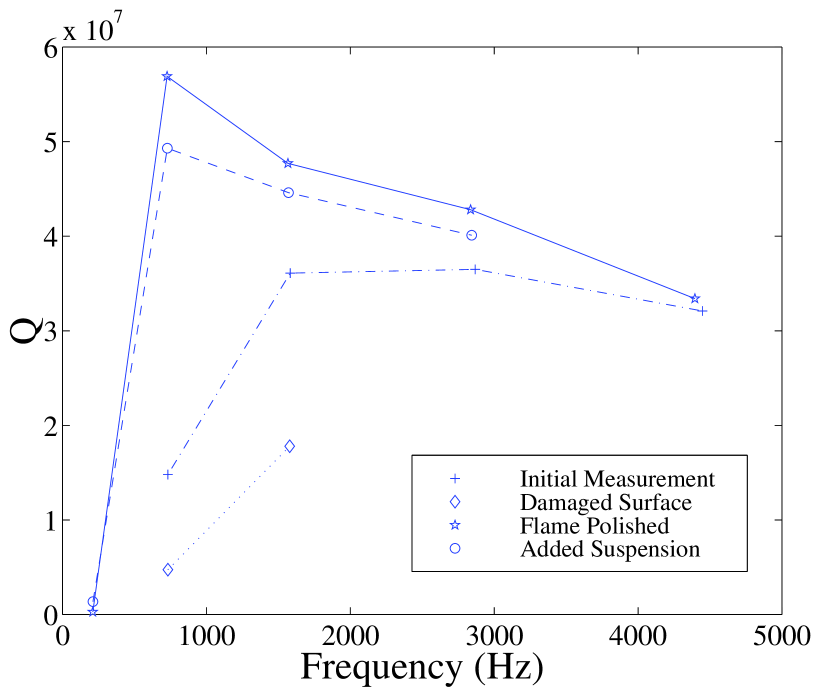
After storage, the sample was removed from the glass tube and hung in a new vacuum enclosure which is more massive and sits on an optical table rigidly connected to the floor. The sample was hung as before from a collet with the same multiple bob suspension. Five mechanical modes of the sample were found using the comb capacitor exciter with a DC offset of 500 V and an AC signal at the resonant frequency and amplitude of 500 V. The shadow sensor consisted of a diode laser which cast the shadow of the silica rod on a split photodiode. The highest ’s found for each mode are shown in Table I and Figure 3. For this diameter of fused silica fiber, thermoelastic damping is negligible at the measured frequencies.
After a first set of measurements, the sample, still hanging from the multiple bob suspension, was inserted into a 2.8 cm diameter copper tube in preparation for a separate experiment. The sample knocked against the copper tube multiple times during the insertion. Immediately following this procedure, the measured ’s were significantly lower (see Table I and Figure 3).
We hypothesized that the lower ’s came from an increase in surface loss [11], induced by the knocking of the sample against the copper tube. To test this hypothesis, the sample was removed from the upper suspension (all fibers and bobs above the bob directly connected to the sample) and flame polished. The polishing was done by fixing the remaining bob in a clamp and holding a natural gas flame to the sample. The flame was held in place long enough so the surface reached the glass transition temperature. The flame was then moved back and forth across the sample so the entire surface reached this point, although not simultaneously. The duration of the flame polishing was 15 minutes. The sample was then allowed to cool in air until the bob could be held, another 15 minutes.
The sample was then moved back to the laboratory and immediately reconnected to the suspension. The original bobs were used, but new connecting fibers were drawn between all the bobs. These fibers were drawn to be thinner than on the previous suspension, with the new fibers being typically m in diameter. Extreme care was taken to ensure that the sample surface was untouched from the time it was flame polished until it was suspended in the bell jar.
The ’s measured after flame polishing (see Table I and Figure 3) showed a marked increase compared to all previous measurements for this sample. Indeed these values are nearly twice any previously reported room temperature measurement [14] and equal to the highest measurement of in fused silica at any temperature [15].
The aberrantly low value found for mode 1 is believed to be due to the inability of the suspension to adequately isolate the sample from modes in the aluminum support structure (recoil damping) at this low frequency. The decrease of with frequency for modes 2–5 is not understood. It may indicate the frequency dependence of an internal loss mechanism such as an Arrhenius loss peak [16], or it may be due to acoustic radiation traveling up the suspension.
To test the effect of the suspension on the sample ’s, we removed the sample from the suspension and redrew the suspension with one additional bob. The fibers were again drawn to be m thick. In order to keep the entire suspension plus sample roughly the same height, two smaller bobs had to be substituted for the larger central bob. These new bobs were also of Suprasil 2 fused silica. The redrawing of the suspension and repositioning of the sample in the vacuum chamber was once again done with great care so the sample’s surface was not touched. The measured ’s using this new suspension are shown in Table I and Figure 3.
III Discussion
The ’s we measured of the flame-polished fused silica rod are the highest ever observed for fused silica at room temperature. The previous highest measurement at room temperature, , was obtained by Lunin [10, 14] using a “wine glass” resonator. The damaged surface layer of this resonator was removed using an unpublished chemical treatment.
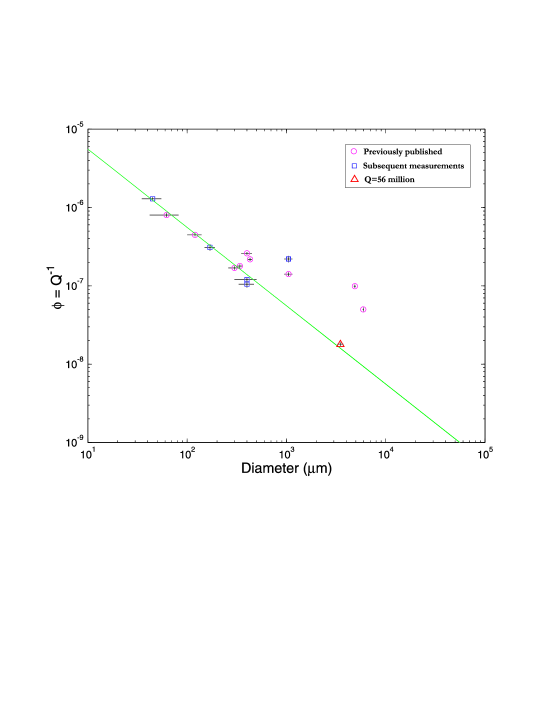
The observed dependence of on surface condition is generally consistent with prior work [10, 11]. However, the results of this experiment do supersede the quantitative conclusion of Ref. [11], as the value lies significantly below the curve shown in Figure 6 of that reference. Thus, that paper’s predicted value for the bulk dissipation of fused silica, , is too high and instead should be considered indicative of the level of excess loss in these prior measurements.
In Figure 4 we have plotted our current data along with the data from Ref. [11]. We have also included some more recent data taken in the same way as in that paper. Using the theoretical model presented in Ref. [11], we have plotted the line indicating the dependence of in the surface limited regime. All the data, including our recent measurements, are limited by this line, suggesting that even the highest measured ’s are limited by surface loss. If that were the case, then the bulk for fused silica would be greater than . The present data are not sufficient to determine using our theoretical model. Further research in this area is clearly warranted.
It is interesting to compare our results here with the results of Lunin [15], who, using a fused silica hemispherical resonator at 8400 Hz, found the to peak at 105 C at a value of 55 million. If the loss mechanisms that dominates Lunin’s results are Arrhenius processes with similar activation energies, then at a lower resonant frequency, the would peak at a lower temperature. It is possible that at 726 Hz, the peak is near room temperature. We are currently conducting an experiment to measure the temperature dependence of at these lower resonant frequencies.
To test whether our results were limited by suspension losses, we added an additional isolation bob in our fiber suspension. Except for mode 1, the ’s did not change much, which indicates that modes 2–5 are not suspension limited and that their losses arise from internal mechanisms. With the additional isolation bob, the of mode 1 increased from to . This increase indicates that mode 1 was suspension limited by the initial multiple bob suspension. The fact that the for mode 1 is still well below that of the higher modes, suggests that even with the new suspension mode 1 is still suspension limited.
If these values could be obtained in a test mass of a gravitational wave interferometer, the thermal noise would be significantly lower than currently anticipated for silica optics [6]. The thermal noise from the mirrors’ internal modes expressed as a spectral density of gravitational wave strain is given by [17]
where is Boltzmann’s constant, is the temperature, is the arm length of the interferometer, is Poisson’s ratio, is Young’s modulus, is the width of the laser beam, and is the loss angle. In this frequency band, we have assumed that [11]. If fused silica optics with were used in LIGO II, their thermal noise would dominate the noise budget over a couple of octaves centered on Hz. The thermal noise associated with is almost lower, a substantial improvement.
Actually realizing this lower thermal noise in the mirrors’ internal modes could prove quite challenging. The dependence of on surface condition could rule out high ’s in a polished mirror. Even obtaining the estimated in the LIGO II design [6] may prove difficult because the mirror surfaces of the test masses and beam splitters must be polished and coated. There is evidence that these coatings may limit achievable thermal noise [18]. We are currently conducting experiments to explore this issue.
It is unlikely that our current results could help reduce the low frequency noise in the LIGO II design. While fused silica ribbons are planned for the final stage of the test mass suspension, their thermal noise, which should be dominated by surface loss, is already expected to be so low [19, 20] that it is comparable to the radiation pressure noise.
Acknowledgments
We would like to thank John Chabot for his talent and skill in drawing and flame polishing the fused silica rod; Lou Buda, Charlie Brown, and Lester Schmutzler for their machining efforts; and Adam Schuman and Brian Gantz for their help. We also thank William Startin for originally suggesting an experiment that led to these results. This work was supported by Syracuse University and National Science Foundation Grant No. PHY-9900775.
| Mode Number | Q (i) | Q (ii) | Q (iii) | Q (iv) |
|---|---|---|---|---|
| 1 | ||||
| 2 | ||||
| 3 | ||||
| 4 | ||||
| 5 |
REFERENCES
- [1] A. Abramovici et al, Science, 256 325 (1992)
- [2] A. Giazotto et al., Nucl. Instrum. Methods A 289, 518 (1988).
- [3] K. Danzmann et al., GEO 600: Proposal for a 600 m laser interferometric gravitational wave antenna, Max-Planck-Institut für Quantenoptik Report 190, Garching Germany (1994).
- [4] K. Tsubono, in Gravitational Wave Experiments, proceedings of the First Edoardo Amaldi Conference, World Scientific, 112, (1995).
- [5] D. E. McClelland, M. B. Gray, D. A. Shaddock, B. J. Slagmolen, S. M. Scott, P. Charlton, B. J. Whiting, R. J. Sandeman, D. G. Blair, L. Ju, J. Winterflood, D. Greenwood, F. Benabid, M. Baker, Z. Zhou, D. Mudge, D. Ottaway, M. Ostermeyer, P. J. Veitch, J. Munch, M. W. Hamilton, C. Hollitt, in Gravitational Waves, proceedings of the Third Edoardo Amaldi Conference, ed. S. Meshkov, Melville NY: American Institute of Physics, 140-149 (2000), (http://131.215.125.172/info/paperindex/pdf/McClelland.pdf).
- [6] LSC White Paper on Detector Research and Development, (http://www.ligo.caltech.edu/docs/T/T990080-00.pdf).
- [7] D. B. Fraser, J. Appl. Phys. 39, 5868 (1968); 41, 6 (1970).
- [8] W. J. Startin, M. A. Beilby, and P. R. Saulson, Rev. Sci. Instr. 69 3681 (1998).
- [9] A. D. Gillespie, PhD. thesis (California Institute of Technology, 1995) Unpublished.
- [10] B. S. Lunin, S. N. Torbin, M. N. Danachevskaya, and I. V. Batov, Moscow University Chemistry Bulletin 35, 24 (1994), Allerton Press, Inc.
- [11] A. M. Gretarsson and G. M. Harry, Rev. Sci. Instr., 70, 4081 (1999), (http://xxx.lanl.gov/abs/physics/9904015).
- [12] E. J. Loper, D. D. Lynch, and K. M. Stevenson, IEEE PLANS (Position Location and Navigation Symposium) Record, Caesar’s Palace, Las Vegas, Nevada, November 4-7, 1986, pp. 61-64, Table 2.
- [13] A. Cadez and A. Abramovici, J. Phys E: Sci. Instr. 21 453 (1988).
- [14] B. S. Lunin, Chemistry Department, Moscow State University (private communication, May 1997).
- [15] B. S. Lunin and S. N. Torbin, Vestnik Moskovskogo Universiteta, ser. 2, Khimia, 41 93 (2000). English version in press.
- [16] C. M. Zener, Elasticity and Anelasticity in Metals, Univ. of Chicago Press, Chicago, 1948.
- [17] Y. T. Liu and K. S. Thorne, submitted to Phys. Rev. D, (http://xxx.lanl.gov/abs/gr-qc/0002055).
- [18] A. M. Gretarsson, G. M. Harry, S. D. Penn, P. R. Saulson, J. J. Schiller, W. J. Startin, in Gravitational Waves, proceedings of the Third Edoardo Amaldi Conference, ed. S. Meshkov, Melville NY: American Institute of Physics, 306-312 (2000), (http://131.215.125.172/info/paperindex/pdf/Gretarsson.pdf).
- [19] S. Rowan, R. Hutchins, A. McLaren, N. A. Robertson, S. M. Twyford, and J. Hough, Phys. Lett. A, 227 153 (1997).
- [20] A. M. Gretarsson, G. M. Harry, P. R. Saulson, S. D. Penn, W. J. Startin, J. Hough, S. Rowan, G. Cagnoli, Phys. Lett. A, 270, 108 (2000), (http://xxx.lanl.gov/abs/gr-qc/9912057).