Scatter Networks: A New Approach for Analyzing Information Scatter
Abstract
Information on any given topic is often scattered across the Web. Previously this scatter has been characterized through the inequality of distribution of facts (i.e. pieces of information) across webpages. Such an approach conceals how specific facts (e.g. rare facts) occur in specific types of pages (e.g. fact-rich pages). To reveal such regularities, we construct bipartite networks, consisting of two types of vertices: the facts contained in webpages and the webpages themselves. Such a representation enables the application of a series of network analysis techniques, revealing structural features such as connectivity, robustness, and clustering. Not only does network analysis yield new insights into information scatter, but we also illustrate the benefit of applying new and existing analysis techniques directly to a bipartite network as opposed to its one-mode projection. We discuss the implications of each network feature to the users’ ability to find comprehensive information online. Finally, we compare the bipartite graph structure of webpages and facts with the hyperlink structure between the webpages.
1 Introduction
Information on any given topic tends to be scattered on the Web. No one page seems to have all the facts, and no one fact seems to be in all the relevant pages. But besides this simple observation of the fact frequency, very little is understood about how the information is actually distributed. In this work, we extend prior notions of information scatter by constructing a bipartite graph of documents and the facts (pieces of information) they contain. The networks we construct are not the typical networks of hyperlinked webpages. Rather, pages are linked together by shared information content and information is linked to other information by co-occurrence in webpages. The notion of webpages being linked by the common facts they contain is not as far from users’ search behavior as it may first seem. A Web user seeking comprehensive information might explore a new topic by alternately querying a search engine with keywords, reading a webpage and modifying the search queries to incorporate the new information learned. Therefore, how a user explores a topic space while using a search engine is directed both by this bipartite network of webpages and facts and by the hyperlinks being traced. While much research has gone into developing algorithms for ranking search engine results using hyperlinks and semantic content, little has been done to explore how comprehensive the information available to the user is. Our novel approach of representing the scatter of information as a scatter network allows for an exploratory view of this previously obscured phenomenon.
To illustrate the utility of our approach, we apply qualitative techniques such as visualization and quantitative network analysis metrics to a sample network of pages about the medical condition melanoma, and the facts about melanoma they contain. The visualization, in addition to making apparent the highly skewed distribution of facts, also reveals a clustering of facts and documents into sub-topics. We use a bipartite measure of clustering to show that the information is indeed highly clustered and a community finding algorithm to automatically identify those clusters. We apply proximity measures to infer how quickly a user exploring this bipartite network would find related facts. Crucial to rapid fact discovery are those facts and documents that bridge multiple topics. We identify them through a network centrality measure called betweenness [15]. To determine just how crucial these bridging facts and documents are, we perform a robustness analysis where we remove a fraction of the documents and examine if the different facts are still connected through document co-occurrence.
Given that most novice users have difficulty finding comprehensive healthcare information on the Web [9], we discuss implications for search and retrieval in each part of our network analysis. For example, a measure called assortativity tells us whether facts contained in fact-rich pages tend to be common or rare. If the latter is the case, one can simply point a user to several fact-rich pages and expect that the information across them should be comprehensive. If the former is the case, however, the fact-rich pages will contain redundant information, while the rare facts will be hidden by themselves in other documents. Finally, we compare the scatter network structure with the hyperlink structure in order to answer the question of how rapidly a user can access comprehensive information. Although our present study is exploratory in nature, our findings have important implications to the design of both search engines and the websites they are covering.
1.1 Background
Several studies have analyzed the distribution of content across information sources at different levels of granularity. These include the distribution of articles across journals [10], the distribution of words within a book [37], the distribution of articles across online databases [35, 22, 18], and the distribution of facts about a topic across webpages and websites [7, 29]. In each case, the studies analyzed the relationship of one variable (e.g. number of relevant articles) against another variable (e.g. number of journals) through a distribution analysis. Each of the resulting distributions was highly skewed. As we have already mentioned, a few facts tend to occur in many pages, while many facts occur in a few. Similarly, a few pages contain many facts while most contain just a few. This consistent result has led researchers to believe that skewed distributions are a stable property of how information tends to exist across information sources [6], a phenomenon commonly referred to as information scatter. In an earlier study [7] we speculated that the amount of detail (e.g. a single sentence versus a paragraph) devoted to a fact on a page could explain why there are so many pages with few facts about a common healthcare topic across high-quality healthcare sites. Although the above studies reveal the complex and dynamic nature of content and links on the Web, little is understood about the regularities underlying the scatter of facts across pages.
Networks have been studied in a wide variety of fields, ranging from sociology to biology to computer science [27]. Network analysis has particular relevance to the structure of the World Wide Web, a network with billions of pages that are connected through even more numerous hyperlinks [11, 1]. The structure of the Web has implications in search engines’ coverage, as well as their ability to rank relevant results [30, 20]. Relatively few studies have focused on bipartite networks directly, without first taking their one-mode projections. But considering, for example, a bipartite model of authors and articles, explains much of the degree distributions and clustering coefficients observed in the one-mode projection network of co-authors [28, 33, 13].
In applying network analysis techniques to scatter networks, we build on previous work on the scatter of facts across webpages, with the goal of understanding regularities within the scatter, and the implications of those regularities on approaches to help users find more comprehensive information.
2 Methodology
2.1 Description of data set
Our data set, obtained from a previous study [7], consists of a set of webpages on the topic of melanoma, and the set of facts that are contained within them. The data was gathered in several steps:
-
1.
A set of facts (e.g. high UV exposure increases your risk of getting melanoma) were identified about 5 melanoma topics: risk/prevention, self-exams, diagnosis, doctor’s visits, and staging.
-
2.
These facts were verified and expanded upon by a panel of experts, in this case doctors who are melanoma specialists.
-
3.
A search query was generated for each fact by search experts.
-
4.
10 high quality websites were selected by asking specialists and from the MedlinePlus listing of sites containing information on melanoma111www.nlm.nih.gov/medlineplus/melanoma.html.
-
5.
The Google search engine was used to retrieve webpages which matched queries corresponding to the facts from within the 10 authoritative sites with skin cancer information.
-
6.
Human judges evaluated whether a fact was present in each of the webpages retrieved.
This process resulted in 53 facts about 5 melanoma topics that occurred in 336 relevant pages from the top-10 websites with skin cancer information. Because natural language processing techniques are so far unable to reliably identify facts [32], and human evaluation, while much more reliable, is quite slow, the data set is necessarily relatively small. We believe, however, that our analysis shows the applicability of network concepts to the study of information scatter, and already provides several novel insights even from the small subset of pages on the topic of melanoma.
2.2 Constructing and visualizing the scatter network
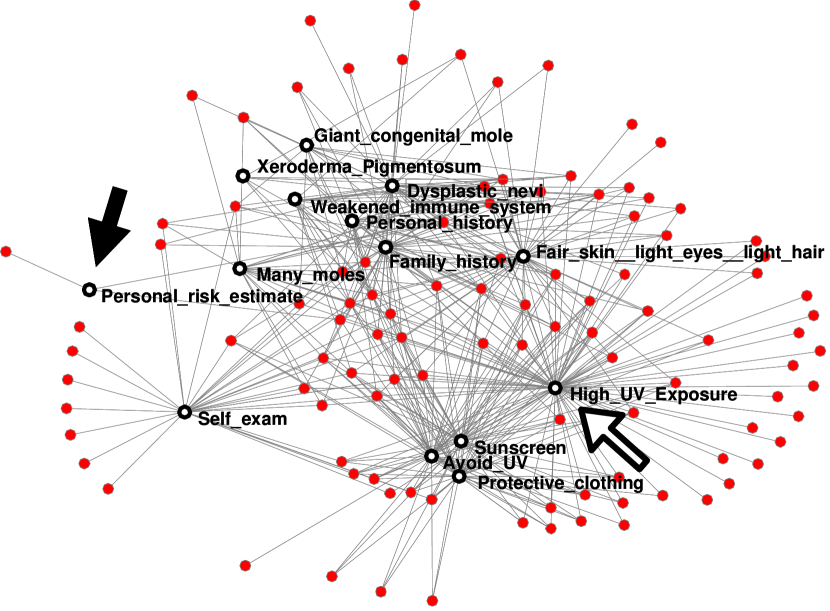
We construct our scatter network by drawing an edge between each webpage and each fact contained in that webpage. Because edges exist only between two different types of nodes, the facts and pages, this is what is known as a two-mode or bipartite graph. While we will shortly describe a number of quantifiable characteristics of networks, much can be learned by visualization, especially if the networks are of small to moderate size. Figure 1 shows a spring layout of the network of melanoma risk facts and the documents that contain them. The spring layout places vertices that are connected to each other close together, as if they are connected by springs that pull them together, while allowing vertices that are not connected to drift apart. It is immediately apparent that three facts placed close together near the bottom of the layout are closely related because they co-occur in many of the same documents. These are the three facts pertaining to preventing melanoma: avoiding UV radiation, wearing sunscreen, and wearing protective clothing. In addition we see that some facts are important enough to be mentioned by themselves in certain documents. These facts are: self-exams can help prevent more advanced melanoma and that high UV exposure causes melanoma. We will compare this bipartite scatter network to the one-mode hyperlink network of webpages in Section 4.
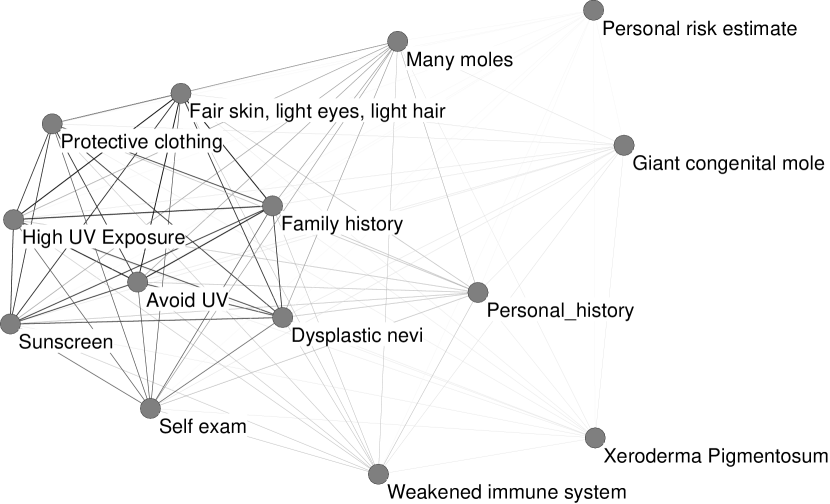
One can transform a two mode network into a one mode network by considering, e.g. two facts linked if they co-occur on at least one webpage. Such a one-mode projection is shown Figure 2. Note that such a transformation is lossy, that is we no longer know which documents the facts co-occurred in. One can however assign weights to each edge corresponding to the number of shared connections in the two-mode network. Since most network metrics are designed only for unweighted networks, and since omitting weights introduces a further loss of information, we will prefer to work with the full bipartite network directly.
3 Network analysis
To explore the nature of information scatter, we use a series of network measures, most of them quite well established, but almost of which have so far been primarily applied to one-mode networks. Through these measures we can characterize (1) the regularities in the occurrence of facts across pages, and (2) the connectivity between pages and facts corresponding to different topics. Some of these analyses adapt a particular meaning when applied to bipartite networks, and each has implications for search and retrieval.
3.1 Regularities in the occurrence of facts across pages
3.1.1 Degree distributions
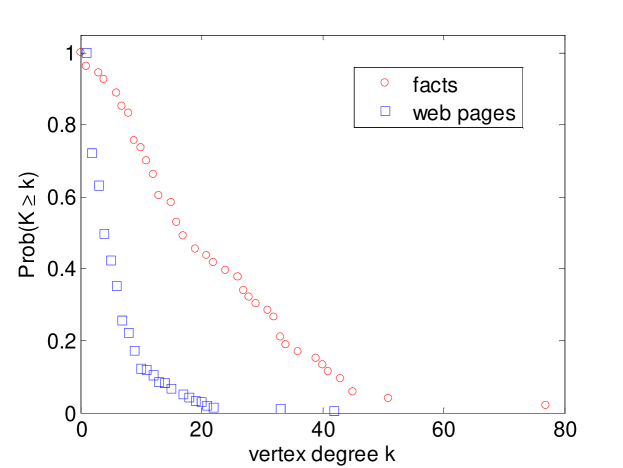
Prior studies have determined that the distribution of facts in documents is highly skewed. A few documents have many facts - many documents have a few. In our bipartite network, this statement describes the degree distribution of the document vertices. The same tends to hold for the degree distribution of the facts. A few “common” facts are mentioned in many documents, but the more numerous “rare” facts are mentioned in just a few. As shown in Figure 3, the degree distribution of pages is more skewed than that of facts, in part because pages containing facts tend to be more numerous than the facts themselves. Note that, unlike the hyperlink distribution of the web graph [3, 11], these distributions are not power-law. However, this is quite possibly due to the limitation in sampling - we do not have all the documents in the Web that contain a fact (there are over a million pages mentioning both UV and melanoma, but we only have a limited sample from selected medical websites). Likewise, there are probably hundreds of obscure facts that didn’t make it on the list. In general, a sample of a power-law network may not necessarily yield power laws [34]. What matters here is that the degree distribution confirms that many pages have few facts, while some have many, but not all.
The skew in the distribution may be due to a form of preferential attachment process. A page that already has many facts is more likely to add another, since its purpose may be to provide a wide range of information. Similarly, a fact that is contained in many pages is more likely to be learned and re-iterated on a new or existing page. In general, various mechanisms may separately lead to heavy tailed distributions [newman05powerlaw]. A sketch of a generative model particular to scatter networks is given in [8]. This brings us to the next question of where the rare facts reside.
3.1.2 Degree correlations
We next look at degree correlations in order to answer the question of whether pages containing rare facts are fact-rich or fact poor. We measure this with degree-degree correlations corresponding to the Pearson correlation coefficient between the degree of the webpage (the number of facts it contains) and the degree of the fact in the webpage (the total number of documents that contain it) [27]. Social networks, for example, tend to be assortative (have positive degree correlation) - people who know lots of people tend to know other people who know lots of people. This is particularly true of social networks constructed from bipartite graphs, for example the actor collaboration network or scientific collaboration networks. A movie with a large cast will generate a large, fully connected clique, with each member having a large degree and sharing edges with neighbors who by definition also have large degree. Many technological networks, on the other hand, are disassortative. For example, in the physical internet, highly connected regional hubs will connect lower degree vertices [25, 31]. Biological networks such as protein-protein interaction networks were also found to be disassortative [24]. Note that in all of these networks, one measures the assortativity among vertices of the same type, e.g. do the co-authors of high degree authors themselves have high degree?
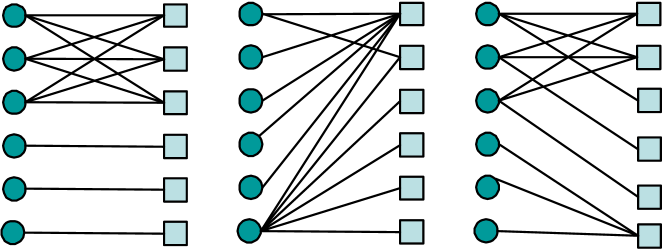
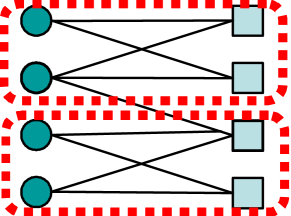
| (a) assortative | (b) disassortative | (c) neutral |
In the context of scatter networks, it makes most sense to view assortativity from a bipartite, and novel, perspective. Rather than asking whether the one-mode projection of facts or webpages is assortative, we look at the degree correlations of the webpages and facts in relation to each other, as shown in Figure 4. The diagram on the left shows a toy assortative network (Pearson correlation ), with high degree documents connected to high degree facts, and low degree documents linking to low degree facts. In other words, assortativity implies that pages rich in facts will mention the most common facts that are found in many other documents, while pages that mention only a single fact will tend to mention less widely discussed facts. The diagram in the middle is a disassortative network (). In this example, there is a single page mentioning all the facts, and one fact that is mentioned in all the pages, most of which mention only that one fact. In actuality, we find that information scatter tends to be disassortative in four of the five topics: risk/prevention (-0.26**), doctor’s exam (-0.35***), diagnostic tests (-0.17*), and disease stages (-0.56***)222***, **, and * denote significance at the 0.001, 0.01 and .05 levels respectively.. For example, in the risk/prevention scatter network (Figure 1), the common fact High UV Radiation (close to the white arrow) occurs in many fact-poor pages, presumably because of its importance to preventing melanoma. Furthermore, the rare fact Personal Risk Estimate (close to the black arrow) occurs in two fact-rich pages in the center of the graph.
In contrast, for the topic Self-exam, there was a positive degree correlation (0.14*). Here, fact-rich pages tended to contain the same common facts related to mole appearance, and rare facts such as resources for locating a dermatologist, were located on pages containing few or no other facts. What can we conclude from the above observations of negative assortativity? Primarily, while information is scattered, it is the common facts that appear on their own, while the rare facts tend to be covered along with many of the other facts in comprehensive pages. Note that the disassortativity is closely linked to the skewed degree distributions. Because the networks are small, constraining the degrees constrains the structural variety of randomized versions of the graph [17, 5]. In particular, the skewed degree distribution dictates that the fact-rich pages are likely to contain several of the rare facts in order to satisfy their degree constraint [25]. In all subtopic networks, randomized versions of the network which conserve degrees have negative assortativity. For example, a randomized version of doctor’s visit topic has an expected degree-degree correlation of , slightly less disassortative than the observed . Interestingly, even for the self-exam topic, where the measured correlation is positive, the degree correlation of a randomized network is negative ().
What implications do degree correlations have for a person seeking health information? If they have access to a search engine that ranks fact-rich pages highly, they will have immediate access to many, if not most, of the facts in the first few documents they access. For example, if information is distributed as in Figure 4 b) and the document with all the facts is ranked most highly by the search engine, it will not matter that all the other documents mention only one or two facts. However, if information is distributed as in Figure 4 a), and the search engine ranks the most fact rich pages most highly, then the user will find the exact same common facts in the first 3 search results, and may finish her search before accessing the specific documents that have additional facts. If on the other hand the user is accessing documents at random, disassortativity (Figure 4b) means that she will have to access many documents mentioning the same common fact, and only with small probability find the one with all the facts. In contrast, in the assortative network of Figure 4a), even if she accesses a document with just one fact, this fact will likely be a new one.
3.2 Connectivity between topics
3.2.1 Connected components
When considering information scatter, we may be interested in whether a user can discover all the facts by traversing the bipartite network. This is not a straightforward traversal as is the case for the Web, where the user reaches documents by following hyperlinks. Rather, for the present we omit any consideration of hyperlinks that may exist between the documents (after all, these need not be hyperlinked documents, but rather documents stored in an online database). In the bipartite network two facts are linked if they are in the same document(s), therefore a user can learn about one fact while reading the document with regard to another. The user may then search for the second fact and read a different document that may expose them to further facts, etc. This may not be the exact mechanism by which a user discovers the facts, just as a web surfer will not tirelessly traverse all the possible hyperlinks. Instead, it is a conceptual question whether one could discover all the facts by performing such a traversal. Taking the networks in Figure 4, we can construct the following 1-mode networks of facts shown in Figure 5.
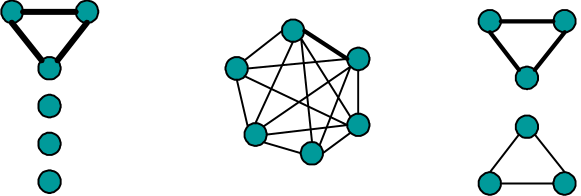
Here we consider only which facts are connected to one another through documents, rather than the documents and facts together. This has to do with our conceptual question of reachability of facts, and does not preclude applications where both may be considered. As we can see in Figure 5, the assortative network produces many isolated facts that occurred in only a single document. The highly disassortative network on the other hand had a single document that contained all the facts, thus linking them together in a complete clique. Finally, the slightly disassortative network produced two connected components.
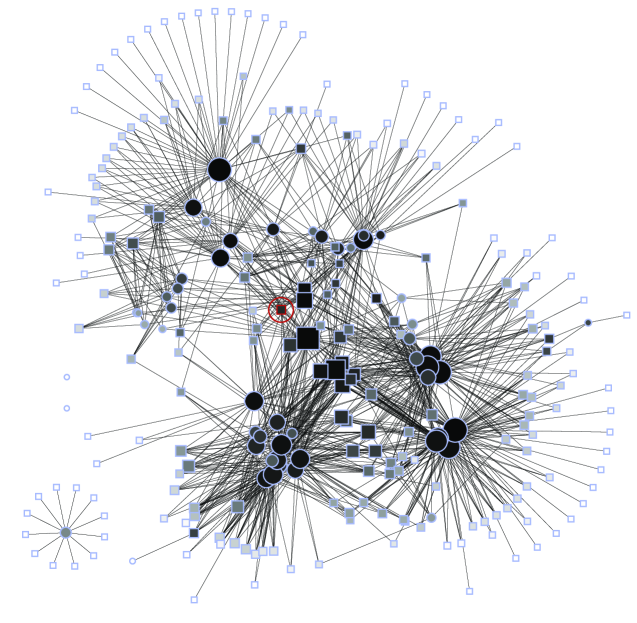
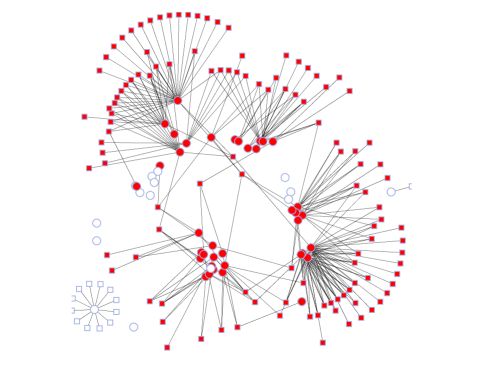
For nearly all melanoma topics, the facts are located in a single connected component. Furthermore, since some pages mentioning different melanoma topics act as connectors, facts pertaining to all five topics combine to form an even larger connected component shown in Figure 6. The three isolated facts stem from different topics. A stage calculator tool was not present on any of the documents. Likewise, no documents mentioned the fact that during a doctor’s visit, the doctor may ask about the patient’s history of UV exposure. Finally, even though twelve documents listed resources for locating a dermatologist, they did not mention any other melanoma facts, and therefore that fact is isolated in the network. While it is informative to know whether facts are connected through some path, it is further important to know whether that path or paths are short (the small world effect) and whether some facts are clustered together, indicating that they may further form a cohesive subtopic.
3.2.2 The Small World effect: shortest paths and proximity
The small world effect is named after the observation that any two people in the world are linked through a short chain of acquaintances [26, 36]. As we saw in Figure 2, our networks become quite dense when one takes a one mode projection. This means that many facts are connected through one hop (a document that mentions them both), or at most two. However, the chance of accessing exactly the one document that mentions both facts may be small. Therefore, in order to effectively evaluate the proximity of two facts, we need to consider more than just the shortest paths between them.
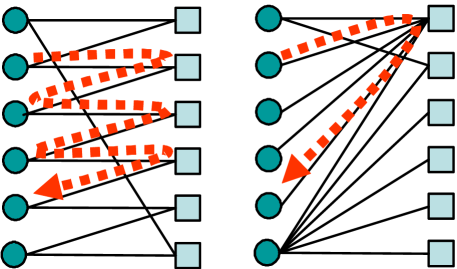
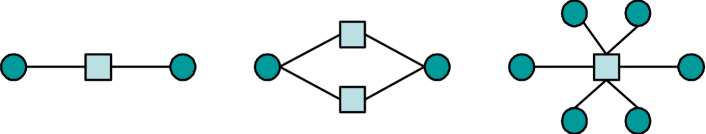
Figure 8 shows three of the many different configurations of how two facts may be linked: (a) two facts are mentioned together only in one document, and that document contains no other facts, (b) the facts co-occur in two documents, and (c) two facts co-occur in only one document, and that document contains many other facts. Intuitively, the tie between the facts is stronger in (b) than in (a) because the facts are linked together by multiple pages. The tie is also stronger in (a) than in (c), because the document in (c) is a general document containing many facts, so the co-occurrence of any of those facts is not as significant. A measure that captures proximity in this way is the cycle-free effective conductance (CFEC) [21]. It represents the probability that a user traversing the graph randomly will reach the second fact before looping back to a previously visited fact or webpage. Naturally, the more documents bridge the two facts, the more likely a user is to reach the second from the first.
In the melanoma network, facts within a topic are on average more proximate (CFEC = 1.67) than facts between topics (CFEC=0.35). The risk topic facts are overall most central in the network, having a proximity of 0.89, with the fact that high UV exposure is a risk factor for melanoma occupying the most proximate position to all other facts in the network. The other four topics had average whole network proximities of 0.40-0.43. In the following sections we will examine in more detail how one can characterize the high overlap in facts between sets of documents and apply community finding algorithms to discover them automatically.
3.2.3 Clustering
It is often useful to compute a network’s clustering coefficient, to measure how much local structure there is in the network relative to a random graph. The high clustering observed in many real-world networks reflects the prevalence of closed triads [27]. This indicates that in most real networks, if vertex A is connected with vertices B and C, then the probability for B and C to be connected is higher than expected at random. Since by definition closed triads do not exist in a bipartite network, here we define clustering in terms of cycles of length four. For example, we may ask: if a fact A is contained in documents X and Y, and B is also contained in document X, then what is the probability for B to be contained in document Y as well? Similarly, if document X has facts A and B, and document Y also has fact A, then what is the probability that document Y also has B? The answers to these questions could help us to understand the overlap of facts in documents. First, we give a definition of the clustering coefficient in a bipartite graph with documents and facts:
| (1) |
We choose this definition in lieu of the vertex-centric definition of the bipartite network clustering coefficient proposed by Lind et al. [23], because it more directly answers the questions posed above.
In the actual bipartite graph constructed by using our melanoma-related data, there are 28,831 cycles of length 4; and 316,073 connected quadruples. Thus, the clustering coefficient is , which is significantly () larger than in randomized, degree-preserving versions of the same graph (). From the above analysis on the clustering coefficient, we can see that in information networks, facts and webpages are more likely to be correlated and overlapped than if they were randomly distributed. In the following section we will take advantage of the clustering of facts to automatically discover “communities” corresponding to different topics.
3.2.4 Community Structure
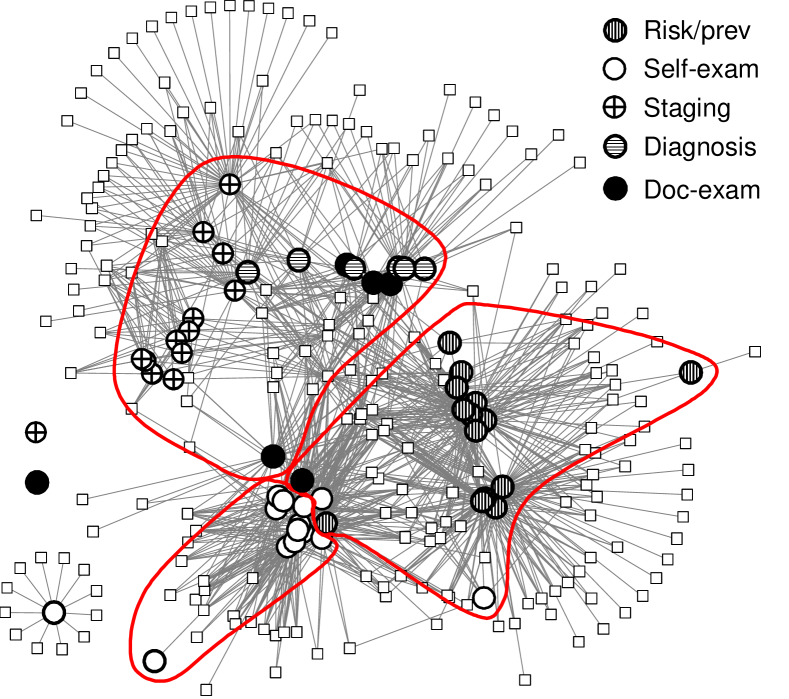
As we saw in the previous section and illustrate in Figure 9, facts may be “clustered”, many of the same facts co-occur in the same set of documents. We may be interested in identifying such clusters because they may correspond to different subtopics. For small networks, this question may be answered through a visual analysis. For example, Figure 1 shows two clusters of co-occurring facts within the risk/prevention network corresponding to two subtopics: risk (e.g. Weakened Immune System, Family History) at the top and prevention (e.g. Sun Screen, Avoid UV) at the bottom. However, larger networks such as the inter-topic scatter network shown in Figure 6, often need to be analyzed using a community-finding algorithm. The algorithm by Clauset et al. [12] aggregates nodes into groups (communities) and stops when it has achieved maximum modularity, meaning that the number of edges within communities compared to the number of edges between communities is much higher than if they had been randomly arranged. Although this algorithm has so far been applied to one mode networks, we find that simply applying it to a bipartite network without modification produces intuitive results: facts that co-occur in many documents are placed, along with those documents, in the same community.
If the five topics had mostly dedicated pages for each topic, then the algorithm would identify 5 communities in the connected part of the graph. However, as marked with the red borders in Figure 6, the algorithm found only three communities consisting of facts and pages from: (1) doctor’s exam, diagnostic tests, and disease stages, (2) self-exam, and (3) risk/prevention. The algorithm revealed that the three topics in the first community are strongly related through their co-occurrence on pages, and indeed, all three topics deal with diagnosis. In contrast, the other two communities tend to have more dedicated pages. Besides lumping three of the topics together, the algorithm also assigned three facts to a topic different from the one assigned by human experts. Two self-exam facts, checking the entire skin surface and checking for irregular moles (shown as solid white circles in the right-hand-side fact group in Figure 6) are placed in the community with risk and prevention facts. This probably occurs because self-exams are a basic part of risk and prevention. Similarly, one basic fact about doctor’s exams, that one should have them regularly (shown as a solid black circle) is also grouped under risk and prevention, probably because a doctor’s exam is also a very basic part of risk and prevention. Thus we observe that community finding connects very general facts, which may otherwise be grouped into their more specific topics, with other general and important facts. In the next section we will examine how network centrality measures can help us identify such facts that bridge different topics.
3.2.5 Centrality and betweenness
Given that information tends to be highly scattered and users may begin their exploration on an arbitrary page, we would like to determine the centrality of each page with respect to other facts and documents in the network. A user who first lands on a central page has a greater chance of rapidly learning the facts, and this has important implications e.g. for search engine ranking. Here we consider two intuitive notions of centrality. The first is simply the “degree centrality” of the vertex, namely the number of facts contained in the webpage. A webpage with many facts will be central because it will be associated with many other webpages through all the facts it contains. Naturally, a user will find more comprehensive information in a document with high degree than one with lower degree.
Having a lot of facts, however, does not necessarily guarantee broad coverage. As we saw in Section 3.2.4, groups of pages tend to specialize in specific subtopics. It is therefore possible for a page to contain many facts, but for those facts to all be on the same subtopic. A user accessing such a page may or may not become aware of other subtopics that could guide their further search. Because of this, we consider a second centrality measure, the betweenness centrality [14]. Betweenness measures not how many neighbors a vertex has (though that frequently correlates very highly with its betweenness), but rather how many shortest paths pass through that vertex. The formula for computing betweenness is:
| (2) |
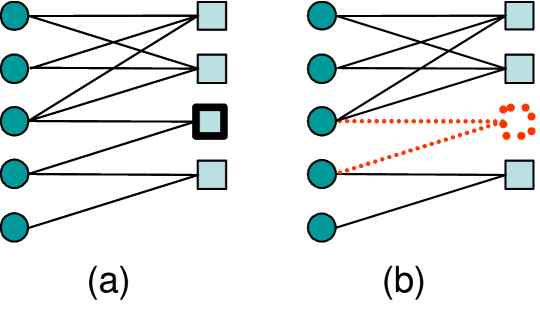
Where is the number of shortest paths connecting vertices and , and is the number of paths that vertex is on. Figure 10 illustrates the concept of betweenness on a simple scatter network. The third document from the top contains two facts, and so has slightly below average degree centrality, but it happens to link facts that do not otherwise co-occur. Even though removing the document leaves every fact still in at least one of the documents in the network, the bottom two facts may now not be discovered by a user since they do not co-occur with any of the facts in the rest of the network.
While, in principle, pages with high betweenness could be fact-rich or fact-poor, our results show that in the inter-topic melanoma network, the node degree is highly correlated with node betweenness (). This means that it is typically the fact-rich webpages that bridge the different topics. But it is at the points where the two measures diverge that we can glean interesting insights about the scatter networks. For example, the page melanomanet/medical_diagnosis.htm on the website www.skincarephysicians.com corresponds to a page on diagnosis with a modest number of facts (7). But since these facts span all 5 topics, the page has very high betweenness. A user discovering this page while searching for information on diagnosing melanoma would have the opportunity to be exposed to other topics such as doctor’s visits and melanoma staging. Similarly, the fact that a skin biopsy is the only way to be certain if a mole is melanoma is mentioned in only 9 pages, but these pages themselves are scattered across different topics, so that this rare fact becomes a central player, linking diagnosis, self-exams, and doctor’s visits as topics. Naturally, documents that link to rare facts are assigned higher betweenness because they present one of the few ways to reach those facts. In the following section we will test to what extent these high betweenness pages are essential in binding the scatter network together.
3.3 Robustness
In the context of information scatter, robustness (also termed resilience) [4, 19] is important to consider because it relates to how easily comprehensive information can be found if some webpages are removed. This is not just a matter of rare facts being contained in a few documents and therefore the removal of those documents being damaging. Rather it is a question of whether different facts about the same topic will still be discoverable, if documents that contained them together are removed. As in Section 3.2.1, we will consider the connected components in the scatter network. Remember that within each component any fact can be reached from any other by iteratively traversing edges, corresponding to a user alternately reading about new facts on a webpage and using those facts to search for additional webpages. In order to address the question of which documents are essential for comprehensive search by maintaining the connectivity of the network, we systematically remove nodes according to each of the following approaches in turn:
-
1.
Random removal: A random fraction of the documents are removed.
-
2.
Targeted removal of the most fact-rich documents: A fraction of documents are removed in order of decreasing degree.
-
3.
Targeted Removal of the documents with highest betweenness: A fraction of documents are removed in order of their betweenness in the network.
-
4.
Website Removal: All documents hosted by a particular site are removed (simulating a particular host being down).
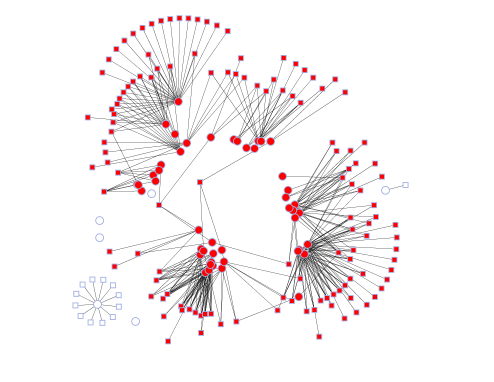
The melanoma scatter network proves to be quite resilient to random node removal. Fifty percent of the documents may be removed with no or only one fact becoming detached from the network. Even when ninety percent of the documents are missing, most of the facts stay connected through a few surviving fact-rich pages. The most vulnerable subtopic is that of determining the stage of a melanoma case, since there are few documents containing those facts, and if they fall among those that are removed, all the facts in the subtopic may be disconnected not only from the rest of the network, but from each other as well.
 |
 |
| (a) 40% webpages removed | (b) 50% webpages removed |
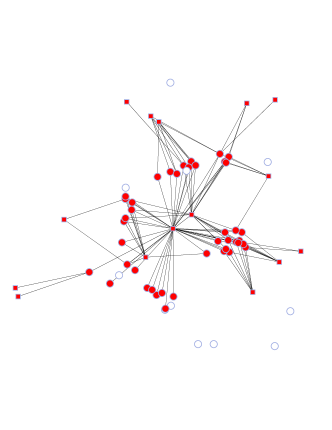
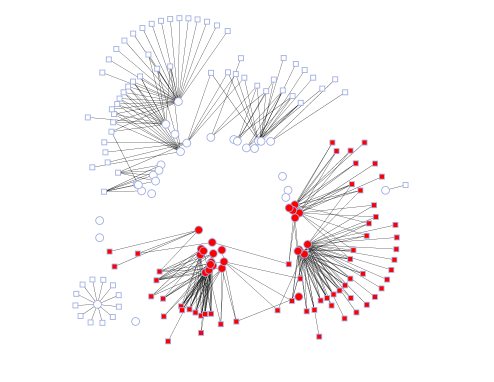
As shown in Figure 13, targeted removal of the most fact-rich pages is obviously much more damaging than random removal. Whereas random removal required 90% of the documents to be removed in order to start disconnecting facts, this starts to occur after removing the top 40% of most fact-rich documents. By the time 50% of the pages are removed, most of the facts are disconnected from one another. In Section 3.2.5, we discussed how pages with high betweenness, in addition to usually mentioning many facts, also bridge different topics by including disparate facts that are not mentioned together in many or any other documents. Intuitively, one might expect that removing such bridges would have an even greater effect on the network than simply removing pages with many facts [16]. This is confirmed in Figure 14, which shows that facts start to become disconnected after approximately 34% of documents with the highest betweenness are removed. Most facts become disconnected after 40% of the pages are removed. Comparing this result with the targeted removal in the order of nodes’ degree, we can see that documents with higher betweenness are more important in the connectivity of the graph than ones with only more facts. This tells us that betweenness is more important to comprehensive searching. Referring back to the toy network in Figure 10, we note that the top two documents have the highest number of facts, but removing either one of them would not disconnect the network since their facts are replicated elsewhere. However, it is the bottom two documents, containing two facts a piece, that play a more important role of connecting the graph.
 |
 |
| (a) 35% webpages removed | (b) 40% webpages removed |
Finally, we simulate what would occur if one of the websites hosting the documents would disappear. We find that no removal of a single website causes any of the facts to become disconnected from the network. The one exception is that the fact that one should use body maps to mark the location of existing moles is found only on the site melanoma.com. All other facts are mentioned by documents hosted by at least two different sites. This is an encouraging result, for it means that if a site were to become unavailable temporarily due to a server problem or permanently due to an intentional decision, comprehensive information about the topic of melanoma would still be available online.
In conclusion, the melanoma scatter network is remarkably robust, showing much redundancy in fact coverage that makes the network resilient to both random failure and an intentional attack (which is unlikely to occur for medical subjects such as melanoma but may be an issue for more controversial topics subject to censorship). It would be interesting to examine in future work the robustness of other, sparser, networks corresponding to topics where facts are even more scattered.
4 Combining fact-page and hyperlink networks
So far we have only considered the scatter network consisting of pages and the facts they contain. We have argued that such a network may model a search process wherein a user discovers a new fact on one page and subsequently discovers other pages by searching for that one fact. However, the description would not be complete without considering how these pages are connected together via hyperlinks. Here we present only a preliminary analysis of the intersection of the scatter and hyperlink networks with the aim of answering the question of how complete the fact coverage is of both a random and smart web surfer. Because the webpages in the melanoma scatter data set described above were not cached electronically, we were unable to extract the hyperlinks between them. Instead, we repeated the procedure described in Section 2, just for queries relating to melanoma risk and prevention, and downloaded all pages matching those queries from 20 high quality sites. We then automatically extracted all the hyperlinks between those pages. Very few hyperlinks crossed different websites, and even fewer were deep links to specific content on melanoma risk and prevention. We therefore focused on links within just two websites, wikipedia.org and melanoma.com, each of which contained both many facts and a rich hyperlink structure between documents matching the query. The presence or absence of each of the 14 melanoma risk and prevention facts was manually determined.
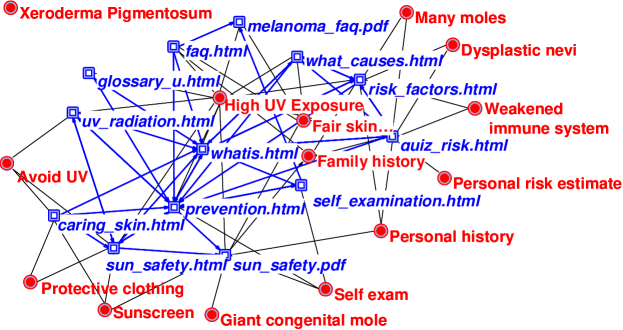
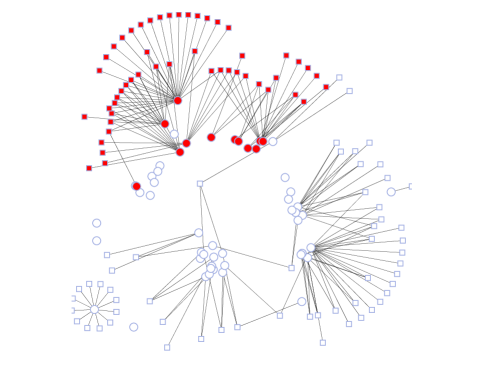
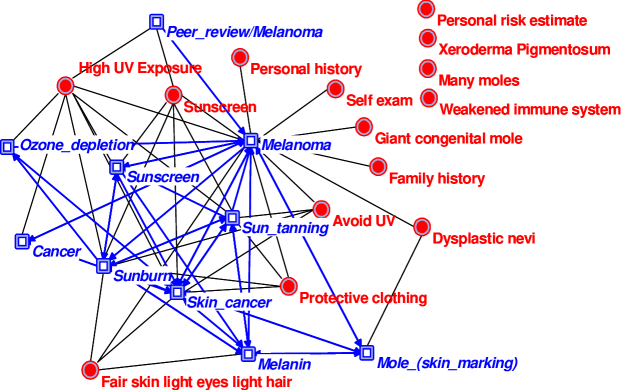
We visualized the overlapping network, showing directed hyperlinks between webpages containing at least one fact, and all the edges between the webpages and the facts they contain. Figure 15 shows the melanoma.com website, containing 36 matching pages, 14 of which contained at least one fact individually and 13 facts collectively. It is immediately apparent that the risk-focused pages tend to both share many facts and link directly to one another. The same is true of prevention pages, which link to one another and contain facts about how to protect against exposure to UV radiation. Finally, the two sets of webpages are themselves bridged by a smaller number of hyperlinks and by indirect links from general pages about melanoma. Our second example, shown in Figure 16 is that of the website en.wikipedia.org. Here we do not see a clear grouping of risk vs. prevention pages. Rather there is a fact-rich central “melanoma” page and closely linked pages on related medical conditions and sun exposure topics. There were 64 Wikipedia pages matching at least one of the queries, 13 of which were non-duplicate pages containing at least one fact. Altogether 10 of the 14 facts were mentioned in this set of heavily-interlinked Wikipedia pages.
Finally we are ready to evaluate how rapidly a user will read all the facts if they follow hyperlinks. We consider two conditions:
-
•
random walker: The user randomly lands on any one of the pages matching the queries within the website. He/she then continues to follow hyperlinks (restricted to the subset of matching webpages), avoiding backtracking to an already visited page, and jumping to another random search result if stuck.
-
•
smart surfer: The user lands on the most fact-rich page (the “melanoma” page on wikipedia.org and the “risk_factors.html” page on melanoma.com, which happened to be the # 1 or 2 results on both MSN search and Google search. From the best page, the user follows hyperlinks, but only those that point to pages containing at least one fact (we are assuming the web surfer can somehow sense which pages will contain facts). If they get stuck, they jump back to the ’best’ page and start again.
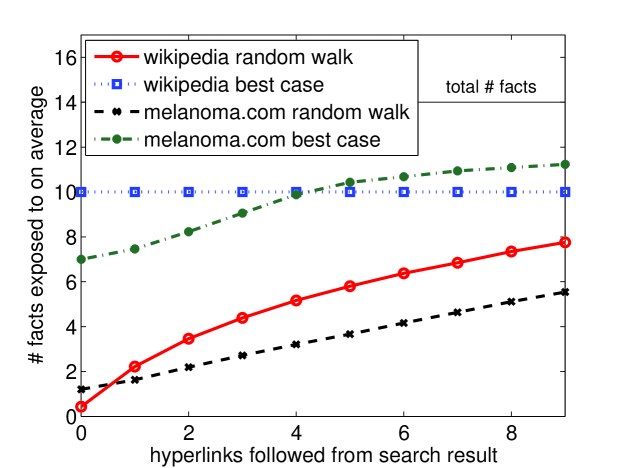
Figure 17 shows how many facts are discovered on average on both websites as a function of the number of hyperlinks followed (the 0th hyperlink is the search engine result that was initially selected). We observe that selecting the most fact-rich search result makes a very significant difference. Strikingly, visiting the main Wikipedia page about melanoma reveals all of the available facts on the site. But even by performing a random walk along hyperlinks starting at any Wikipedia page matching the query, a user is able to slowly discover facts. On the other hand, on melanoma.com, a user continues to discover additional facts even after the 10th step, eventually surpassing the number of facts available on Wikipedia. On both sites, the rich hyperlink structure allows users to explore the entire available fact space through browsing. This is of course, only a preliminary analysis, one we would like to repeat on a larger scale.
5 Conclusions and future work
In the above analysis we looked at information scatter through many different interwoven network properties. They all pointed to the importance of knowing how information comes together on the Web, and not just counting the number of facts in each page. We saw that assortativity has important implications for the ease with which a user can locate information simply by visiting pages with many facts. Assortativity also influenced the connectivity of the network, with disassortative networks (ones where a page with multiple facts tends to contain rarer ones) having larger connected components. Large connected components imply that a user could in principle discover information in a comprehensive manner by alternating between discovering new facts in pages and discovering new pages by searching for new facts online. However, the distance the user would need to traverse in this network is also important - facts which are proximate will co-occur in many of the same documents and so one will quickly be discovered along with the other. High co-occurrence implies clustering - groups of facts that appear together in many of the same webpages. We demonstrated that these clusters of facts may be discovered by using community finding algorithms. The automatically assigned groups closely correspond to expert assigned relationships between facts and topics. But where they diverge, we find that the “misclassified” facts are either bridging topics or are not “misclassified” at all. We also examined centrality of different documents in the topic space, and studied the effect of removing central webpages in terms of whether users would still be able to discover most of the facts through fact co-occurrence. For most methods, such as community discovery, we could use existing algorithms and metrics without modifications. For others, such as degree correlations and clustering, we adapted the definitions to fit the context.
In future work, we intend to extend our analysis to a range of domains by automating the extraction of keywords from pages and identifying which keywords occur in which pages. Furthermore we would like to apply our network analysis to improve search algorithms for the purpose of assisting users in finding comprehensive information. For example, scatter-hyperlink networks (of which examples are shown in Figures 15 and 16) provide a powerful representation for the design of future comprehensive search engines. Unlike current search engines which provide a ranked list of webpages but are agnostic to the scatter of facts about the topic across the webpages, future comprehensive search engines could provide a portfolio of pages that directly address information scatter. This portfolio of pages will not only collectively provide all the facts about the topic, but will also provide a subset of active hyperlinks on the pages which guide users to other pages which contain new facts. The portfolio of linked pages therefore will leverage the existing structure of links within a site and help users make sense of the information in the context of existing webpages and their link structure. The above search systems will take as input a general topic (e.g. melanoma risk/prevention) and then use cluster analysis techniques to identify common terms within relevant pages as a proxy for facts. A scatter-hyperlink network of the returned pages will then be constructed and analyzed to identify for instance term-rich pages with many hyperlinks to other pages with terms not contained in first page. Networks of facts and hyperlinks can therefore be combined to help users in the future not only to find highly scattered information, but also to rapidly make sense of it.
6 Acknowledgments
We would like to thank Dale Hunscher and Yan Qu for many insightful
discussions and Sameer Halai and Debbie Apsley for assistance in
collecting the data. We would also like to thank Yehuda Koren,
Stephen North, and Chris Volinsky for use of their network proximity
algorithm. This work was supported in part by an Accelerating Search
in Academic Research Grant from Microsoft.
References
- [1] L.A. Adamic. The small world web. In Proceedings of ECDL’99, Lecture Notes in Computer Science 1696, pages 443–452. Springer, 1999.
- [2] E. Adar. Guess: a language and interface for graph exploration. In CHI ’06, pages 791–800, New York, NY, USA, 2006. ACM Press.
- [3] R. Albert, A. Barabsi, and H. Jeong. Scale-free characteristics of random networks: The topology of the world wide web. Physica A, 281:69–77, 2000.
- [4] R. Albert, H. Jeong, and A.-L. Barabasi. Attack and error tolerance of complex networks. Nature, 406:378, 2000.
- [5] D. L. Anderson and L. Li. Diversity of graphs with highly variable connectivity. PRE, 75:046102, 2007.
- [6] M. J. Bates. Speculations on browsing, directed searching, and linking in relation to the bradford distribution. Proc. of CoLIS 4, pages 137–150, 2002.
- [7] S. K. Bhavnani. Why is it difficult to find comprehensive information? implications of information scatter for search and design. JASIST, 56(9):989–1003, 2005.
- [8] S. K. Bhavnani and L. A. Adamic. Making sense of information scatter on the web. Human-Computer Interaction Consortium, February 2007.
- [9] S. K. Bhavnani, C. K. Bichakjian, T. M. Johnson, R. J. Little, F. A. Peck, J. L. Schwartz, and V. J. Strecher. Strategy hubs: Domain portals to help find comprehensive information. JASIST, 57(1):4–24, 2006.
- [10] S. C. Bradford. Documentation. Crosby Lockwood, 1948.
- [11] A. Broder, R. Kumar, F. Maghoul, P. Raghavan, S. Rajagopalan, R. Stata, A. Tomkins, and J. Wiener. Graph structure in the web. Comput. Networks, 33(1-6):309–320, 2000.
- [12] A. Clauset, M. E. J. Newman, and C. Moore. Finding community structure in very large networks. Phys. Rev. E, 70:066111, 2004.
- [13] L. Donetti, P. I. Hurtado, and M. A. Munoz. Entangled networks, synchronization, and optimal network topology. Physical Review Letters, 95(18):188701, 2005.
- [14] L. Freeman. A set of measures of centrality based on betweenness. Sociometry, 40:35–41, 1977.
- [15] K-I. Goh, E. Oh, H. Jeong, B. Kahng, and D. Kim. Classification of scale-free networks. PNAS, 99(20):12583–12588, 2002.
- [16] P. Holme, B. J. Kim, C. N. Yoon, and S. K. Han. Attack vulnerability of complex networks. Phys. Rev. E, 65(5):056109, May 2002.
- [17] P. Holme and J. Zhao. Exploring the assortativity-clustering space of a network s degree sequence. Physical Review E, 75:046111, 2007.
- [18] W. W. Hood and C. S. Wilson. The scatter of documents over databases in different subject domains: how many databases are needed? J. Am. Soc. Inf. Sci. Technol., 52(14):1242–1254, 2001.
- [19] H. Jeong, S. P. Mason, A. L. Barabasi, and Z. N. Oltvai. Lethality and centrality in protein networks. Nature, 411:41–42, May 2001. 10.1038/35075138.
- [20] J. M. Kleinberg. Authoritative sources in a hyperlinked environment. In Proceedings of the ACM-SIAM Symposium on Discrete Algorithms, pages 668–677, 1998.
- [21] Y. Koren, S. C. North, and C. Volinsky. Measuring and extracting proximity in networks. In KDD ’06, pages 245–255, New York, NY, USA, 2006.
- [22] F. W. Lancaster and J-L. Lee. Bibliometric techniques applied to issue management: A case study. JASIST, 36(6):389–397, 1985.
- [23] P. G. Lind, M. C. Gonzalez, and H. J. Herrmann. Cycles and clustering in bipartite networks. Physical Review E (Statistical, Nonlinear, and Soft Matter Physics), 72(5):056127, 2005.
- [24] S. Maslov and K. Sneppen. Specificity and Stability in Topology of Protein Networks. Science, 296(5569):910–913, 2002.
- [25] S. Maslov, K. Sneppen, and A. Zaliznyak. Detection of topological patterns in complex networks: correlation profile of the internet. Physica A, 333:529–540, 2004.
- [26] S. Milgram. The small-world problem. Psychology Today, 1:62–67, 1967.
- [27] M. E. J. Newman. The structure and function of complex networks. SIAM Review, 45(2):167–256, 2003.
- [28] M. E. J. Newman, S. H. Strogatz, and D. J. Watts. Random graphs with arbitrary degree distribution and their applications. Phys. Rev. E, 64:026118, 2001.
- [29] P. Over. Trec-6 interactive track report. In E. M. Voorhees and D. K. Harman, editors, NIST Special Publication 500-242: The Seventh Text Retrieval Conference. 1998.
- [30] L. Page, S. Brin, R. Motwani, and T. Winograd. The pagerank citation ranking: Bringing order to the web. Technical report, Stanford Digital Library Technologies Project, 1998.
- [31] R. Pastor-Satorras, A. Vázquez, and A. Vespignani. Dynamical and correlation properties of the internet. Physical Review Letters, 87(25):258701, 2001.
- [32] F. A. Peck, S. K. Bhavnani, M. H. Blackmon, and D. R. Radev. Exploring the use of natural language systems for fact identification: Towards the automatic construction of healthcare portals. Proceedings of the American Society for Information Science and Technology, 41(1):327–338, 2004.
- [33] J. J. Ramasco, S. N. Dorogovtsev, and R. Pastor-Satorras. Self-organization of collaboration networks. Physical Review E (Statistical, Nonlinear, and Soft Matter Physics), 70(3):036106, 2004.
- [34] M. P. Stumpf, C. Wiuf, and R. M. May. Subnets of scale-free networks are not scale-free: sampling properties of networks. Proc Natl Acad Sci U S A, 102(12):4221–4224, March 2005.
- [35] C. Tenopir. Evaluation of database coverage: A comparison of two methodologies. Online Review, 6:423–441, 1982.
- [36] D. J. Watts and S. Strogatz. Collective dynamics of small world networks. Nature, 393:440–442, 1998.
- [37] G. K Zipf. Human behavior and the principle of least effort. Addison-Wesley, Cambridge, MA, 1949.