EUROPEAN ORGANIZATION FOR NUCLEAR RESEARCH
CERN-OPEN-2006-065
November 20, 2006
Quantitative Analysis of the
Publishing Landscape in High-Energy Physics
Salvatore Mele111Corresponding author: Salvatore.Mele@cern.ch,222On leave of absence from INFN, Napoli, Italy, David Dallman, Jens Vigen, Joanne Yeomans
CERN, CH-1211, Genève 23, Switzerland
Abstract
World-wide collaboration in high-energy physics (HEP) is a tradition which dates back several decades, with scientific publications mostly coauthored by scientists from different countries. This coauthorship phenomenon makes it difficult to identify precisely the “share” of each country in HEP scientific production. One year’s worth of HEP scientific articles published in peer-reviewed journals is analysed and their authors are uniquely assigned to countries. This method allows the first correct estimation on a pro rata basis of the share of HEP scientific publishing among several countries and institutions. The results provide an interesting insight into the geographical collaborative patterns of the HEP community. The HEP publishing landscape is further analysed to provide information on the journals favoured by the HEP community and on the geographical variation of their author bases. These results provide quantitative input to the ongoing debate on the possible transition of HEP publishing to an Open Access model.
1 Introduction
High-energy physics (HEP) is commonly regarded as one of the most international and collaborative scientific disciplines. Over the last six decades, large experiments at accelerators of ever-increasing energy brought together first dozens, then hundreds and now thousands of scientists from an increasingly wider spectrum of countries. Furthermore, theoretical HEP predates by a long time present-day cross-border communication as a truly global enterprise. This endeavour was fostered by a long-standing tradition of scientific exchange, regular gatherings and long-term visits to several major centres of attraction by scientists.
As a consequence of this well-established and thriving cross-border tradition, coauthorship of HEP articles by scientists affiliated to institutes in different countries is the norm rather than the exception. At the same time this coauthorship phenomenon complicates bibliometric studies aimed at evaluating the relative contributions of different countries to the production of HEP articles.
This article presents an analysis of the distribution of HEP authorship over several countries and institutes, taking into account the coauthorship phenomenon on a pro rata basis. This analysis is based on one year’s worth of HEP articles, selected as presented in Section 2. Section 3 explains the data-analysis procedure and discusses some bibliometric results. Results on the geographical distribution of HEP authorship are presented in Section 4 and then interpreted in Section 5 in terms of global collaborative patterns. The publishing landscape is investigated in Section 6, which identifies the journals most used by HEP authors. Section 7 presents additional results on the breakdown of the author base of the leading HEP journals among different countries; the distribution over different journals of the HEP scientific production of several countries and institutes is also discussed.
These results are particularly relevant as they constitute a quantitative basis for the ongoing debate on the possible transition of HEP publishing to an Open Access model [1]. No assessment of the economical implications of such a transition is possible without clear and uncontroversial data on the contributions of different countries to HEP scientific publishing, which is presented here for the first time.
2 Data Sample
The preprint culture in HEP pioneered the free distribution of scientific results. For decades, theoretical physicists and scientific collaborations, eager to disseminate their findings in a way faster than the distribution of scholarly publications, printed and mailed hundreds, even thousands, of copies of their manuscripts before submitting them to peer-reviewed journals. This preprint culture tended, however, to favour the large laboratories and universities that could afford mailing large numbers of preprints while receiving comprehensive regular mailings [2]. The spread of the Internet and the inception of the arXiv repository [3] ushered a new era for the preprint culture, offering all scientists a level playing field. In its current implementation, arXiv allows researchers to submit their preprints and browse or receive regular feeds on recent submissions in their area of interest [4]. The arXiv repository and its mirrors collect the corpus of HEP articles, classified into four categories:
-
•
hep-ex, for high energy experimental physics;
-
•
hep-lat for studies of lattice field theory;
-
•
hep-ph for particle phenomenology;
-
•
hep-th for string, conformal and field theory.
The attribution of articles to a particular category is performed by the authors themselves at submission time. The system supports cross referencing while multiple submission is frowned upon so that no double counting of the same article from two categories is expected in the following analysis.
This analysis is based on all preprints submitted to arXiv in the year 2005 and classified in one of the four HEP categories. Owing to its widespread preprint culture, this sample represents a faithful snapshot of HEP peer-reviewed scientific literature.
As in many other disciplines, HEP results are often presented in preliminary form at international conferences or workshops before being officially released in the form of a publication in a peer-reviewed journal. Results are then often summarised at other conferences in the following years. Preprints usually appear describing these conference contributions and therefore arXiv stores multiple, albeit different, entries corresponding to different phases of the life-cycle of a scientific result. To avoid this form of multiple counting of the same piece of work, the following analysis is restricted to preprints subsequently published in peer-reviewed journals. This requirement also removes lecture notes, theses and other unpublished material submitted to arXiv but not relevant for this analysis.
The data on which this analysis is based are extracted from the SPIRES database [5] hosted at SLAC, the Stanford Linear Accelerator Center in California, and jointly compiled together with DESY, the Deutsches Elektronen-Synchrotron in Hamburg, and FNAL, the Fermi National Accelerator Laboratory in Illinois. This database is chosen as it has a complete coverage of the HEP articles in arXiv and in addition includes publication information. As an example, the sample of preprints submitted to the hep-ex category in arXiv during 2005, and subsequently published, is obtained with the following query:
FIND EPRINT HEP-EX/05# AND PS P AND NOT TYPE C
AND NOT TYPE L AND NOT TYPE B AND NOT TYPE T
Conference articles, lecture notes, theses and books are explicitly removed from the search. The samples for the other three arXiv categories are obtained mutatis mutandis.
| hep-ex | hep-lat | hep-ph | hep-th | Total | |||||||||||
| Year | |||||||||||||||
| 2005 | 854 | 338 | 40% | 663 | 246 | 37% | 3918 | 2207 | 56% | 3238 | 2225 | 69% | 8673 | 5016 | 58% |
| 2004 | 885 | 349 | 39% | 586 | 261 | 45% | 4138 | 2534 | 61% | 3357 | 2361 | 70% | 8966 | 5505 | 61% |
| 2003 | 771 | 287 | 37% | 575 | 227 | 39% | 3964 | 2381 | 60% | 3275 | 2428 | 74% | 8585 | 5323 | 62% |
| 2002 | 885 | 293 | 33% | 583 | 218 | 37% | 4245 | 2383 | 56% | 3333 | 2482 | 74% | 9046 | 5376 | 59% |
| 2001 | 819 | 328 | 40% | 574 | 218 | 38% | 4228 | 2499 | 59% | 3181 | 2305 | 72% | 8802 | 5350 | 61% |
| 2000 | 735 | 324 | 44% | 508 | 235 | 46% | 4124 | 2390 | 58% | 3144 | 2259 | 72% | 8511 | 5208 | 61% |
| 1999 | 666 | 317 | 48% | 588 | 244 | 41% | 4076 | 2602 | 64% | 2825 | 2180 | 77% | 8155 | 5343 | 66% |
| 1998 | 406 | 231 | 57% | 623 | 282 | 45% | 3807 | 2442 | 64% | 2774 | 2061 | 74% | 7610 | 5016 | 66% |
| 1997 | 325 | 192 | 59% | 548 | 227 | 41% | 3615 | 2305 | 64% | 2865 | 1990 | 69% | 7353 | 4714 | 64% |
| 1996 | 166 | 82 | 49% | 558 | 248 | 44% | 3327 | 2149 | 65% | 2626 | 1924 | 73% | 6677 | 4403 | 66% |
| 1995 | 158 | 99 | 63% | 437 | 228 | 52% | 2990 | 2008 | 67% | 2347 | 1704 | 73% | 5932 | 4039 | 68% |
| 1994 | 67 | 35 | 52% | 447 | 202 | 45% | 2500 | 1714 | 69% | 2349 | 1639 | 70% | 5363 | 3590 | 67% |
| 1993 | 374 | 209 | 56% | 1762 | 1275 | 72% | 2084 | 1460 | 70% | 4220 | 2944 | 70% | |||
| 1992 | 321 | 180 | 56% | 755 | 559 | 74% | 1378 | 1080 | 78% | 2454 | 1819 | 74% | |||
| 1991 | 4 | 3 | 75% | 302 | 228 | 75% | 306 | 231 | 75% | ||||||
3 Data Analysis
Table 1 presents the numbers of hits obtained by the SPIRES query in the four categories and their sum for the year 2005 as well as the entire historical record. A total of 5016 articles are selected for the year 2005. The total numbers of submissions for each arXiv category obtained with queries such as:
FIND EPRINT HEP-EX/05#
are also presented in Table 1 together with their sum. The difference with the sample considered in this article is composed of conference articles and unpublished material. The ratios of the numbers of published articles to the numbers of arXiv submissions is also presented in Table 1.
The historical evolution of the numbers in Table 1 is interesting: early years show a gradual increase in the number of submissions, consistent with the gradual adoption of the system, while numbers for later years are consistent with a plateau structure with year-to-year variations of a few percentage points.
The queries on which this article is based were performed in the second half of October 2006 and one could argue that some preprints submitted in late 2005 could have still been in the editorial process and would not therefore have yet appeared in peer-reviewed journals. If the five-year period is used to predict the number of articles extracted by the query for the year 2005, this is just 6% above the number actually observed, leading to the conclusion that no large systematic bias affects the size of the sample under consideration. There are no reasons to believe that any sizable systematic effect from a small fraction of “undiscovered” articles would affect the relative contributions of different countries presented in the following.
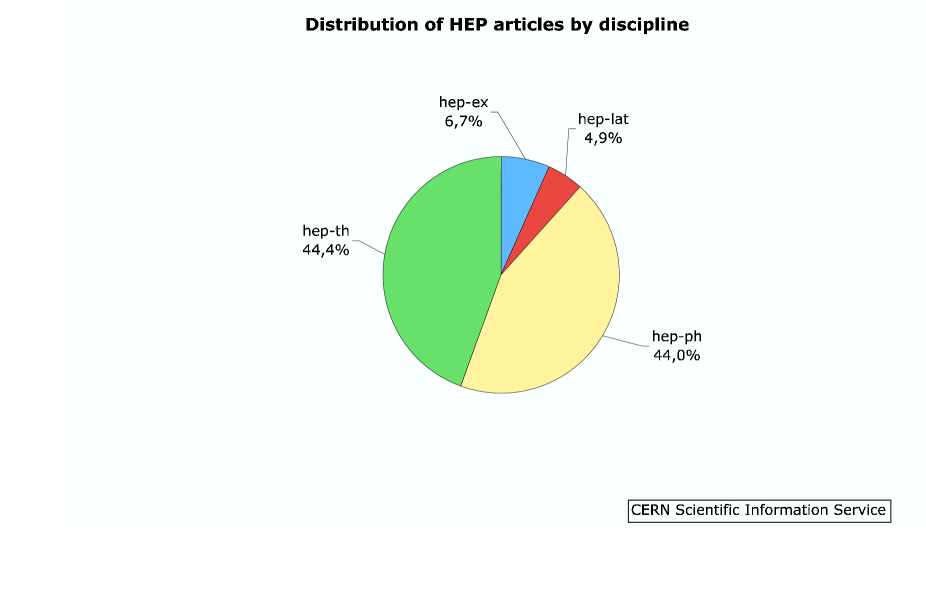
Figure 1 presents the distribution among the four different arXiv categories of the 5016 articles on which this analysis is based. Experimental results account for just 6.7% of the total.
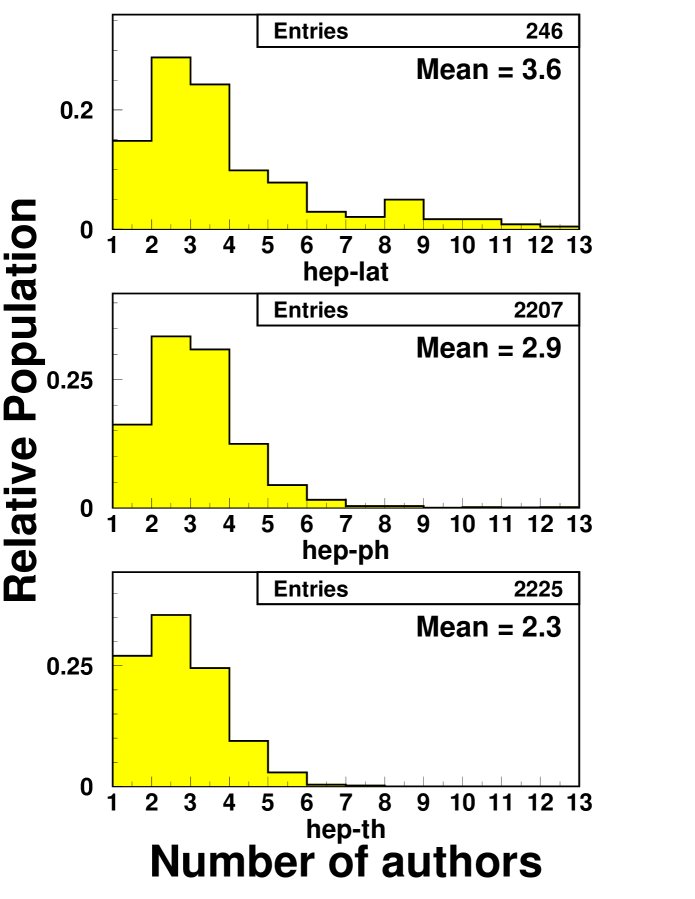
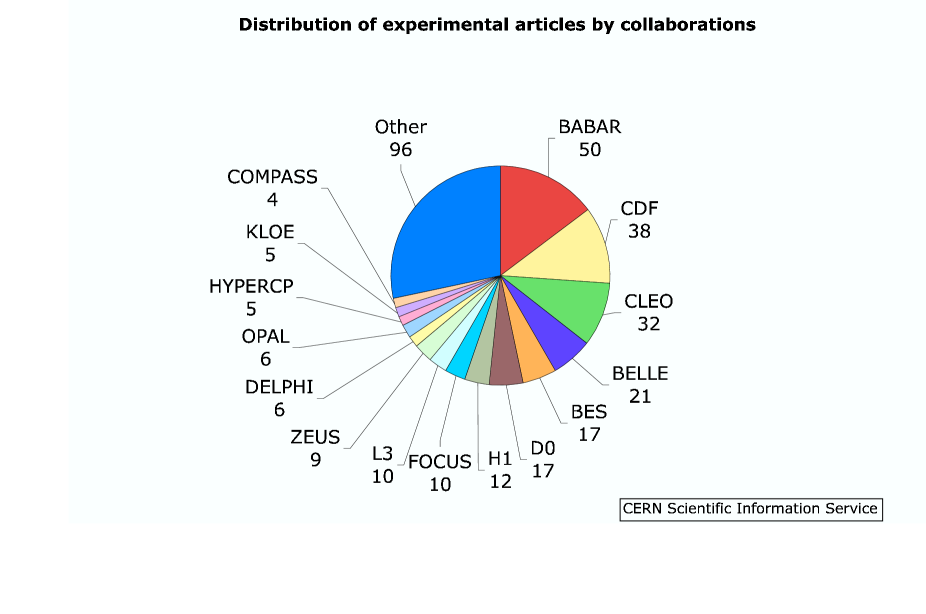
A first bibliometric result extracted from this study is the distribution of the number of authors per article. Figure 2 presents the distribution of the number of authors of each article in the three non-experimental classes hep-lat, hep-ph and hep-th. The average number of authors for the three classes are 3.6, 2.9 and 2.3, respectively. The average number of authors for the sum of the three classes is 2.6. The average number of authors for the hep-ex class is about 290. The distribution of the number of authors is biased by the fact that a dozen large experimental collaborations appear several times in the data sample. The breakdown of the considered arXiv:hep-ex sample into different experiments is shown in Figure 3. Implications of the large number of authors in experimental collaborations are discussed in Reference [6].
Unfortunately, as of today, no database allows an automatic extraction of bibliographic information concerning author affiliations for HEP articles at the level needed for this analysis. Therefore each article satisfying the query had to be inspected to perform a manual classification of the authors according to their affiliation. The output format of SPIRES partly alleviates this problem as author affiliations are often readable off the standard web-based output of the queries without having to access the article metadata on a publisher’s web site or the full-text version in arXiv. Author affiliations were classified into 22 classes, listed in the first column of Table 2. European, American and Asian countries are singled out according to their contribution to the global HEP scientific production, down to a lower limit of about 1%. The contribution from CERN, the world’s largest HEP laboratory, is shown separately. The remaining countries are divided into two classes: CERN Member States333CERN Member States not already listed in the first column of Table 2 are: Austria, Belgium, Bulgaria, the Czech Republic, Denmark, Finland, Greece, Hungary, Norway, Poland and the Slovak Republic. and the remaining countries. As the vast majority of HEP in Italy is funded by INFN, the Istituto Nazionale di Fisica Nucleare, its contribution has been considered in lieu of the Italian one. Italian authors without an INFN affiliation are counted in the “Other Member States” category.
As mentioned above, medium- and long-term visits of authors to different institutes and major laboratories is the staple diet of the HEP collaborative soul. As a consequence, authors of HEP articles often have multiple affiliations. Three principles to assign authors with multiple affiliations to a single class are followed in the order they are presented below.
-
1.
If one of the multiple affiliations of an author is a HEP laboratory, the author is assigned to that laboratory in the case of CERN, or to the host nation of the laboratory in the other cases.
-
2.
If only one of the multiple affiliations of an author corresponds to one of the countries explicitly singled out for the analysis, the author is assigned to that country.
-
3.
If more than one of the multiple affiliations of an author corresponds to one of the countries explicitly singled out for the analysis, the author is assigned to a country or institution, according to an indicator which takes into account their pro-capita Gross Domestic Product and their expected share of the HEP scientific production.
4 Distribution of the HEP Production by Country
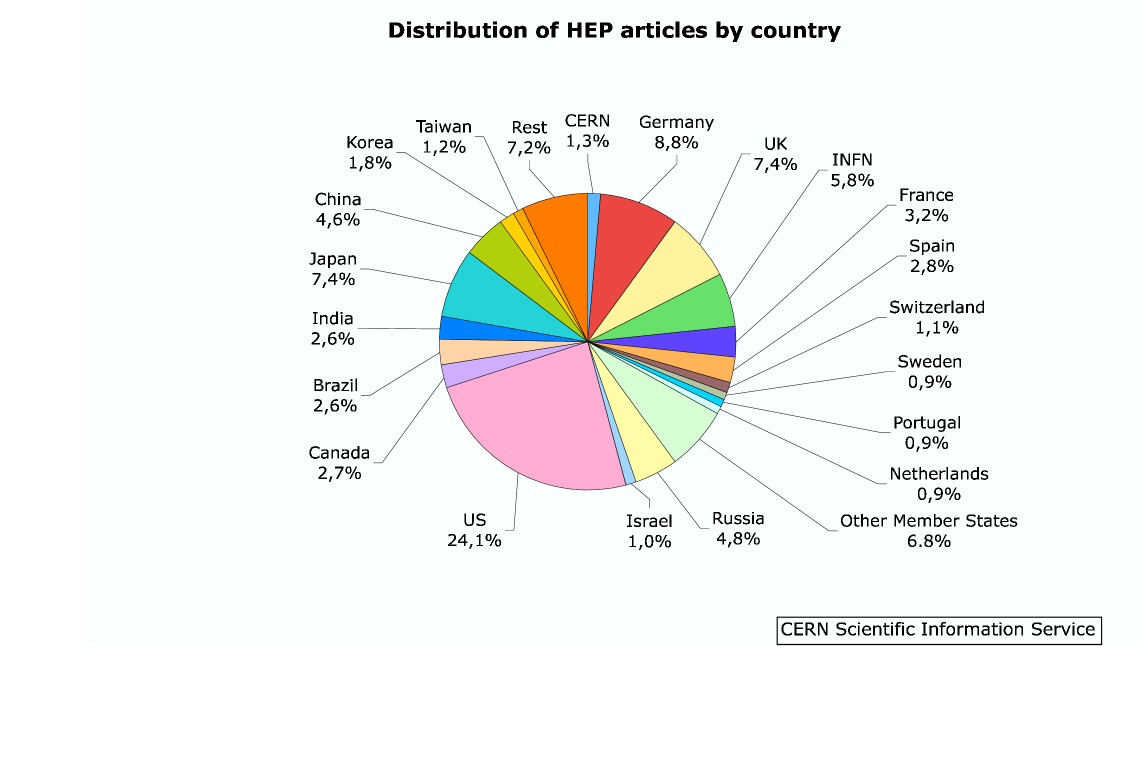
The first result of this analysis is the calculation of the share of HEP publications authored by each of the 22 countries and institutions into which the authors are classified. For each article in one of the four arXiv categories, each of the 22 countries and institutions is attributed a fraction of the article corresponding to the number of authors associated to that country, divided by the total number of authors. The sum of these fractions over all the articles of an arXiv category, divided by the total number of articles in that category, defines the share of a particular country or institution. The results are listed in Table 2 for the four arXiv categories as well as for their average. Figure 4 presents the distribution of the HEP scientific production over different countries. To our knowledge, this is the first result on the distribution of the HEP scientific literature by country where the phenomenon of coauthorship is taken into account.
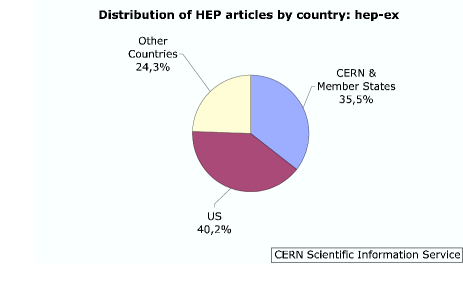
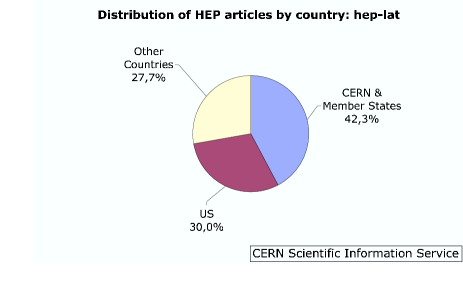
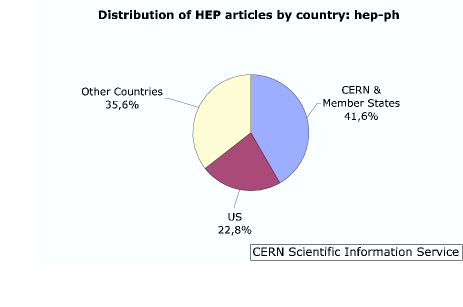
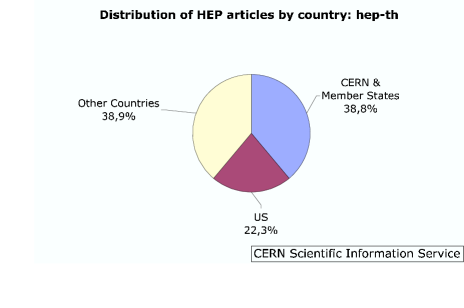
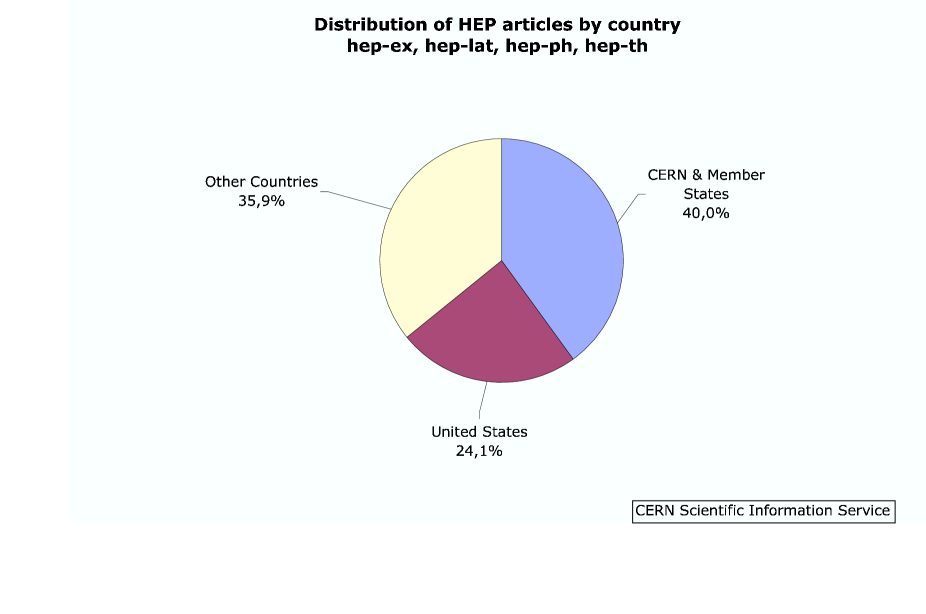
It is interesting to combine the results presented in Table 2 into the three largest sections of HEP authorship: CERN and its Member States, the United States, and the remaining countries. These results are presented in Table 3 for the four arXiv classes and their average. Figures 5 and 6 show a summary of the distributions of HEP authorship for the arXiv classes and their average, respectively.
| hep-ex | hep-lat | hep-ph | hep-th | Average | |
|---|---|---|---|---|---|
| CERN | 0.9% | 1.1% | 1.7% | 1.1% | 1.3% |
| Germany | 6.3% | 19.5% | 10.3% | 6.5% | 8.8% |
| UK | 6.4% | 6.3% | 6.6% | 8.5% | 7.4% |
| INFN | 11.0% | 5.8% | 5.6% | 5.3% | 5.8% |
| France | 4.1% | 2.0% | 3.3% | 3.2% | 3.2% |
| Spain | 0.8% | 1.2% | 3.5% | 2.6% | 2.8% |
| Switzerland | 1.2% | 1.1% | 1.2% | 0.9% | 1.1% |
| Sweden | 0.2% | 1.2% | 0.8% | 1.0% | 0.9% |
| Portugal | 0.3% | 0.5% | 1.4% | 0.5% | 0.9% |
| Netherlands | 0.6% | 0.5% | 0.5% | 1.4% | 0.9% |
| Other Member States | 3.5% | 3.3% | 6.7% | 7.9% | 6.8% |
| Russia | 5.1% | 3.5% | 5.6% | 4.0% | 4.8% |
| Israel | 0.3% | 0.8% | 0.9% | 1.3% | 1.0% |
| United States | 40.2% | 30.0% | 22.8% | 22.3% | 24.1% |
| Canada | 1.8% | 1.7% | 2.0% | 3.6% | 2.7% |
| Brazil | 0.7% | 0.8% | 1.9% | 3.8% | 2.6% |
| India | 0.4% | 2.0% | 2.7% | 3.0% | 2.6% |
| Japan | 6.3% | 9.2% | 6.4% | 8.4% | 7.4% |
| China | 6.4% | 2.3% | 6.6% | 2.6% | 4.6% |
| Korea | 1.1% | 0.2% | 1.8% | 2.0% | 1.8% |
| Taiwan | 1.1% | 0.5% | 1.6% | 0.8% | 1.2% |
| Other Countries | 1.1% | 6.5% | 6.0% | 9.3% | 7.2% |
| hep-ex | hep-lat | hep-ph | hep-th | Average | |
|---|---|---|---|---|---|
| CERN & Member States | 35.5% | 42.3% | 41.6% | 38.8% | 40.0% |
| United States | 40.2% | 30.0% | 22.8% | 22.3% | 24.1% |
| Other Countries | 24.3% | 27.7% | 35.6% | 38.9% | 35.9% |
 |
 |
 |
 |
5 Collaborative Patterns in HEP
The data sample under investigation allows a study of the collaborative patterns in HEP in order to answer a natural question: which groups of countries and institutions collaborate? A simplified approach to address this question is chosen, in which only three large groups of authors are considered, according to their affiliation to one of three sections of HEP authorship: CERN and its Member States, the United States, and the remaining countries. Results from more complex analyses of other data samples focusing on author-to-author collaborative networks are presented in Reference [7]. Each article is assigned to one of seven mutually-exclusive classes:
-
1.
all the authors are associated to CERN or any of its Member States;
-
2.
all the authors are associated to the United States;
-
3.
no authors are associated to CERN, its Member States or the United States;
-
4.
some authors are associated to CERN or one of its Member States and some to the United States, but none to any other country;
-
5.
some authors are associated to CERN or one of its Member States and some to other countries, but none to the United States;
-
6.
some authors are associated to the United States and some to other countries but none to CERN or any of its Member States;
-
7.
at least one author is associated to CERN or one of its Member States, one to the United States and one to some other country.
Figure 7 presents the fraction of HEP articles in each of these seven classes while Figure 8 shows the results for the four separate arXiv disciplines.
6 Distribution of HEP Publications among Journals
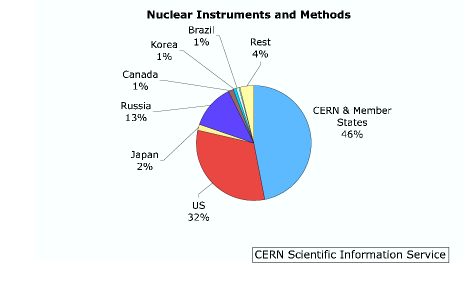
The 5016 articles considered in this study appeared in 89 different peer-reviewed journals. The distribution of articles over the different journals is presented in Table 4 for the four different HEP disciplines and their global average, which is also shown in Figure 9. Only the 11 journals with a share above 1% are considered in Table 4 and Figure 9. However, the share of Nuclear Instruments and Methods in Physics Research (NIM) is also singled out. The contribution to this journal is interesting as this title is the reference journal for instrumentation in HEP. The low share of this journal in the total is due to the reduced contribution of experimental HEP to the total production compared to the theoretical and phenomenological studies, as presented in Figure 1. However, the low percentage of instrumentation articles among the total amount of experimental articles, 2.7%, is also due to the far less widespread culture of self-archiving results in arXiv in the HEP instrumentation community. A direct inspection of articles published in NIM in 2005 revealed about 30% of articles of potential interest for HEP instrumentation which had not been submitted to arXiv, neither before nor after publication.


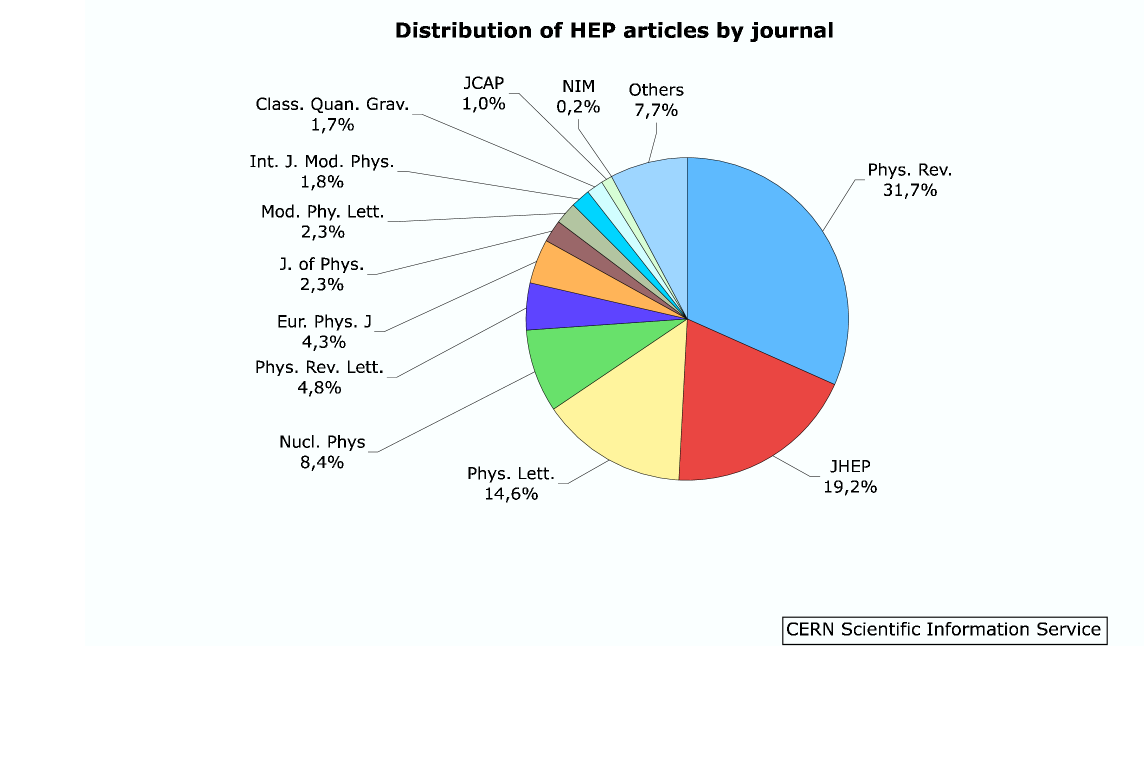
An analysis of the results in Table 4 shows that 83% of HEP articles are published in just six journals: Physical Review (A through E); Journal of High Energy Physics (JHEP); Physics Letters (A and B); Nuclear Physics (A and B); Physical Review Letters and the European Physical Journal (A and C).
| Journal | Publisher | hep-ex | hep-lat | hep-ph | hep-th | Average |
|---|---|---|---|---|---|---|
| Phys. Rev. | APS | 31.7% | 52.8% | 41.5% | 19.7% | 31.7% |
| JHEP | SISSA | 14.2% | 10.0% | 31.8% | 19.2% | |
| Phys. Lett. | Elsevier | 21.3% | 15.9% | 16.4% | 11.6% | 14.6% |
| Nucl. Phys. | Elsevier | 1.2% | 6.5% | 7.3% | 10.7% | 8.4% |
| Phys. Rev. Lett. | APS | 29.0% | 2.4% | 4.4% | 1.8% | 4.8% |
| Eur. Phys. J. | Springer | 10.7% | 2.0% | 7.0% | 1.0% | 4.3% |
| J. of Phys. | IOP | 0.8% | 2.1% | 3.1% | 2.3% | |
| Mod. Phys. Lett. | World Scientific | 1.2% | 0.8% | 2.3% | 2.6% | 2.3% |
| Int. J. Mod. Phys. | World Scientific | 0.3% | 1.6% | 1.4% | 2.3% | 1.8% |
| Class. Quan. Grav. | IOP | 0.1% | 3.8% | 1.7% | ||
| JCAP | SISSA | 1.0% | 1.3% | 1.0% | ||
| NIM | Elsevier | 2.7% | 0.1% | 0.2% | ||
| Others | 2.1% | 2.8% | 6.5% | 10.2% | 7.7% |
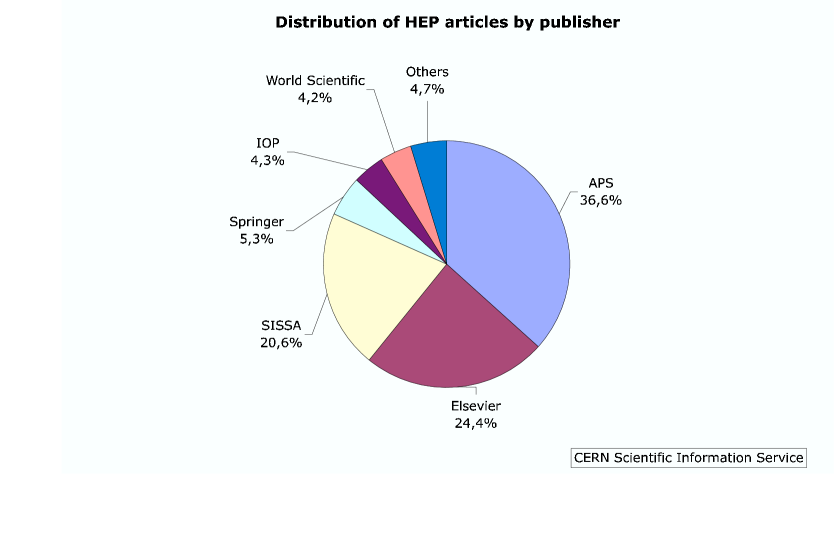
These six journals are published by just four publishers: the American Physical Society, Elsevier, SISSA and Springer, as detailed in Table 4. It is interesting to split the corpus of HEP scientific literature discussed in this article according to the publisher of the journal in which the article appeared. The results are presented in Figure 10. A total of 87% of HEP articles are published by the same four publishers listed above.
7 Geographical Analysis of HEP Journals
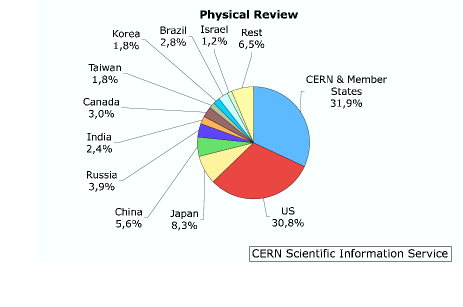
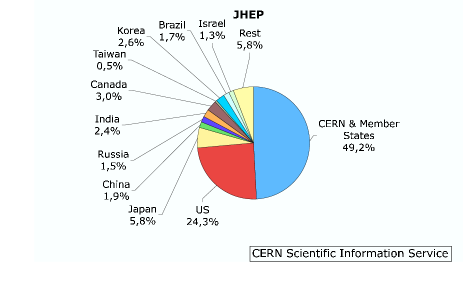
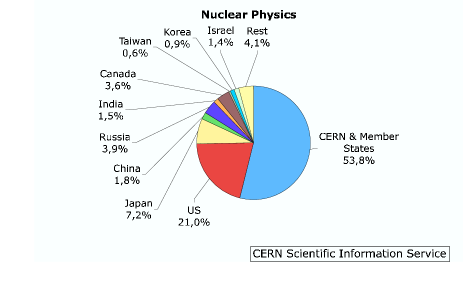
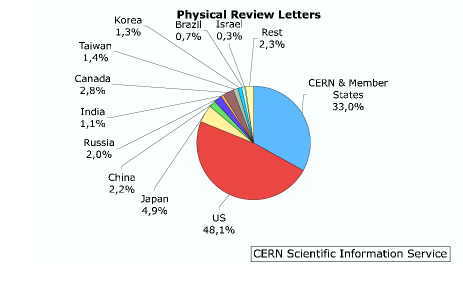
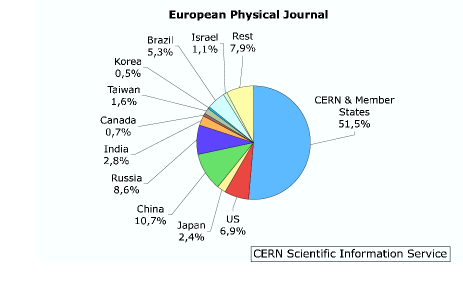
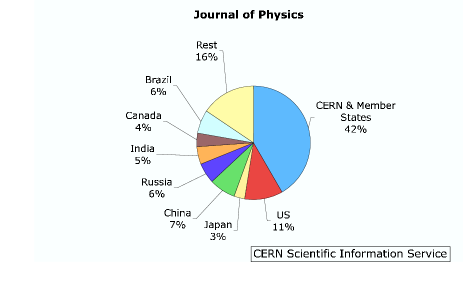
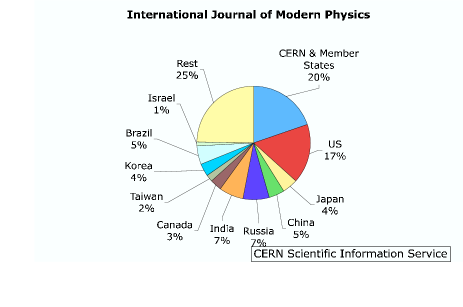
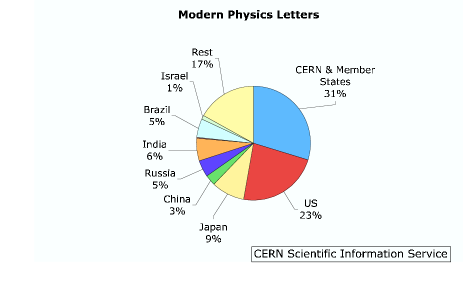
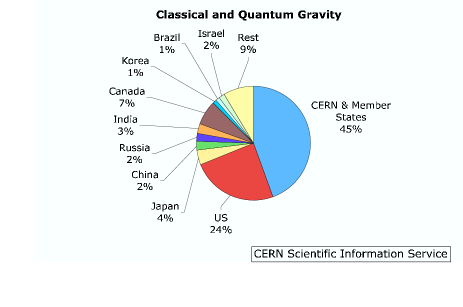
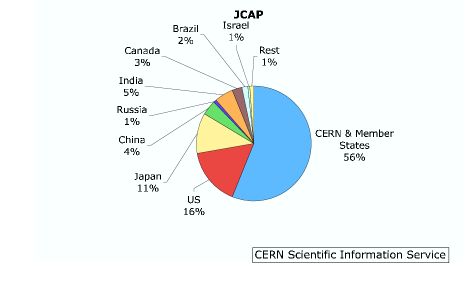
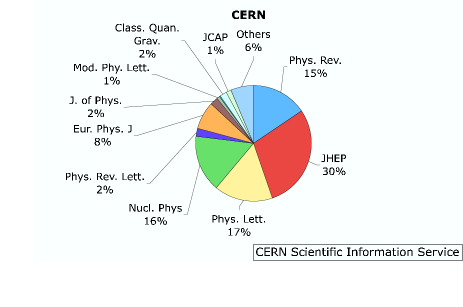
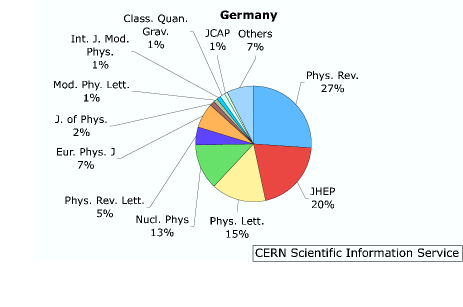
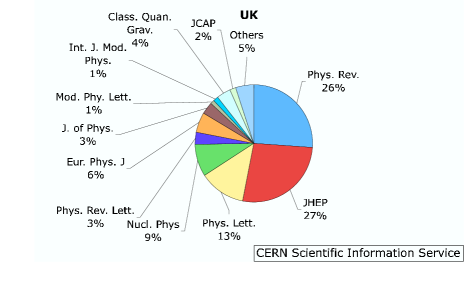
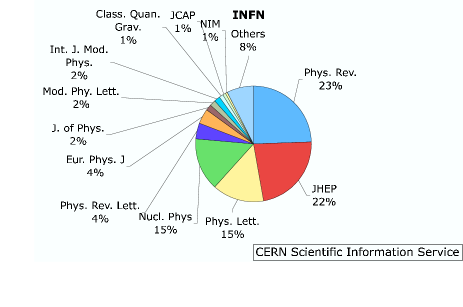
The quantitative information on the different countries and institutions contributing to each of the HEP articles considered in this analysis allows the estimation of the geographical distribution of the authors for each of the 12 journals listed in Table 4. The analysis of Section 4 is repeated for each journal and the results are presented in Table 5 for all 22 countries and institutions considered in this article, as well as their grouping into three sections: CERN and its Member States, the United States, and the remaining countries. Figures 11 and 12 present these results in graphical form, with the contributions from CERN and its Member States grouped.
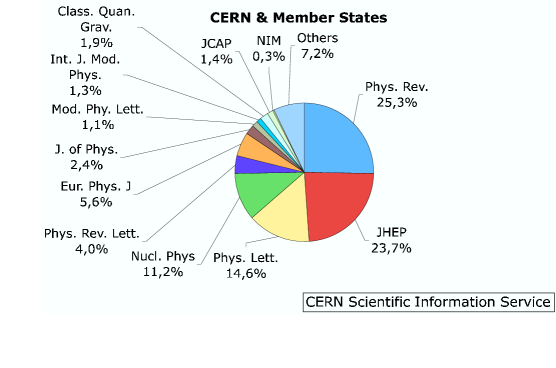
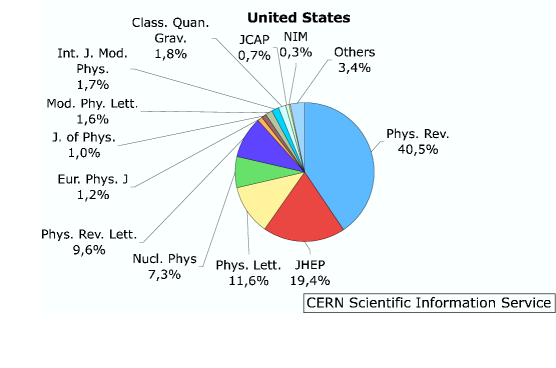
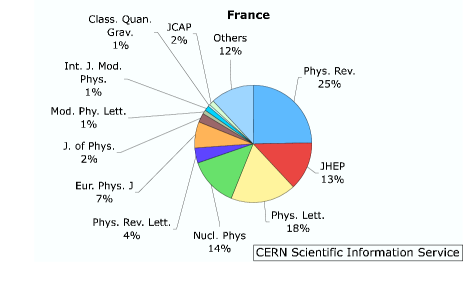
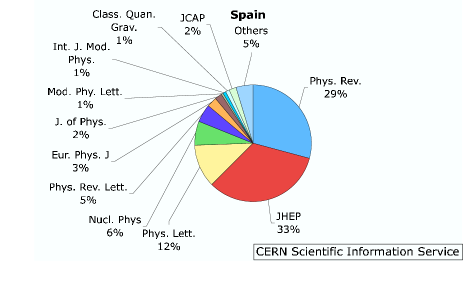
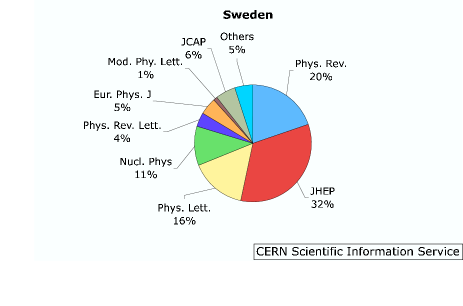
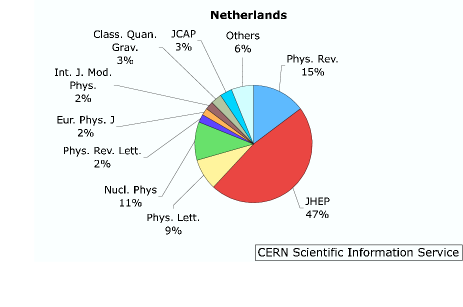
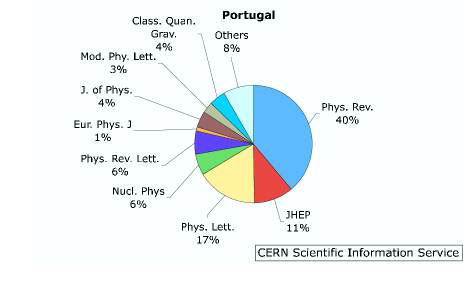
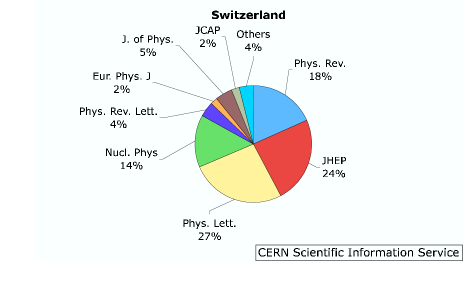
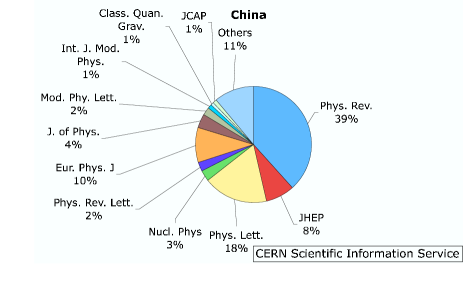
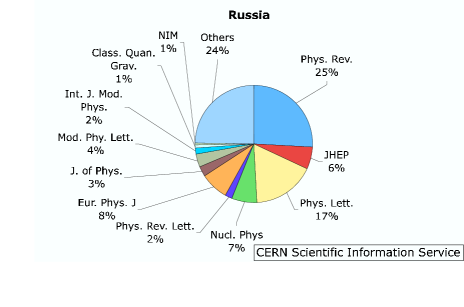
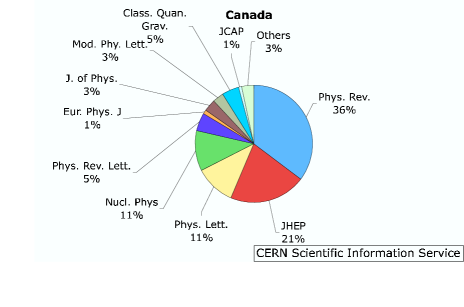
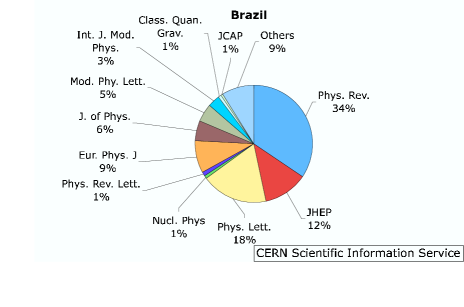
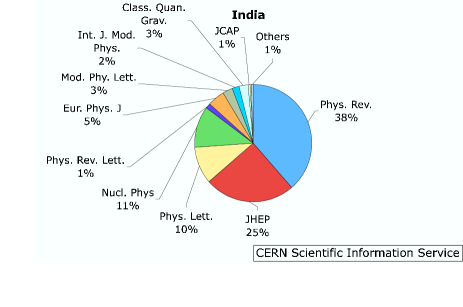
In addition to the geographical distribution of the authors for the major HEP journals, it is interesting to identify the most popular journals of the single countries and institutions considered in this analysis. To extract this information, all articles with at least one author from a given country or institution are first selected. Then, the fraction of authorship of this country or institution is calculated for each article. This fraction is assigned to the journal where the article appeared. The sum of all these fractions for each journal provides a score of the popularity of the journal. If the sum of these scores is used to measure the total HEP scientific production of the country, it can be used to normalise each score and obtain the fractions of the HEP production of the country in the different journals. The results of this study are presented in Table 6 for each of the 22 countries and institutions discussed in this article. The last three lines of Table 6 present the results summed over three groups: CERN and its Member States, the United States and the remaining countries. The results for these groups are presented in Figure 13. Figure 14 and 15 present results for some European countries and institutions and Figure 16 presents results for some of the remaining countries.
8 Conclusions, with a Note on Open Access
This article presents the results of the first bibliometric study of HEP publishing which accounts for the widespread phenomenon of coauthorship. The share of HEP scientific results published by several countries and institutions is correctly calculated and provides interesting insight into the collaborative patterns within the HEP community. The publishing landscape of HEP is further analysed to provide information on the journals most used by the HEP community and on the geographical distribution of their authors.
It is interesting to put these results into the wider context of a possible transition of HEP publishing to an Open Access model [1]. The finding that 83% of HEP articles are published in just six journals and that 87% of the articles appear in journals published by just four publishers is particularly interesting. It demonstrates that the number of partners to be engaged with in a debate on a change of the HEP publishing model is relatively small. The worldwide collaborative patterns in HEP, which are quantified in this article, suggest that once a limited number of countries embrace an Open Access publishing model, a “domino effect” likely to spread this policy to other countries, through coauthorship links. Last, but not least, the assessment of the relative contribution to the worldwide production of HEP scientific results which takes into account the coauthorship phenomenon, presented in Table 2 and Figure 4, might constitute the basis for a model where each country or institution would contribute with their “fair share” towards the financial cost of Open Access publishing.
Acknowledgments
The idea behind this analysis came up in many discussions with Rüdiger Voss and Gigi Rolandi on the topic of Open Access. We are indebted to Sandrine Reyes and Susanne Schäfer for their help in the compilation of the data set and to our colleagues at SLAC and elsewhere for maintaining and operating SPIRES.
References
-
[1]
R. Voss et al.,
Report of the Task Force on Open Access Publishing in Particle Physics, 2006.
http://cdsweb.cern.ch/search.py?recid=966160&ln=en -
[2]
L. Goldschmidt-Clermont, Communication Patterns in High-Energy Physics, 1965;
published in High Energy Physics Libraries Webzine, issue 6, March 2002.
http://library.cern.ch/HEPLW/6/papers/1/ -
[3]
P. Ginsparg, First Steps Towards Electronic
Research Communication Computers in Physics 8 (1994) 390.
Additional material can be found at http://people.ccmr.cornell.edu/~ginsparg/blurb/ - [4] http://arxiv.org
- [5] http://www.slac.stanford.edu/spires
-
[6]
H. Aihara et al., Report by the Working Group on Authorship in Large Scientific
Collaborations in Experimental High Energy Physics, IUPAP-C11,
2005.
http://www.iupap.org/commissions/c11/reports/WG_authorship_100105.pdf -
[7]
M.E.J. Newmann, The structure of scientific collaboration networks Proc. Nat. Acad. Sci. U.S.A. 98 (2001) 404
[arxiv:cond-mat/0007214];
X. Liu et al., Co-authorship networks in the digital library research community Information Processing & Management 41 (2005) 1462 [arxiv:cs.DL/0502056];
M.A. Rodriguez, A Multi-Graph to Support the Scholarly Communication [arxiv:cs.DL/0601121].
|
Phys. Rev. |
JHEP |
Phys. Lett. |
Nucl. Phys. |
Phys. Rev. Lett. |
Eur. Phys J. |
J. of Phys. |
Mod. Phys. Lett. |
Int. J. Mod. Phys. |
Class. Quan. Grav. |
JCAP |
NIM |
Others |
|
| CERN | 0.7% | 2.0% | 1.5% | 2.5% | 0.7% | 2.4% | 1.3% | 0.4% | 0.3% | 1.4% | 2.0% | 0.3% | 1.1% |
| Germany | 7.2% | 9.3% | 9.3% | 13.5% | 9.0% | 14.1% | 6.1% | 4.2% | 5.4% | 6.5% | 7.8% | 1.6% | 8.5% |
| UK | 6.1% | 10.4% | 6.5% | 7.8% | 5.1% | 9.8% | 10.6% | 3.5% | 5.1% | 16.6% | 12.6% | 16.0% | 4.4% |
| INFN | 4.5% | 6.9% | 5.8% | 10.3% | 5.4% | 5.4% | 4.6% | 4.0% | 5.3% | 4.3% | 4.4% | 14.6% | 5.7% |
| France | 2.5% | 2.3% | 4.0% | 5.3% | 2.8% | 5.4% | 3.4% | 1.7% | 2.2% | 1.0% | 4.8% | 3.0% | 5.0% |
| Spain | 2.6% | 4.8% | 2.3% | 2.2% | 2.9% | 1.8% | 2.3% | 0.9% | 1.0% | 1.8% | 5.3% | 0.2% | 1.8% |
| Switzerland | 0.6% | 1.3% | 1.9% | 1.8% | 0.9% | 0.5% | 2.2% | 2.3% | 0.2% | 0.5% | |||
| Sweden | 0.6% | 1.6% | 1.0% | 1.2% | 0.7% | 1.0% | 0.4% | 4.9% | 0.6% | ||||
| Portugal | 1.1% | 0.5% | 1.0% | 0.6% | 1.2% | 0.2% | 1.7% | 1.2% | 2.3% | 1.0% | |||
| Netherlands | 0.4% | 2.2% | 0.5% | 1.1% | 0.4% | 0.4% | 1.1% | 1.6% | 2.9% | 0.2% | 0.7% | ||
| Other M.S. | 5.6% | 7.9% | 6.1% | 7.6% | 4.0% | 10.4% | 9.6% | 3.5% | 9.3% | 9.0% | 9.0% | 10.9% | 8.1% |
| Russia | 3.9% | 1.5% | 5.7% | 3.9% | 2.0% | 8.6% | 5.7% | 7.4% | 4.9% | 2.3% | 0.8% | 12.6% | 15.2% |
| Israel | 1.2% | 1.3% | 0.7% | 1.4% | 0.3% | 1.1% | 1.2% | 1.1% | 1.5% | 0.7% | 0.2% | 0.1% | |
| United States | 30.8% | 24.3% | 19.2% | 21.0% | 48.1% | 6.9% | 10.8% | 16.8% | 23.0% | 24.4% | 16.3% | 31.7% | 10.8% |
| Canada | 3.0% | 3.0% | 2.0% | 3.6% | 2.8% | 0.7% | 3.9% | 3.4% | 0.3% | 7.1% | 2.6% | 1.4% | 1.0% |
| Brazil | 2.8% | 1.7% | 3.3% | 0.2% | 0.7% | 5.3% | 6.4% | 5.4% | 5.1% | 1.1% | 1.8% | 1.0% | 3.0% |
| Japan | 8.3% | 5.8% | 7.9% | 7.2% | 4.9% | 2.4% | 3.1% | 4.3% | 9.4% | 4.2% | 11.3% | 1.6% | 13.6% |
| China | 5.6% | 1.9% | 5.8% | 1.8% | 2.2% | 10.7% | 7.5% | 4.6% | 3.0% | 2.3% | 4.1% | 6.8% | |
| India | 2.4% | 2.4% | 3.6% | 1.5% | 1.1% | 2.8% | 5.2% | 7.0% | 6.3% | 2.7% | 5.4% | 1.7% | |
| Taiwan | 1.8% | 0.5% | 1.5% | 0.6% | 1.4% | 1.6% | 1.7% | 0.8% | |||||
| Korea | 1.8% | 2.6% | 2.6% | 0.9% | 1.3% | 0.5% | 3.6% | 1.1% | 0.7% | 0.8% | |||
| Other Countries | 6.5% | 5.8% | 7.8% | 4.1% | 2.3% | 7.9% | 15.7% | 24.6% | 17.0% | 8.6% | 1.0% | 3.8% | 8.9% |
| Total | 100% | 100% | 100% | 100% | 100% | 100% | 100% | 100% | 100% | 100% | 100% | 100% | 100% |
| CERN & | |||||||||||||
| Member States | 31.9% | 49.2% | 40.1% | 53.8% | 33.0% | 51.5% | 41.7% | 19.9% | 29.7% | 44.5% | 56.0% | 47.0% | 37.3% |
| United States | 30.8% | 24.3% | 19.2% | 21.0% | 48.1% | 6.9% | 10.8% | 16.8% | 23.0% | 24.4% | 16.3% | 31.7% | 10.8% |
| Other Countries | 37.3% | 26.4% | 40.7% | 25.2% | 18.9% | 41.6% | 47.5% | 63.3% | 47.3% | 31.0% | 27.6% | 21.3% | 51.9% |
| Total | 100% | 100% | 100% | 100% | 100% | 100% | 100% | 100% | 100% | 100% | 100% | 100% | 100% |
|
Phys. Rev. |
JHEP |
Phys. Lett. |
Nucl. Phys. |
Phys. Rev. Lett. |
Eur. Phys J. |
J. of Phys. |
Mod. Phys. Lett. |
Int. J. Mod. Phys. |
Class. Quan. Grav. |
JCAP |
NIM |
Others |
Total |
|
| CERN | 15.5% | 29.3% | 16.4% | 15.6% | 2.4% | 7.7% | 2.2% | 0.7% | 0.4% | 1.9% | 1.5% | 6.3% | 100% | |
| Germany | 26.1% | 20.4% | 15.4% | 12.8% | 4.9% | 6.9% | 1.6% | 1.1% | 1.1% | 1.3% | 0.9% | 7.5% | 100% | |
| UK | 26.2% | 27.0% | 12.8% | 8.8% | 3.3% | 5.7% | 3.3% | 1.1% | 1.2% | 3.9% | 1.7% | 0.5% | 4.5% | 100% |
| INFN | 24.4% | 22.7% | 14.6% | 14.7% | 4.4% | 4.0% | 1.8% | 1.6% | 1.6% | 1.3% | 0.8% | 0.5% | 7.5% | 100% |
| France | 24.7% | 13.4% | 18.2% | 13.5% | 4.1% | 7.2% | 2.4% | 1.2% | 1.2% | 0.5% | 1.5% | 0.2% | 11.8% | 100% |
| Spain | 29.1% | 33.3% | 12.2% | 6.5% | 5.0% | 2.8% | 1.9% | 0.7% | 0.7% | 1.1% | 1.9% | 4.8% | 100% | |
| Switzerland | 18.3% | 24.0% | 26.4% | 14.4% | 4.1% | 2.1% | 4.7% | 2.2% | 3.8% | 100% | ||||
| Sweden | 19.8% | 33.5% | 15.7% | 10.9% | 3.6% | 4.9% | 1.1% | 5.5% | 5.0% | 100% | ||||
| Portugal | 39.0% | 10.7% | 16.8% | 5.7% | 6.5% | 1.1% | 4.4% | 3.1% | 4.4% | 8.3% | 100% | |||
| Netherlands | 14.8% | 47.0% | 8.7% | 10.6% | 2.2% | 1.9% | 2.2% | 3.1% | 3.4% | 0.1% | 6.0% | 100% | ||
| Other M.S. | 26.2% | 22.2% | 13.0% | 9.3% | 2.8% | 6.6% | 3.2% | 1.2% | 2.4% | 2.3% | 1.3% | 0.4% | 9.1% | 100% |
| Russia | 25.8% | 6.1% | 17.3% | 6.8% | 2.0% | 7.8% | 2.8% | 3.6% | 1.8% | 0.8% | 0.2% | 0.6% | 24.4% | 100% |
| Israel | 38.5% | 25.2% | 10.2% | 11.4% | 1.4% | 4.8% | 2.6% | 1.9% | 2.6% | 0.6% | 0.1% | 0.7% | 100% | |
| United States | 40.5% | 19.4% | 11.6% | 7.3% | 9.6% | 1.2% | 1.0% | 1.6% | 1.7% | 1.8% | 0.7% | 0.3% | 3.4% | 100% |
| Canada | 35.2% | 21.3% | 10.9% | 11.2% | 5.1% | 1.1% | 3.4% | 2.9% | 0.2% | 4.6% | 1.0% | 0.1% | 3.0% | 100% |
| Brazil | 34.4% | 12.4% | 18.3% | 0.7% | 1.3% | 8.8% | 5.7% | 4.8% | 3.4% | 0.8% | 0.7% | 0.1% | 8.8% | 100% |
| Japan | 35.6% | 15.0% | 15.5% | 8.1% | 3.2% | 1.4% | 1.0% | 1.3% | 2.2% | 1.0% | 1.6% | 14.1% | 100% | |
| China | 38.4% | 7.9% | 18.1% | 3.3% | 2.3% | 10.0% | 3.7% | 2.3% | 1.1% | 0.9% | 0.9% | 11.2% | 100% | |
| India | 28.3% | 17.2% | 19.8% | 4.6% | 1.9% | 4.6% | 4.5% | 6.0% | 4.2% | 1.8% | 2.1% | 4.9% | 100% | |
| Taiwan | 48.0% | 8.8% | 18.3% | 4.6% | 5.6% | 6.1% | 3.4% | 5.1% | 100% | |||||
| Korea | 32.7% | 27.8% | 21.0% | 4.4% | 3.6% | 1.2% | 4.7% | 1.1% | 0.1% | 3.5% | 100% | |||
| Other Countries | 28.7% | 15.5% | 15.9% | 4.7% | 1.5% | 4.7% | 5.1% | 7.9% | 4.2% | 2.1% | 0.1% | 0.1% | 9.6% | 100% |
| CERN & | ||||||||||||||
| Member States | 25.3% | 23.7% | 14.6% | 11.2% | 4.0% | 5.6% | 2.4% | 1.1% | 1.3% | 1.9% | 1.4% | 0.3% | 7.2% | 100% |
| United States | 40.5% | 19.4% | 11.6% | 7.3% | 9.6% | 1.2% | 1.0% | 1.6% | 1.7% | 1.8% | 0.7% | 0.3% | 3.4% | 100% |
| Other Countries | 33.0% | 14.2% | 16.5% | 5.9% | 2.5% | 5.0% | 3.1% | 4.0% | 2.3% | 1.5% | 0.8% | 0.1% | 11.1% | 100% |
 |
 |
 |
 |
 |
 |
 |
 |
 |
 |
 |
 |
 |
 |
 |
 |
 |
 |
 |
 |
 |
 |
 |
 |
 |
 |
 |
 |
 |
 |
 |