The INFATI Data
Abstract
The ability to perform meaningful empirical studies is of essence in research in spatio-temporal query processing. Such studies are often necessary to gain detailed insight into the functional and performance characteristics of proposals for new query processing techniques. We present a collection of spatio-temporal data, collected during an intelligent speed adaptation project, termed INFATI, in which some two dozen cars equipped with GPS receivers and logging equipment took part. We describe how the data was collected and how it was “modified” to afford the drivers some degree of anonymity. We also present the road network in which the cars were moving during data collection. The GPS data is publicly available for non-commercial purposes. It is our hope that this resource will help the spatio-temporal research community in its efforts to develop new and better query processing techniques.
1 Introduction
Aspects of key computing and communication hardware technologies continue to improve rapidly, some at sustained exponential rates. The advances in computing and communication combine with advances in geo-positioning to enable a range of new, location-enabled, mobile services. This entire development contributes to making research in spatio-temporal data management more relevant than ever.
When developing new query processing techniques, prototype implementation and subsequent rigorous empirical studies of central functional and performance characteristics of the techniques are often essential. Such studies may be the only or best means of gaining the detailed insight necessary to guide the design process, and they may be the only or best means of understanding the characteristics of the final designs.
When subjecting query processing techniques to empirical study, synthetic as well as real data play important roles. These kinds of data have complimentary strengths and weaknesses. Synthetic data are important for several reasons. First, a single real data set is likely to capture only a specific type of use of the technique under study. In order to test the technique under varying types of conditions, synthetic data is useful. Second, synthetic data generators offer controls that enable the generation of data sets with specific properties, e.g., data sets with certain sizes and that possess certain statistical properties. Synthetic data sets thus make it possible to subject a techniques to a wide variety of conditions. In contrast, real data are essential in guaranteeing that the techniques under study are subjected to realistic conditions. With synthetic data, there is generally no guarantee that the data corresponds to any real-world application.
The literature offers descriptions of several synthetic-data generators. In particular, a recent special issue of the IEEE Data Engineering Bulletin contains papers that offer overviews of available data generators and real data sets [5].
In this special issue, Brinkhoff [1] surveys the generation of data sets intended expressly for the testing of query processing techniques underlying location-based services. Specifically, he covers his own Network-based Generator [2] and Kaufman et al.’s City Simulator [7], both of which assume that the object movement, from which the generated data result, is constrained to a transportation network.
Also in this issue, Nascimento et al. [9] and Manolopoulos et al. [14] cover three data generators for moving objects that differ from those covered by Brinkhoff in that they do not constrain movement to a network. Stated briefly, GSTD [10] generates moving-point and moving-rectangle data. G-TERD [13] produces sequences of raster images. Oporto [12] generates data corresponding to fishing-at-sea scenarios.
Finally, Nascimento et al. cover several real data sets. Two data sets contain animal-tracking data. Another data set contains hurricane tracking data. With less than a thousand data entries each, these data sets are relatively small. The data set most closely related to the INFATI data contains data obtained from GPS receivers attached to thirteen buses. Positions were sampled every 30 seconds within a 24-hour interval, and the total number of entries is 28.617. The sampling frequency in the INFATI data is much higher, and the number of data entries is ca. 1.9 million. Pfoser maintains a web page with pointers to real spatio-temporal data [11].
The next section describes the general setting in which the INFATI GPS log data were collected. Section 3 describes the GPS data, including how some degree of driver-anonymity was ensured. Next, Section 4 describes the road network in which the cars were traveling when the GPS data was collected. Section 5 details how to download the data and documentation. A final section offers acknowledgments.
2 Background Information
The INFATI data derive from the INFATI Project [4], an intelligent speed adaptation project carried out by a team of researchers at department of Development and Planning, Aalborg University, that also included participants from the companies Sven Allan Jensen and M-Tec. The main purpose of the project was to investigate driver response to alerts issued by a device installed in the car. This device continuously displays the current speed. When the speed is below the speed limit, the screen features a green light (see Figure 1(a)). When the speed exceeds the limit, the green light is replaced by a flashing red light (see Figure 1(b)) and the display of the current speed also flashes. In addition, a female voice announces the speed limit, adding “you are driving too fast” (in Danish).
A total of 24 distinct test cars and families participated in the INFATI project’s intelligent speed adaptation experiment. The cars were divided into two teams, Team-1 and Team-2. The INFATI data contains GPS log-data from 11 cars from Team-1. This data was collected during December 2000 and January 2001. The INFATI data contains data from 9 cars in Team-2. This data was collected during February and March 2001.
The remaining 4 cars were excluded for varying reasons. All cars were driving in the municipality of Aalborg, which includes the city of Aalborg, suburbs, and some neighboring towns. Section 4 describes the road network of this area in some detail.
In addition to the display, each car was equipped with a Global Positioning System (GPS) [15] receiver and a small custom-built computer. For more than a month, the movement of each car was registered in the car’s database. When a car was moving, its GPS position was sampled every second. The GPS positions were stored in the Universal Transverse Mercator (UTM 32) format. No sampling was performed when a car was parked. Additional information about the experiment can be found on the INFATI web site [4].
3 GPS Positions of Cars
For each car that delivered data, the INFATI data contains one file with GPS log data. This section first describes the contents of the 20 resulting files, then describes the data-removal procedure that was applied in order to introduce some degree of driver privacy protection.
3.1 GPS Log Files
The GPS log data files are named as follows: team_car_no_home.txt, where represents the number of the team and represents the unique car identifier. For example, team_car_no_home.txt is the file for car number 3 in Team-1. The two teams were active in non-overlapping time periods. Statistics about the cars are provided in Tables 1(a) and (b).
| Car id | Records | Earliest date | Latest date |
|---|---|---|---|
| 1 | 47055 | 22-Dec-00 | 22-Jan-01 |
| 2 | 79607 | 06-Dec-00 | 29-Jan-01 |
| 3 | 73189 | 07-Dec-00 | 25-Jan-01 |
| 4 | 14291 | 08-Dec-00 | 31-Dec-00 |
| 6 | 30361 | 21-Dec-00 | 30-Jan-01 |
| 7 | 37438 | 22-Dec-00 | 23-Jan-01 |
| 8 | 46290 | 22-Dec-00 | 22-Jan-01 |
| 9 | 87785 | 02-Jan-01 | 30-Jan-01 |
| 10 | 63536 | 02-Jan-01 | 30-Jan-01 |
| 11 | 86699 | 25-Dec-00 | 10-Jan-01 |
| 12 | 117873 | 08-Dec-00 | 29-Jan-01 |
| Total: 684124 | |||
| Car id | Records | Earliest date | Latest date |
|---|---|---|---|
| 1 | 264721 | 11-Feb-01 | 26-Mar-01 |
| 2 | 85549 | 05-Feb-01 | 26-Mar-01 |
| 4 | 125476 | 05-Feb-01 | 26-Mar-01 |
| 5 | 176477 | 03-Feb-01 | 26-Mar-01 |
| 6 | 113912 | 14-Feb-01 | 26-Mar-01 |
| 8 | 163119 | 05-Feb-01 | 26-Mar-01 |
| 10 | 100296 | 07-Feb-01 | 26-Mar-01 |
| 11 | 63664 | 06-Feb-01 | 26-Mar-01 |
| 12 | 117747 | 07-Feb-01 | 27-Mar-01 |
| Total: 1210961 | |||
The tables list the counts of GPS coordinates for a particular Car id and also give the time intervals, ranging from Earliest date to Latest date, covered by the individual cars. Notice that car identifiers are unique only within teams, not globally.
Next, Table 2 describes the format of a GPS log data entry.
| Attribute | Length | Description |
|---|---|---|
| id | 12 | Entry identifier, unique within a team. |
| entryid | 14 | Identifier composed by the attributes: carid, rdate, and rtime. |
| carid | 2 | Car identifier, unique within a team. |
| driverid | 2 | Car driver identifier. |
| rdate | 6 | Date in the format DDMMYY (where D denotes day, M denotes month, and Y denotes year). |
| rtime | 6 | Time in the format hhmmss (where h denotes hours, m denotes minutes, and s denotes seconds). |
| xcoord | 6 | X coordinate received from GPS receiver. |
| ycoord | 7 | Y coordinate received from GPS receiver. |
| mpx | 6 | Map-matched X coordinate. |
| mpy | 7 | Map-matched Y coordinate. |
| sat | 2 | The number of satellites used for determining the current position of the car. |
| hdop | 2 | Horizontal dilution of precision. |
| maxspd | 3 | Speed limit on the road to which the car’s position is map-matched. |
| spd | 3 | Actual speed of the car. |
| strtcod | 4 | Street code of the street to which the car’s position is map-matched. |
A few comments are in order. Attribute carid is unique only within a team (recall Tables 1(a) and (b)). However, the two teams were composed of different cars, meaning that no single car participated in both teams. A car has one or more drivers. Attributes rdate and rtime record the date and time when an entry was measured—in standard temporal database terms, they denote valid time. Attribute entryid is a concatenation of the carid, rdate, and rtime of an entry. As the granularity of the rtime attribute is second, and as we sample with the frequency of one second, one may expect entryid to be unique within a team and a file. However, it turns out that there does exist entries for the same car, date, and second. For attribute strtcod, the exceptional value “” indicates that the GPS position in an entry could not be mapped to any street.
Table 3 contains a few GPS log data entries.
| id | entryid | carid | driverid | rdate | rtime | xcoord | ycoord | mpx | mpy | sat | hdop | maxspd | spd | strtcod |
|---|---|---|---|---|---|---|---|---|---|---|---|---|---|---|
| 991 | 12091200130310 | 12 | 0 | 91200 | 130310 | 553570 | 6315889 | 553581 | 6315886 | 6 | 1 | 110 | 101 | 5490 |
| 992 | 12091200130311 | 12 | 0 | 91200 | 130311 | 553562 | 6315863 | 553572 | 6315859 | 7 | 1 | 110 | 101 | 5490 |
| 993 | 12091200130312 | 12 | 0 | 91200 | 130312 | 553554 | 6315836 | 553563 | 6315833 | 7 | 1 | 110 | 101 | 5490 |
| 994 | 12091200130313 | 12 | 0 | 91200 | 130313 | 553547 | 6315808 | 553556 | 6315806 | 7 | 1 | 110 | 100 | 5490 |
| 995 | 12091200130314 | 12 | 0 | 91200 | 130314 | 553541 | 6315781 | 553548 | 6315779 | 7 | 1 | 110 | 100 | 5490 |
| 996 | 12091200130315 | 12 | 0 | 91200 | 130315 | 553534 | 6315754 | 553541 | 6315752 | 7 | 1 | 110 | 101 | 5490 |
| 997 | 12091200130316 | 12 | 0 | 91200 | 130316 | 553528 | 6315726 | 553535 | 6315725 | 7 | 1 | 110 | 101 | 5490 |
| 998 | 12091200130317 | 12 | 0 | 91200 | 130317 | 553523 | 6315699 | 553530 | 6315697 | 7 | 1 | 110 | 101 | 5490 |
| 999 | 12091200130318 | 12 | 0 | 91200 | 130318 | 553518 | 6315671 | 553525 | 6315670 | 7 | 1 | 110 | 101 | 5490 |
Observe that leading zeros are stripped from carid, rdate, and rtime. However, values of the entryid attribute preserve leading zeros for each composing attribute, expect carid.
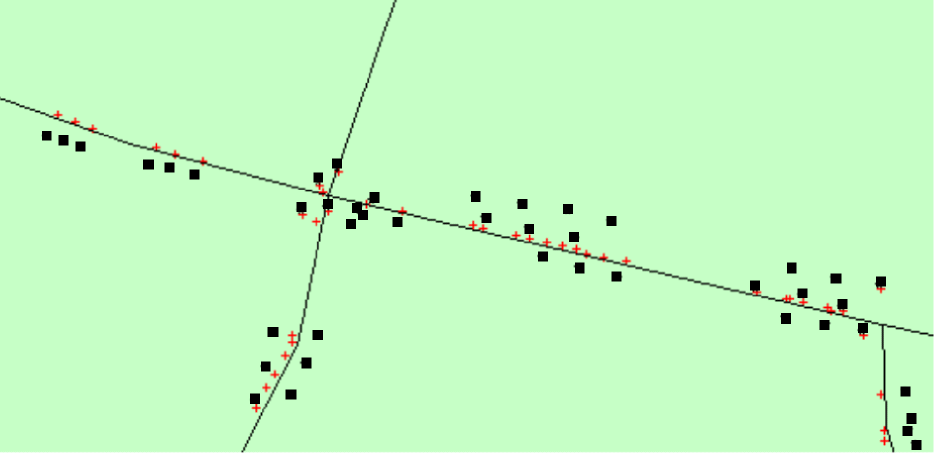
Figure 2 shows an example of data plot. The figure uses a “” to represent a pair of and coordinates obtained from the GPS receiver, and it uses “+” symbols for positions mapped to the roads. One should note that when the car is near a crossroads, the coordinates are not mapped to the road.
3.2 Privacy Protection
With a complete GPS log for a car, it is fairly straightforward to locate the residence of the driver(s) and thus to identify the driver(s). To afford the drivers some measure of privacy, we have applied the procedure described next to the GPS log data.
Specifically, we remove log entries with GPS positions that are close to the residence of the driver. To do so, the following steps were applied to each log data file.
-
1.
The entire area within which the car has been moving is divided into squares of size 100m100m.
-
2.
For each square, we count the number of GPS coordinates that first appeared (started) in the square after 4:00 a.m.
-
3.
The square with the largest sum is chosen as the square within which the residence of the driver(s) lies.
-
4.
To ensure that the “right” square is found, we compare visually with real positions on the map.
-
5.
Finally, log entries are removed that intersect with a 2km2km square that is chosen at random such that its center is less than 1 km from the residence of the driver(s).
An example of GPS log data for a car after application of this procedure is displayed in Figure 3.
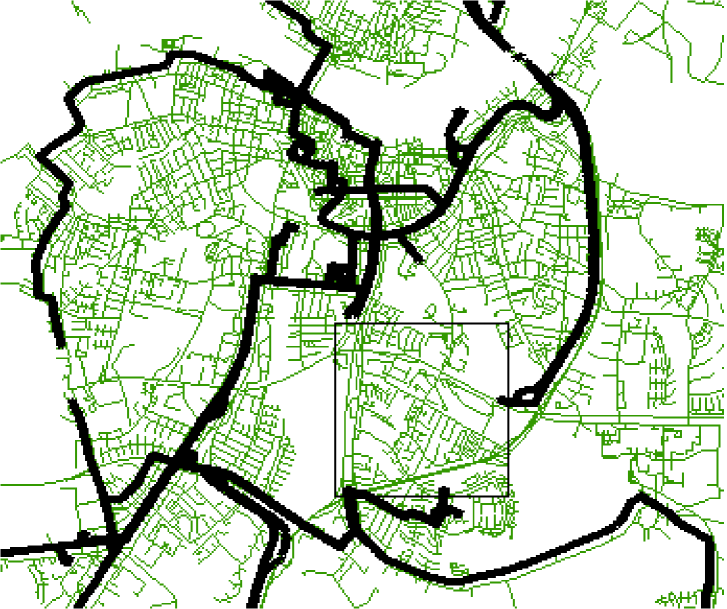
We use bold lines to represent the GPS coordinates of the car. The thinly lined rectangle bounds the area close to the residence of the driver(s). The data inside the rectangle is removed.
4 Road Network Description
We proceed to describe the road network in which the cars travel. We first describe the network representation, then describe modifications we made to the network representation. We have been unable to obtain permission to distribute this data. The ensuing description serves to explain better the GPS log data.
4.1 Road Network Format
The road network data resides in two files, road.dat and streetId_StreetName.txt. File road.dat contains the road geometry, and its format is given in Table 4.
| Attribute | Description |
|---|---|
| x_coord | coordinate of the road segment. |
| y_coord | coordinate of the road segment. |
| street_code | Street code of the road to which the road segment belongs. |
| kmh | Speed allowed on the road segment in kilometers per hour. |
| unique | Not used. |
A road network is composed of a set of segments. A segment is usually a part of a road that lies in-between a pair of consecutive intersections situated along the road. A segment is defined by a sequence of coordinates. Streets are numbered and are composed of several road segments. In file road.dat, a segment is thus represented by a set of entries. The value “” of attribute street_code in an entry indicates that the entry contains the last coordinate of a segment. Other values of this attribute identify the street to which the segment belongs. A small sample of entries from file Road.dat is shown in Table 5.
| x_coord | y_coord | street_code | kmh | unique |
|---|---|---|---|---|
| 55430572 | 632455870 | 7486 | 50 | 23 |
| 55430979 | 632457914 | 7486 | 50 | 23 |
| 55431749 | 632458306 | 7486 | 50 | 23 |
| 55449649 | 632456885 | -9 | 0 | 0 |
| 55419427 | 632454790 | 6607 | 50 | 23 |
| 55417961 | 632455407 | 6607 | 50 | 23 |
| 55416386 | 632455047 | -9 | 0 | 0 |
| 55416386 | 632455047 | 6607 | 50 | 23 |
| 55414107 | 632454593 | 6607 | 50 | 23 |
| 55410829 | 632454465 | -9 | 0 | 0 |
The table contains three segments. The first segment is a polyline described by four coordinates; it has street code 7486. The next two segments are composed of polylines described by three coordinates each, and they belong to the street with code 6607.
The entire road network is shown in Figure 4.
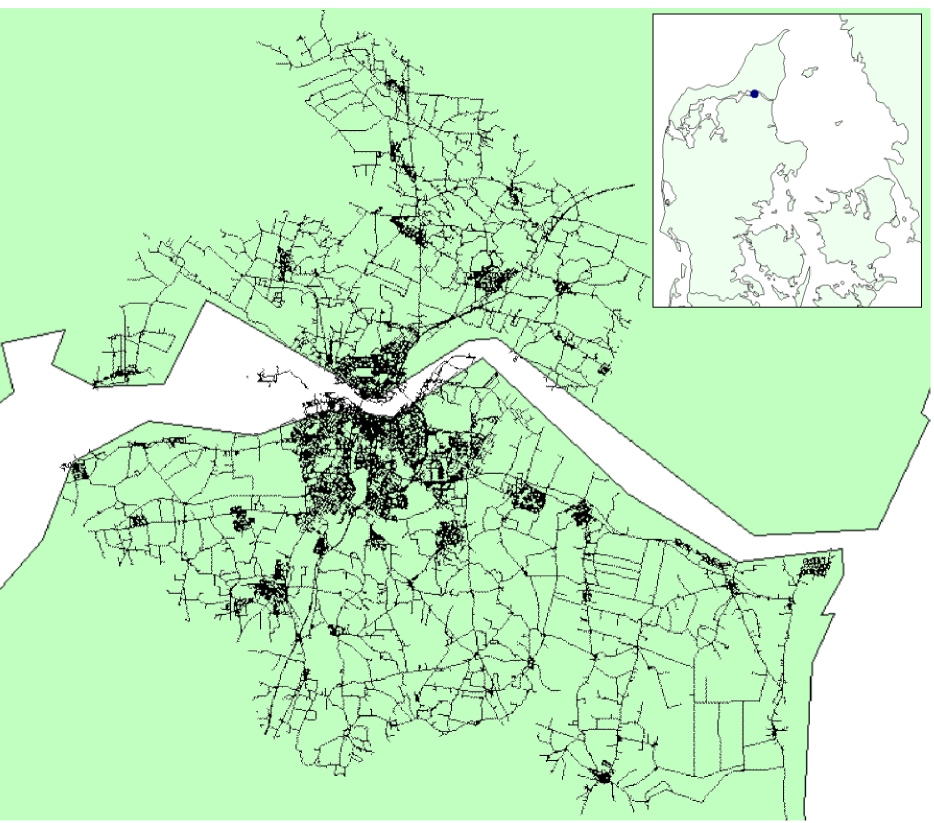
The white-and-green background has been included for illustrative purposes only—it is not part of the road network data. White areas indicate water, while green areas include land. To the right in the figure, we thus see part of the East Coast of Northern Jutland. The white polygon that bisects the figure represents a very rough approximation of the fjord Limfjorden (e.g., note that an island is not included).
File streetId_StreetName.txt contains the actual names of the streets. Its structure is described in Table 6(a), and an example of entries from the file is shown in Table 6(b).
| Column | Description |
|---|---|
| street_code | The code of the street. |
| street_name | The name of the street. |
| street_code | street_name |
|---|---|
| -9 | NULL |
| 0068 | ABELSVEJ |
| 0073 | ABILDG RDSVEJ |
| 0078 | ABSALONSGADE |
4.2 Road Network Modifications
The road network data was created some time before the GPS log data were collected. As the road network evolves continually, the road network data does not quite correspond to the road network in which the cars actually traveled during the GPS log data collection.
Consequently, there are differences between the roads on which GPS positions were recorded and the digital road network. This has led us to making some modifications of the road network data for some of the most-used roads. We have also split some segments that spanned more than two intersections. This was done in order to ensure that each road segment is delimited by two consecutive road intersections. The modified road network is stored in the file road_modified.dat and has the same format as file road.dat. Note that here, the last two digits of x_coord and y_coord are rounded.
5 Terms of Usage and Download Information
The INFATI data can be used free of charge for non-commercial research purposes. Commercial use is not allowed. The data can be downloaded via http:www.cs.auc.dk/TimeCenter/software.htm. Here, the following files may be found.
| File name | Description |
|---|---|
| gpsData.zip | Archive with GPS log data files as described in Section 3. |
| readme.txt | Short description of the archives and files. |
| TC-TR-79 | This article. |
Acknowledgments
A number of people and organizations contributed to enabling the publication of this document and the INFATI data.
We thank the members of the INFATI project. The M-Track project, sponsored by the Electronics and Telecommunications Research Institute, South Korea, funded in part the production of this document. Specifically, in addition to Stardas Pakalnis, it funded Linas Bukauskas and Alminas Čivilis, who provided helpful comments on an earlier draft. Funding was also received from the European Commission through contract number IST-2001-32645.
We thank the anonymous drivers, who gave us permission to publish their GPS data. The road network representation used for map matching and described in Section 4 was provided by COWI.
References
- [1] T. Brinkhoff. Generating Traffic Data. pp. 19–25 in [5].
- [2] T. Brinkhoff. A Framework for Generating Network-Based Moving Objects. Geoinformatica, 6(2):153–180, 2002.
-
[3]
P. Heide.
INFATI Hardware og Software. Technical Report. Aalborg
University, Denmark.
http://www.trg.dk/projekter/infati/notat2.pdf. - [4] INFATI. The INFATI Project Web Site: http://www.infati.dk/uk.
- [5] C. S. Jensen, editor. Infrastructure for Research in Spatio-Temporal Query Processing. Special Issue of the IEEE Data Engineering Bulletin, 26(2), 54 pp., June 2003.
-
[6]
J. Juhl.
INFATI Mapmatching. Technical Report. Aalborg University,
Denmark.
http://www.trg.dk/projekter/infati/notat3.pdf. - [7] J. Kaufman, J. Myllymaki, and J. Jackson. City Simulator. alphaWorks Emerging Technologies, November 2001, https://secure.alphaworks.ibm.com/aw.nsf/techs/citysimulator.
- [8] M-Track. The M-Track project Web Site. http://www.cs.auc.dk/research/DP/mtrack/.
- [9] M. A. Nascimento, D. Pfoser, and Y. Theodoridis. Generating Traffic Data. pp. 26–32 in [5].
- [10] D. Pfoser and Y. Theodoridis. Generating Semantics-Based Trajectories of Moving Objects. Intl. J. of Computers, Environment and Urban Systems (Special issue on Emerging Technologies for Geo-Based Applications), 27(3):243–263, 2003.
- [11] D. Pfoser. Spatiotemporal Datasets http://dke.cti.gr/people/pfoser/data.html
- [12] J.-M. Saglio and J. Moreira. Oporto: A Realistic Scenario Generator for Moving Objects. Geoinformatica, 5(1):71–93, March 2001.
- [13] T. Tzouramanis, M. Vassilakopoulos, and Y. Manolopoulos. On the Generation of Time-Evolving Regional Data. Geoinformatica, 6(3):207–231, September 2002.
- [14] T. Tzouramanis, M. Vassilakopoulos, and Y. Manolopoulos. Generating Dynamic Raster Data. pp. 26–32 in [5].
- [15] General information about GPS: http://www.gpsy.com/gpsinfo/ .