Small-World File-Sharing Communities
Abstract
Web caches, content distribution networks, peer-to-peer file sharing networks, distributed file systems, and data grids all have in common that they involve a community of users who generate requests for shared data. In each case, overall system performance can be improved significantly if we can first identify and then exploit interesting structure within a community’s access patterns. To this end, we propose a novel perspective on file sharing based on the study of the relationships that form among users based on the files in which they are interested. We propose a new structure that captures common user interests in data—the data-sharing graph— and justify its utility with studies on three data-distribution systems: a high-energy physics collaboration, the Web, and the Kazaa peer-to-peer network. We find small-world patterns in the data-sharing graphs of all three communities. We analyze these graphs and propose some probable causes for these emergent small-world patterns. The significance of small-world patterns is twofold: it provides a rigorous support to intuition and, perhaps most importantly, it suggests ways to design mechanisms that exploit these naturally emerging patterns.
I Introduction
Large-scale, Internet-connected distributed systems are notoriously difficult to manage. In a resource-sharing environment such as a peer-to-peer system that connects hundreds of thousands of computers in an ad-hoc network, intermittent resource participation, large and variable scale, and high failure rates are challenges that often impose performance tradeoffs. Thus, existing P2P file-location mechanisms favor specific requirements: in Gnutella, the emphasis is on accommodating highly volatile peers and on fast file retrieval, with no guarantees that files will always be located. In Freenet [1], the emphasis is on ensuring anonymity. In contrast, distributed hash tables such as CAN [2], Chord [3], Pastry [4], and Tapestry [5] guarantee that files will always be located, but do not support wildcard searches.
One way to optimize these tradeoffs is to understand user behavior. In this paper we analyze user behavior in three file-sharing communities in an attempt to get inspiration for designing efficient mechanisms for large-scale, dynamic, self-organizing resource-sharing communities.
We look at these communities in a novel way: we study the relationships that form among users based on the data in which they are interested. We capture and quantify these relationships by modeling the community as a data-sharing graph. To this end, we propose a new structure that captures common user interests in data (Section III) and justify its utility with studies on three data-distribution systems (Section IV): a high-energy physics collaboration, the Web, and the Kazaa peer-to-peer network. We find small-world patterns in the data-sharing graphs of all three communities (SectionV). We discuss the causes of these emergent small-world patterns in Section VI. The significance of these newly uncovered patterns is twofold (Section VII): First, it explains previous results [6] and confirms (with formal support) the intuition behind them. Second, it suggests ways to design mechanisms that exploit these naturally emerging patterns.
II Intuition
It is not news that understanding the system properties can help guide efficient solution design. A well known example is the relationship between file popularity in the Web and cache size. The popularity of web pages has been shown to follow a Zipf distribution [7, 8]: few pages are highly popular and many pages are requested few times. As a result, the efficiency of increasing cache size is not linear: caching is useful for the popular items, but there is little gain from increasing the cache to provision for unpopular items.
As a second example, many real networks are power law. That is, their node degrees are distributed according to a power law, such that a small number of nodes have large degrees, while most nodes have small degrees. Adamic et al. [9] propose a mechanism for probabilistic search in power-law networks that exploits exactly this characteristic: the search is guided first to nodes with high degree and their many neighbors. This way, a large percentage of the network is covered fast.
This type of observations inspired us to look for patterns in user resources requests. But what patterns?
II-A Patterns, Patterns Everywhere
It is believed that the study of networks started with Euler’s solution of the Königsberg bridge problem in 1735. The field has since extended from theoretical results to the analysis of patterns in real networks. Social sciences have apparently the longest history in the study of real networks [10], with significant quantitative results dating from the 1920s [11].
The development of the Internet added significant momentum to the study of networks: by both facilitating access to collections of data and by introducing new networks to study, such as the Web graph, whose nodes are web pages and edges are hyperlinks [12], the Internet at the router and the AS level [13] and the email graph [14].
The study of large real networks led to fascinating results: recurring patterns emerge in real networks (see [15, 16, 17, 10] for good surveys). For example, a frequent pattern is the power-law distribution of node degree, that is, a small number of nodes act as hubs (having a large degree), while most nodes have a small degree. Examples of power-law networks are numerous and from many domains: the phone-call network (long distance phone calls made during a single day) [18, 19], the citation network [20], and the linguistics network [21] (pairs of words in English texts that appear at most one word apart). In computer science, perhaps the first and most surprising result at its time was the proof that the random graph-based models of the Internet (with their Poisson degree distribution) were inaccurate: the Internet topology had a power-law degree distribution [13]. Other results followed: the web graph [22, 12] and the Gnutella overlay (as of year 2000) [23] are also power-law networks.
Another class of networks are the “small worlds”. Two characteristics distinguish small-world networks: first, a small average path length, typical of random graphs (here ‘path’ means shortest node-to-node path); second, a large clustering coefficient that is independent of network size. The clustering coefficient captures how many of a node’s neighbors are connected to each other. This set of characteristics is identified in systems as diverse as social networks, in which nodes are people and edges are relationships; the power grid system of western USA, in which nodes are generators, transformers, substations, etc. and edges are transmission lines; and neural networks, in which nodes are neurons and edges are synapses or gap junctions [24].
II-B Research Questions
Newman shows that scientific collaboration networks in different domains (physics, biomedical research, neuroscience, and computer science) have the characteristics of small worlds [25, 26, 27]. Collaboration networks connect scientists who have written articles together.
Moreover, Girvan and Newman [28] show that well-defined groups (such as a research group in a specific field) can be identified in (small-world) scientific collaboration networks. In parallel, a theoretical model for small-world networks by Watts and Strogatz [29] pictures a small world as a loosely connected set of highly connected subgraphs.
From here, the step is natural: since scientists tend to collaborate on publications, they most likely use the same resources (share them) during their collaboration: for example, they might use the same instruments to observe physics phenomena, or they might analyze the same data, using perhaps the same software tools or even a common set of computers. This means that if we connect scientists who use the same files, we might get a small world. Even more, we might be able to identify groups that share the same resources. Notice that the notion of “collaboration” transformed into “resource sharing”: the social relationships do not matter anymore, scientists who use the same resources within some time interval may never hear of each other.
Resource sharing in a (predominantly) scientific community is the driving force of computational Grids. If we indeed see these naturally occurring sharing patterns and we find ways to exploit them (e.g., by identifying users grouped around common sets of resources), then we can build mechanisms that can tame the challenges typical of large-scale, dynamic, heterogeneous, latency-affected distributed systems.
The research question now become clear:
-
Q1
Are there any patterns in the way scientists share resources that could be exploited for designing mechanisms?
But resource sharing also exists outside scientific communities: peer-to-peer systems or even the Web facilitate the sharing of data. Another question arises:
-
Q2
Are these characteristics typical of scientific communities or are they more general?
This article answers these two questions: it shows that small-world patterns exist in diverse file-sharing communities.
III The Data-Sharing Graph
To answer question Q1, we define a new graph that captures the virtual relationship between users who request the same data at about the same time.
Definition: The data-sharing graph is a graph in which nodes are users and an edge connects two users with similar interests in data.
We consider one similarity criterion in this article: the number of shared requests within a specified time interval.
To answer question Q2, we analyze the data-sharing graphs of three different file-sharing communities. Section IV presents briefly these systems and the traces we used. We discover that in all cases, for different similarity criteria, these data-sharing graphs are small worlds. The next sections show that using the data-sharing graph for system characterization has potential both for basic science, because we can identify new structures emerging in real, dynamic networks (Section V); and for system design, because we can exploit these structures when designing data location and delivery mechanisms (Section VII).
IV Three Data-Sharing Communities
We study the characteristics of the data-sharing graph corresponding to three file-sharing communities: a high-energy physics collaboration (Section IV-A), the Web as seen from the Boeing traces (Section IV-B), and the Kazaa peer-to-peer file-sharing system seen from a large ISP in Israel (Section IV-C).
This section gives a brief description of each community and its traces (duration of each trace, number of users and files requested, etc.) In addition, we present the file popularity and user activity distributions for each of these traces as these have a high impact on the characteristics of the data-sharing graph: intuitively, a user with high activity is likely to map onto a highly connected node in the data sharing graph. Similarly, highly popular files are likely to produce dense clusters.
| System | Users | Requests | Duration | |
|---|---|---|---|---|
| All | Distinct | Traces | ||
| D0 | 317 | 2,757,015 | 193,686 | 180 days |
| Web | 60,826 | 16,527,194 | 4,794,439 | 10 hours |
| Kazaa | 14,404 | 976,184 | 116,509 | 5 days |
IV-A The D0 Experiment: a High-Energy Physics Collaboration
The D0 experiment [30] is a virtual organization comprising hundreds of physicists from more than 70 institutions in 18 countries. Its purpose is to provide a worldwide system of shareable computing and storage resources that can together solve the common problem of extracting physics results from about a Petabyte (c.2003) of measured and simulated data. In this system, data files are read-only and typical jobs analyze and produce new, processed data files. The tracing of system utilization is possible via a software layer (SAM [31]) that provides centralized file-based data management.
We analyzed logs over the first six months of 2002, amounting to about 23,000 jobs submitted by more than 300 users and involving more than 2.5 million requests for about 200,000 distinct files. A data analysis job typically runs on multiple files (117 on average). Figure 1 left shows the distribution of the number of files per job.

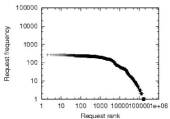
Figure 2 shows the daily activity (in number of requests per day) and user activity (in number of requests submitted by each user during the 6-month interval). The daily activity is relatively constant, with a few significant peaks—corresponding perhaps to approaching paper submission deadlines in high-energy physics?. User activity is highly variable, with scientists who scan from tens of thousands of distinct data files to just a couple.


In D0 file popularity does not follow the Zipf’s law typical of Web requests. (Figure 1, right). The reason we believe is that data in this scientific application is more uniformly interesting: a typical job swipes a significant part of the data space (and hence file set) in search of particular physics events.
IV-B The Web
We use the Boeing proxy traces [32] as a representative sample for Web data access patterns. These traces represent a five-day record from May 1999 of all HTTP requests (more than 20M requests per day) from a large organization (Boeing) to the Web. Because traces are anonymized and IDs are not preserved from day to day, our study was limited to one-day intervals. However, given the intense activity recorded (Figure 4 left shows the number of requests per second), this limitation does not affect the accuracy of our results. Here we study a representative 10-hour interval.
For the study of Web traces, we consider a user as an IP address. During the 10-hour interval, 60,826 users sent 16.5 million web requests, of which 4.7 million requests were distinct. It is possible that the same IP address corresponded in fact to multiple users (for example, for DHCP addresses or shared workstations). We do not have any additional information to help us identify these cases or evaluate their impact. However, given the relatively short intervals we consider in our studies—from 2 minutes to a couple of hours—the chances of multiple users using the same IP are small.

IV-C The KaZaA Peer-to-Peer Network
Kazaa is a popular peer-to-peer file-sharing system with an estimated number of more than 4 million concurrent users as of June 2003 [33].
Few details are publicly available about the Kazaa protocol. Apparently, Kazaa nodes dynamically elect “supernodes” that form an unstructured overlay network and use query flooding to locate content. Regular nodes connect to one or more super-nodes and act as querying clients to super-nodes. Control information, such as queries, membership, and software version. is encrypted. Once content has been located, data is transfered (unencrypted) directly from provider to requester using the HTTP protocol. In order to improve transfer speed, multiple file fragments are downloaded in parallel from multiple providers.
Since control information is encrypted, the only accessible traffic information can be obtained from the download channel. As a result we can only gather information about the files requested for download and not about files searched for (therefore, typos are naturally filtered). Details on how Kazaa traces were recorded as well as a thorough analysis of the Kazaa traffic are presented in [34].


We had access to five days of Kazaa traffic, during which 14,404 users downloaded 976,184 files, of which 116,509 were distinct. Users are identified based on their (anonymized) user ID that appears in the HTTP download request. The user population is formed of Kazaa users who are clients of the ISP: similar to the Boeing traces, these traces give information about only a limited set of Kazaa users.
V Small-World Data-Sharing Graphs
Data-sharing graphs are built using the definition in Section III: users are nodes in the graph and two users are connected if they have similar interests in data during some interval. For the rest of this paper we consider one class of similarity criteria: we say that two users have similar data interests if the size of the intersection of their request sets is larger than some threshold. This section presents the properties of data-sharing graphs for the three communities introduced previously.
The similarity criterion has two degrees of freedom: the length of the time interval and the threshold on the number of common requests. Section V-A studies the dependence between these parameters for each of the three data-sharing communities.
Sections V-B and V-C present the properties of the data-sharing graphs. We shall see that not all data-sharing graphs are power law. However, they all exhibit small-world characteristics, a result that we support with more rigorous analysis in Section VI-A.
V-A Distribution of Weights
We can think of data-sharing graphs as weighted graphs: two users are connected by an edge labeled with the number of shared requests during a specified time period. Remove 0-weight edges, as well as isolated nodes (those that have no edges). We obtain a weighted data-sharing graph (Figures 6 and 7). The distribution of weights highlights differences among the sharing communities: the sharing in D0 is significantly more pronounced than in Kazaa, with weights in the order of hundreds or thousands in D0 compared to 5 in Kazaa.


V-B Degree Distribution
The node degree distribution of the data-sharing graph is particularly interesting for designing distributed applications. Figures 8, 9, and 10 present the degree distributions for the three systems: note that the Kazaa data-sharing graph is the closest to a power-law, while D0 graphs clearly are not power-law.


V-C Small-World Characteristics: Clustering Coefficient and Average Path Length
| Time | Files in | #Connected | Largest connected component | Random Graph | ||||||||
|---|---|---|---|---|---|---|---|---|---|---|---|---|
| System | Interval | Common | # Nodes | # Edges | Components | # Nodes | # Edges | |||||
| D0 | 7 days | 1 | 46 | 153 | 5 | 35 | 142 | 0.741 | 0.648 | 2.114 | 0.238 | 2.538 |
| D0 | 7 days | 100 | 26 | 95 | 3 | 20 | 88 | 0.773 | 0.743 | 1.65 | 0.463 | 2.021 |
| D0 | 7 days | 1000 | 14 | 43 | 1 | 14 | 43 | 0.834 | 0.652 | 1.5 | 0.472 | 2.351 |
| D0 | 28 days | 1 | 129 | 777 | 9 | 107 | 757 | 0.716 | 0.641 | 2.476 | 0.133 | 2.388 |
| D0 | 28 days | 100 | 84 | 441 | 4 | 78 | 438 | 0.706 | 0.763 | 2.769 | 0.145 | 2.524 |
| D0 | 28 days | 1000 | 49 | 235 | 6 | 35 | 226 | 0.838 | 0.808 | 1.628 | 0.379 | 1.906 |
| Web | 120 s | 1 | 2076 | 47610 | 100 | 1805 | 47256 | 0.786 | 0.634 | 2.666 | 0.029 | 2.296 |
| Web | 1800 s | 1 | 6137 | 1866338 | 39 | 6049 | 1866271 | 0.808 | 2.056 | 0.102 | 1.519 | |
| Web | 1800 s | 100 | 143 | 196 | 20 | 102 | 172 | 0.720 | 0.130 | 3.6 | 0.033 | 8.851 |
| Kazaa | 1 hour | 1 | 809 | 1937 | 97 | 548 | 1690 | 0.740 | 0.593 | 5.629 | 0.011 | 5.599 |
| Kazaa | 8 hours | 1 | 3608 | 31252 | 79 | 3403 | 30555 | 0.652 | 0.473 | 3.611 | 0.005 | 3.705 |
| Kazaa | 8 hours | 3 | 111 | 111 | 24 | 56 | 78 | 0.442 | 0.178 | 3.160 | 0.050 | 12.148 |
We wanted to test our intuition that, similar to scientific collaboration networks, we find small-world patterns at the resource sharing level. We consider the Watts-Strogatz definition [29]: a graph is a small world if it has small average path length and large clustering coefficient, much larger than that of a random graph with the same number of nodes and edges.
The clustering coefficient is a measure of how well connected a node’s neighbors are with each other. According to one commonly used formula for computing the clustering coefficient of a graph (Eq. 1), the clustering coefficient of a node is the ratio of the number of existing edges and the maximum number of possible edges connecting its neighbors. The average over all nodes gives the clustering coefficient of a graph (Eq. 2).
| (1) |
| (2) |
Another definition (Eq. 3) directly calculates the clustering coefficient of a graph as a ratio of the number of triangles and the number of triples of connected nodes, where connected triples of vertices are trios of nodes in which at least one is connected to the other two.
| (3) |
The two definitions of the clustering coefficient simply reverse the operations—one takes the mean of the ratios, while the other takes the ratio of the means. The former definition tends therefore to weight the low-degree vertices more heavily, since they have a small denominator in Eq. 1.
According to the definition of clustering from Eq. 1, the clustering coefficient of a random graph is:
| (4) |
The average path length of a graph is the average of all distances. For large graphs, measuring all-pair distances is computationally expensive, so an accepted procedure [24] is to measure it over a random sample of nodes. The average path length for the larger Web data-sharing graphs in Table II was approximated using a random sample of 5% of the graph nodes. The average path length of a random graph is given by Eq. 5.
| (5) |
We discover that data-sharing graphs for the three systems all display small-world properties. Figures 11, 12, and 13 show the small-world patterns—large clustering coefficient and small average path length—remain constant over time, for the entire period of our studies. Figure 14 summarizes the small-world result: it compares some instances of data-sharing graphs with small-world networks already documented in the literature. The axes represent the ratios of the data-sharing graphs metrics and the same metrics of random graphs of same size. Notice that most datapoints are concentrated around (“same average path length”) and (“much larger clustering coefficient”).


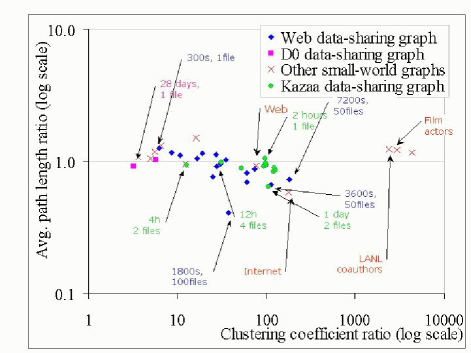
We clearly see that data-sharing graphs of various durations and similarity criteria are small worlds. From the Watts-Strogatz model of small worlds—as loosely connected collections of highly connected subgraphs—two significant observations can be drawn. First, well connected clusters exist; due to the data-sharing graph definition, these clusters map onto groups of users with shared interests in files. Second, there is, on average, a small path between any two nodes in the data-sharing graph: therefore, for example, flooding with relatively small time-to-live would cover most of the graph.
VI Human Nature or Zipf’s Law?
We observed small-world patterns in three different file-sharing communities: a scientific collaboration, the Web, and the Kazaa peer-to-peer system. Given the variety of our study sample, we could perhaps generalize this observation to any file-sharing user community. Thus, we seek to understand what causes these characteristics in data-sharing graphs and to answer the question:
-
Q3
Are the small-world characteristics consequences of previously documented patterns or do they reflect a new observation concerning user’s preferences in data?
We explore two directions that help us answer the causality question. In Section VI-A we focus on the definition of the data-sharing graph and question the large clustering coefficient as a natural consequence of the graph definition. In Section VI-B we analyze the influence of well-known patterns in file access, such as time locality and file popularity distribution.
VI-A Affiliation Networks
An affiliation network (also called “a preference network”) is a social network in which the participants (actors in sociology terminology) are linked by common membership in groups or clubs of some kind. Examples include scientific collaboration networks (in which actors belong to the group of authors of a scientific paper), movie actors (in which actors belong to the cast of a certain movie), and board directors (in which actors belong to the same board).
Affiliation networks are therefore bipartite graphs: there are two types of vertices, for actors and respectively groups, and edges link nodes of different types only (Figure 15, left). Affiliation networks are often represented as unipartite graphs of actors joined by undirected edges that connect actors in the same group. One observes now that the data-sharing graph with one-shared file threshold for the similarity criterion is such a one-mode projection of a bipartite affiliation network (Figure 15, right).

These one-mode projections of bipartite graphs have particular characteristics. Most relevant to this discussion is the clustering coefficient: inherently, the clustering coefficient is larger in these graphs than in random graphs of the same size, since the members of a group will form a complete subgraph in the one-mode projection. Consequently, our comparison with random graphs, although faithful to the Watts-Strogatz definition of small worlds, is misleading.
We therefore identified two possible sources of bias in our analysis: one is the implicitly large clustering coefficient of the unimodal affiliation networks, as just shown. Another is the degree distribution of the data-sharing graphs which, as in many other real networks, is far from the Poisson distribution of a random graph (Figures 8, 9, and 10).
Newman et al. [35, 36] propose a model for random graphs with given degree distributions. These graphs, therefore, will not be random in the Erdős-Rényi sense, but will be random members of a class of graphs with a fixed degree distribution. The authors also adapt their model to affiliation networks and deduce a set of parameters of their unimodal projection. We use their theoretical model to estimate the clustering coefficient of unimodal projections of random affiliation networks of the size and degree distributions as given by traces and compare it with the actual values.
In a bipartite affiliation network, there are two degree distributions: of actors (to how many groups does an actor belong) and of groups (how many actors does a group contain). Let us consider a bipartite affiliation graph of actors and groups. Let us name the probability that an actor is part of exactly groups and the probability that a group consists of exactly members. In order to easily compute the average node degree and the clustering coefficient of the unipartite affiliation network, Newman et al. use three functions , , and defined as follows:
| (6) |
| (7) |
| (8) |
The average degree for the actors’ one-mode projection of the affiliation network is:
| (9) |
And the clustering coefficient is:
| (10) |
The definition of the clustering coefficient is that of Eq. 3.
It is therefore relevant to compare the clustering coefficient of data-sharing graphs with that given by Equation 10.


Figure 16 shows the corresponding values for the degree distribution and (but not normalized: i.e., it shows the number rather than the percentage of users that requested exactly files) in a Web data-sharing graph with a similarity criterion of one shared request within a half-hour interval.
Table III shows that our intuition was correct: there is a significant difference between the values of measured and modeled parameters. Thus, the large clustering coefficient is not due to the definition of the data-sharing graph as a one-mode projection of an affiliation network with non-Poisson degree distributions.
| Clustering | Average degree | ||||||
| Interval | Users | Files | Theory | Measured | Theory | Measured | |
| D0 | 7 days | 74 | 28638 | 0.0006 | 0.65 | 1242.5 | 3.3 |
| 28 days | 151 | 67742 | 0.0004 | 0.64 | 7589.6 | 6.0 | |
| Web | 2 min | 3385 | 39423 | 0.046 | 0.63 | 50.0 | 22.9 |
| 30 min | 6757 | 240927 | 0.016 | 1453.1 | 304.1 | ||
| Kazaa | 1 h | 1629 | 3393 | 0.55 | 0.60 | 2.9 | 2.4 |
| 8 h | 2497 | 9224 | 0.30 | 0.48 | 9.5 | 8.7 | |
Table III leads to two observations. First, the actual clustering coefficient in the data-sharing graphs is always larger than predicted and the average degree is always smaller than predicted. An interesting new question emerges: what is the explanation for these (sometimes significant) differences? One possible explanation is that user requests for files are not random: their preferences are limited to a set of files, which explains the actual average degree being smaller than predicted. A rigorous understanding of this problem is left for future work.
A second observation is that we can perhaps compare the file sharing in the three communities by comparing their distance from the theoretical model. We see that the Kazaa data-sharing graphs are the closest to the theoretical model and the D0 graphs are very different from their corresponding model. This is different from the comparison with the Erdős-Rényi random graphs (Table II). The cause of this difference and the significance of this observation remain to be studied in the future.
VI-B Influences of Zipf’s Law and Time and Space Locality
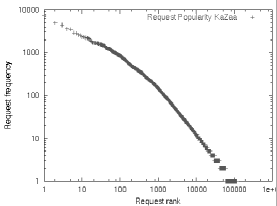
Event frequency has been shown to follow a Zipf distribution in many systems, from word occurrences in English and in monkey-typing texts to city population. It is also present in two of the three cases we analyze: the Web and Kazaa. Other patterns characteristic to data access systems include time locality, in which an item is more popular (and possibly requested by multiple users) during a limited interval and temporal user activity, meaning that users are not uniformly active during a period, but follow some patterns (for example, downloading more music files during weekends or holidays [23]). Thus, we ask:
-
Q4
Are the patterns we identified in the data-sharing graph, especially the large clustering coefficient, an inherent consequence of these well-known behaviors?
To answer this question, we generate random traces that preserve the documented characteristics but break the user-request association. From these synthetic traces, we build the resulting data-sharing graphs, and analyze and compare their properties with those resulting from the real traces.
VI-B1 Synthetic Traces
The core of our traces is a triplet of user ID, item requested and request time. Figure 17 identifies the following correlations in traces, some of which we want to preserve in the synthetic traces:

-
(1)
User–Time: User’s activity varies over time: for example, in the D0 traces, some users accessed data only in May.
-
(2)
Request–Time: Items may be more popular during some intervals: for example, news sites are more popular in the morning.
-
(3)
User–Request: This is the key to user’s preferences. By breaking this relationship and randomly recreating it, we can analyze the effect of user preferences on the properties of the data-sharing graph.
-
(4)
User: The number of items requested per user over the entire interval studied may be relevant, as some users are more active than others (see Figures 4 left for the Web traces).
-
(5)
Time: The time of the day (or in our case, of the periods studied) is relevant, as the Web traces show (the peak in Figure 4 right).
-
(6)
Request: This is item popularity: number of requests for the same item.
Our aim is to break the relationship (3), which implicitly requires the break of (1), (2), or both. We also want to preserve relationships (4), (5), and (6).
One can picture the traces as a matrix, in which is the number of requests in that trace and the three columns correspond to users, files requested, and request times, respectively. Now imagine the we shuffle the users column while the other two are kept unchanged: this breaks relations (3) and (1). If the requests column is shuffled, relations (3) and (2) are broken. If both user and request columns are shuffled, then relations (1), (2), and (3) are broken. In all cases, (4), (5), and (6) are maintained faithful to the real behavior: that is, users ask the same number of requests (4); the times when requests are sent are the same (5); and the same requests are asked and repeated the same number of times (6).
We generated synthetic traces in three ways, as presented above:
-
ST1:
No correlation related to time is maintained: break relations (1), (2), and (3).
-
ST2:
Maintain the request times as in the real traces: break relations (1) and (3).
-
ST3:
Maintain the user’s activity over time as in the real traces: break (2) and (3).
VI-B2 Properties of Synthetic Data-Sharing Graphs
Three characteristics of the synthetic data-sharing graphs are relevant to our study. First, the number of nodes in synthetic graphs is significantly different than in their corresponding real graphs (“corresponding” in terms of similarity criterion and time). On the one hand, the synthetic data-sharing graphs for which user activity in time (relation (1)) is not preserved have a significantly larger number of nodes. Even when the user activity in time is preserved (as in the ST3 case), the number of nodes is larger: this is because in the real data-sharing graphs, we ignored the isolated nodes and in the synthetic graphs there are no isolated nodes. On the other hand, when the similarity criterion varies to a large number of common requests (say, 100 in the D0 case, Figure 19), the synthetic graphs are much smaller or even disappear. This behavior is explained by the distribution of weights in the synthetic graphs (Figure 18): compared to the real graphs (Figure 6), there are many more edges with small weights. The median weight in the real D0 data-sharing graphs is 356 and the average is 657.9, while for synthetic graphs the median is 137 (185 for ST3) and the average is 13.8 (75.6 for ST3).


Second, the synthetic data-sharing graphs are always connected (unlike real graphs, that always have multiple connected components, as shown in Table II). Even for similarity criteria with large number of common requests the synthetic graphs remain connected. This behavior is due to the uniform distribution of requests per user in the case of synthetic traces, which is obviously not true in the real case.
Third, the synthetic data-sharing graphs are “less” small worlds than their corresponding real graphs: the ratio between the clustering coefficients is smaller and the ratio between average path lengths is larger than in real data-sharing graph (Figure 20). However, these differences are not major: the synthetic data-sharing graphs would perhaps pass as small worlds.

These results show that user preferences for files have significant influence on the data-sharing graphs: their properties are not induced (solely) by user-independent trace characteristics, but human nature has some impact. So perhaps the answer to this section title (“Human nature or Zipf’s law?”) is “Both”. However, it seems that identifying small-world properties is not a sufficient metric to characterize the natural interest-based clustering of users: we might need a metric of how small world a small-world data-sharing graph is. This problem remains to be studied further in the future.
VII Small-World Data-Sharing Graph: Significance for Mechanism Design
It is interesting to notice that the structure we call the data-sharing graph can be applied at various levels and granularities in a computing system. We looked at relationships that form at the file access level, but intuitively similar patterns could be found at finer granularity, such as access to same memory locations or access to same items in a database. For example, a recent article [37] investigates the correlation of program addresses that reference the same data and shows that these correlations can be used to eliminate load misses and partial hits.
At a higher level, the data-sharing graph can identify the structure of an organization—based on the applications its members use, for example—by identifying interest-based clusters of users and then use this information to optimize an organization’s infrastructure, such as servers or network topology.
In this section we focus on implications for mechanism design of the data-sharing graph from two perspective: its structure (definition) and its small-world properties. We stress that these are untested but promising ideas for future work.
VII-A Relevance of the Data-Sharing Graph Structure
Some recommender systems have a similar flavor to the data-sharing graph. ReferralWeb [38] attempts to uncover existing social networks to create a referral chain of named individuals. It does this by inferring social relationships from web pages, such as co-authorship, research groups and interests, co-participation in discussion panels, etc. This social network is then used to identify experts and to guide searches around them.
Sripanidkulchai et. al came close to the intuition of the data-sharing graph in their Infocom 2003 article [6]: they improve Gnutella’s flooding-based mechanism by inserting and exploiting interest-based shortcuts between peers. Interest-based shortcuts connect a peer to peers who provided data in the past. This is slightly different from our case, where an edge in the data-sharing graph connects peers that requested the same data. However, the two graphs are likely to overlap significantly if peers store data of their own interest. Our study distinguishes by its independence from any underlying infrastructure (in this case, the distribution of data on peers and the location mechanism) and gives a theoretical explanation of the performance improvements in [6].
The data-sharing graph can be exploited for a variety of decentralized file management mechanisms in resource-sharing systems (such as peer-to-peer or Grids).
-
•
In a writable file-sharing system, keeping track of which peers recently requested a file facilitates the efficient propagation of updates in a fully decentralized, self-organizing fashion (a similar idea is explored in [39]).
-
•
In large-scale, unreliable, dynamic peer-to-peer systems file replication may be used to insure data availability [40] and transfer performance. The data-sharing graph may suggest where to place replicas closer to the nodes that access them. Similarly, it may be useful for dynamic distributed storage: if files cannot be stored entirely on a node, then they can be partitioned among the nodes that are interested in that file.
-
•
In a peer-to-peer computing scenario, the relationships between users who requested the same files can be exploited for job management. If nodes store and share recently downloaded files, they become good candidates for running jobs that take those files as input. This can be used for scheduling, migrating or replicating data-intensive jobs.
VII-B Relevance of Small-World Characteristics
The idea underlying the data-sharing graph was first presented in [41] as a challenge to design a file-location mechanism that exploits the small-world characteristics of a file-sharing community. Meanwhile we completed the design and evaluation of a mechanism that dynamically identifies interest-based clusters, disseminates location information in groups of interested users, and propagates requests among clusters [42]. Its strengths come from mirroring and adapting to changes in user’s behavior. File insertion and deletion are low cost, which makes it a good candidate for scientific collaborations, where use of files leads to creation of new files.
VIII Summary
This article reveals a predominant pattern in diverse file-sharing communities, from scientific communities to the Web and file-swapping peer-to-peer systems. This pattern is brought to light by a structure we propose and that we call “data-sharing graph”. This structure captures the relationships that form between users who are interested in the same files. We present properties of data-sharing graphs from three communities. These properties are relevant to and might inspire the design of a new style of mechanisms in peer-to-peer systems, mechanisms that take into account, adapt to, and exploit user’s behavior. We also sketch some mechanisms that could benefit from the data-sharing graph and its small-world properties.
References
- [1] Ian Clarke, Oskar Sandberg, Brandon Wiley, and Theodore W. Hong, “Freenet: A distributed anonymous information storage and retrieval system,” in International Workshop on Designing Privacy Enhancing Technologies, Berkeley, CA, 2000, vol. 44-66, Springer-Verlag.
- [2] Sylvia Ratnasamy, Paul Francis, Mark Handley, Richard Karp, and Scott Shenker, “A scalable content-addressable network,” in SIGCOMM. 2001, ACM.
- [3] Ion Stoica, Robert Morris, David Karger, M. Frans Kaashoek, and Hari Balakrishnan, “Chord: A scalable peer-to-peer lookup service for internet applications,” in SIGCOMM, San Diego, USA, 2001.
- [4] A.I.T. Rowstron and P. Druschel, “Pastry: Scalable, decentralized object location, and routing for large-scale peer-to-peer systems,” in Middleware, 2001, pp. 329–350.
- [5] Ben Y. Zhao, John D. Kubiatowicz, and Anthony D. Joseph, “Tapestry: An infrastructure for fault-tolerant wide-area location and routing,” Tech. Rep. CSD-01-1141, Berkeley, 2001.
- [6] Kunwadwee Sripanidkulchai, Bruce Maggs, and Hui Zhang, “Efficient content location using interest-based locality in peer-to-peer systems,” in INFOCOM, San Francisco, 2003.
- [7] Paul Barford, Azer Bestavros, Adam Bradley, and Mark Crovella, “Changes in web client access patterns characteristics and caching implications,” Tech. Rep. BUCS-TR-1998-023, Boston University, 1998.
- [8] Lee Breslau, Pei Cao, Li Fan, Graham Phillips, and Scott Shenker, “Web caching and zipf-like distributions: Evidence and implications,” in InfoCom, New York, NY, 1999, IEEE Press.
- [9] Lada Adamic, Bernardo Huberman, Rajan Lukose, and Amit Puniyani, “Search in power law networks,” Physical Review. E, vol. 64, pp. 46135–46143, 2001.
- [10] Mark Newman, “The structure and function o complex networks,” Tech. Rep. cond-mat/0303516, Los Alamos Archive, 2003.
- [11] Linton Freeman, “Some antecedents of social network analysis,” Connections, vol. 19, pp. 39–42, 1996.
- [12] Andrei Broder, Ravi Kumar, Farzin Maghoul, Prabhakar Raghavan, Sridhar Rajagopalan, Raymie Stata, Andrew Tomkins, and Janet Wiener, “Graph structure in the web,” Computer Networks: The International Journal of Computer and Telecommunications Networking, vol. 33, no. 1-6, 2000.
- [13] Michalis Faloutsos, Petros Faloutsos, and Christos Faloutsos, “On power-law relationships of the internet topology,” in SIGCOMM, 1999, pp. 251–262.
- [14] Mark Newman, Stephanie Forrest, and Justin Balthrop, “Email networks and the spread of computer viruses,” Phys. Rev. E, vol. 66, no. 035101, 2002.
- [15] Réka Albert and Albert-László Barabási, “Statistical mechanics of complex networks,” Reviews of Modern Physics, vol. 74, pp. 47–97, 2002.
- [16] Albert-László Barabási, Linked: The New Science of Networks, Perseus Publishing, 2002.
- [17] Sergei Dorogovtsev and JFF. Mendes, “Evolution of networks,” Advances in Physics, vol. 51, no. 4, pp. 1079–1187, 2002.
- [18] J. Abello, P.M. Pardalos, and M.G.C. Resende, “On maximum clique problems in very large graphs,” DIMACS Series on Discrete Mathematics and Theoretical Computer Science, vol. 50, pp. 119–130, 1999.
- [19] William Aiello, Fan Chung, and Linyuan Lu, “A random graph model for massive graphs,” 2000, pp. 171–180.
- [20] Sidney Redner, “How popular is your paper? An empirical study of the citation distribution,” 1998, vol. 4, pp. 131–134.
- [21] Ramon Ferrer Cancho and Ricard V. Solè, “The small world of human language,” 2001, vol. 268, pp. 2261–2266.
- [22] Albert-László Barabási, Réka Albert, and Hawoong Jeong, “Scale-free characteristics of random netwroks: The topology of the World Wide Web,” Physica A, vol. 286, pp. 69–77, 2000.
- [23] Matei Ripeanu, Ian Foster, and Adriana Iamnitchi, “Mapping the Gnutella network: Properties of large-scale peer-to-peer systems and implications for system design,” Internet Computing, vol. 6, no. 1, pp. 50–57, 2002.
- [24] Duncan J. Watts, Small Worlds: The Dynamics of Networks between Order and Randomness, Princeton University Press, 1999.
- [25] Mark Newman, “Scientific collaboration networks: I. Network construction and fundamental results,” Phys. Rev. E, vol. 64, 2001.
- [26] Mark Newman, “Scientific collaboration networks: II. Shortest paths, weighted networks, and centrality,” Phys. Rev. E, vol. 64, 2001.
- [27] Mark Newman, “The structure of scientific collaboration networks,” Proc. Natl. Acad. Sci. USA, vol. 98, pp. 404–409, 2001.
- [28] Michelle Girvan and Mark Newman, “Community structure in social and biological networks,” Proc. Natl. Acad. Sci. USA, vol. 99, pp. 8271–8276, 2002.
- [29] Duncan Watts and Steven Strogatz, “Collective dynamics of ’small-world’ networks,” Nature, vol. 393, 1998.
- [30] “The DZero Experiment.,” http://www-d0.fnal.gov.
- [31] Lauri Loebel-Carpenter, Lee Lueking, Carmenita Moore, Ruth Pordes, Julie Trumbo, Sinisa Veseli, Igor Terekhov, Matthew Vranicar, Stephen White, and Victoria White, “SAM and the particle physics data grid,” in Proceedings of Computing in High-Energy and Nuclear Physics. Beijing, China, 2001.
- [32] “Boeing proxy logs,” ftp://researchsmp2.cc.vt.edu/pub/boeing/boeing.990301-05.notes.
- [33] “http://www.slyck.com,” .
- [34] Nathaniel Leibowitz, Matei Ripeanu, and Adam Wierzbicki, “Deconstructing the kazaa network,” in Workshop on Internet Applications, San Francisco, CA, 2003.
- [35] Mark Newman, Duncan Watts, and Steven Strogatz, “Random graph models of social networks,” Proc. Natl. Acad. Sci. USA, vol. 99, pp. 2566–2572, 2002.
- [36] Mark Newman, Steven Strogatz, and Duncan Watts, “Random graphs with arbitrary degree distribution and their applications,” Phys. Rev. E, vol. 64, no. 026118, 2001.
- [37] R. Sendag, P.-f. Chuang, and D. J. Lilja, “Address correlation: Exceeding the limits of locality,” Computer Architecture Letters, vol. 2, May 2003.
- [38] Henry Kautz, Bart Selman, and Mehul Shah, “ReferralWeb: Combining the social networks and collaborative filtering,” Communications of the ACM, vol. 40, no. 3, pp. 63–65, 1997.
- [39] Yasushi Saito, Christos Karamanolis, Magnus Karlsson, and Mallik Mahalingam, “Taming aggressive replication in the Pangaea wide-area file system,” in OSDI, 2002.
- [40] Kavitha Ranganathan, Adriana Iamnitchi, and Ian Foster, “Improving data availability through dynamic model-driven replication in large peer-to-peer communities,” in Global and Peer-to-Peer Computing on Large Scale Distributed Systems Workshop. 2002.
- [41] Adriana Iamnitchi, Matei Ripeanu, and Ian Foster, “Locating data in (small-world?) peer-to-peer scientific collaborations,” in 1st International Workshop on Peer-to-Peer Systems (IPTPS’02). 2002, LNCS Hot Topics series, Springer-Verlag.
- [42] Adriana Iamnitchi and Ian Foster, “FLASK: A file-location algorithm for small-world communities,” Unpublished.