A Steady State Model for Graph Power Laws
Abstract
Power law distribution seems to be an important characteristic of web graphs. Several existing web graph models generate power law graphs by adding new vertices and non-uniform edge connectivities to existing graphs. Researchers have conjectured that preferential connectivity and incremental growth are both required for the power law distribution. In this paper, we propose a different web graph model with power law distribution that does not require incremental growth. We also provide a comparison of our model with several others in their ability to predict web graph clustering behavior.
1 Introduction
The growth of the World Wide Web (WWW) has been explosive and phenomenal. Google [1] has more than billion pages searched as of February . The Internet Archive [2] has billion pages archived as of March . The existing growth-based models [6, 8, 21] are adequate to explain the web’s current graph structure. It would be interesting to know if a different model will be needed as the web’s growth rate slows down [3] while its link structure continues to evolve.
1.1 Why Power Laws?
Barabási et al. [9, 10] and Medina et al. [24] stated that preferential connectivity and incremental growth are both required for the power law distribution observed in the web. The importance of the preferential connectivity has been shown by several researchers [8, 16].
Faloutsos et al. [15] observed that the internet topology exhibits power law distribution in the form of . When studying web characteristics, the documents can be viewed as vertices in a graph and the hyper-links as edges between them. Various researchers [7, 8, 19, 22] have independently showed the power law distribution in the degree sequence of the web graphs. Huberman and Adamic [5, 16] showed a power law distribution in the web site sizes. See [20] for a summary of works on web graph structure.
Medina et al. [24] showed that topologies generated by two widely used generators, the Waxman model [32], and the GT-ITM tool [13], do not have power law distribution in their degree sequences. Palmer and Steffan [27] proposed a power law degree generator that recursively partitions the adjacency matrix into an - distribution. However, it is unclear if their generator actually emulates other web properties.
The power law distribution seems to be an ubiquitous property. The power law distribution occurs in epidemiology [30], population studies [28], genome distribution [17, 29], various social phenomena [11, 26], and massive graphs [4, 6]. For the power law graphs in biological systems, the connectivity changes appear to be much more important than growth in size due to the long time-scale of biological evolution.
1.2 Properties for Graph Model Comparison
Another important web graph property that has been looked at is diameter. However, there are conflicting results in the published papers. Albert et al. [7] stated that web graphs have the small world phenomenon [25, 31], in which the diameter is roughly , where is the size of the web graph. For , . Lu [23] proved the diameters of random power law graphs are logarithmic function of under the model proposed by Aiello et al. [6]. However, Broder et al. [12] showed that, over of the time, there is no directed path between two random vertices. If there is a path, the average distance is roughly when viewing web graph as directed graph or in the undirected case.
Currently, there are few theoretical graph models [6, 8, 21, 27] for generating power law graphs. There are very few comparative studies that would allow us to determine which of these theoretical models are more accurate models of the web. We only know that the model proposed by Kumar et al. [21] generates more bipartite cliques than other models. They believe clustering to be an important part of web graph structures that was insufficiently represented in previous models [6, 8].
1.3 New Contributions
In this paper, we show power law graphs do not require incremental growth, by developing a graph model which (empirically) results in power laws by evolving a graph according to a Markov process while maintaining constant size and density.
We also describe an easily computable graph property that can be used to capture cluster information in a graph without enumerating all possible subgraphs. We use this property to compare our model with others and with actual web data.
2 Steady State Model
Our (SS) model is very simple in comparison with other web graph models [6, 8, 21, 27]. It consists of repeatedly removing and adding edges in a sparse random graph .
Let be . We generate an initial sparse random graph with edges and vertices, by randomly adding edges between vertices until we have edges. As discussed below, the initial random distribution of edges is unimportant for our model.
We then iterate the following steps times on , where is a parameter to our model.
-
1.
Pick a vertex at random. If there is no edge incident upon , we repeat this step until has nonzero degree.
-
2.
Pick an edge at random.
-
3.
Pick a vertex at random.
-
4.
Pick a vertex with probability proportional to degree.
-
5.
If is not an edge in and is not equal to , then remove edge and add edge .
One can view our model as an aperiodic Markov chain with some limiting distribution. If we repeat the above steps long enough, the random graphs generated by this model will be close to this limiting distribution, no matter what the initial random sparse graph is. Note that unlike other models [6, 21], the graphs generated by our model do not contain self-loops nor multiple edges between two vertices.
Barabási et al. [9] also proposed a non-growth model, which failed to produce a power law distribution. Both models have preferential connectivity features. However, there are several differences between our model and theirs. First, our edge set is fixed and the initial graph is generated via classical random graph models [14, 18]. Second, our model has “rewiring” feature similar to one in the small world model [9, 25, 31].
2.1 Simulation Results
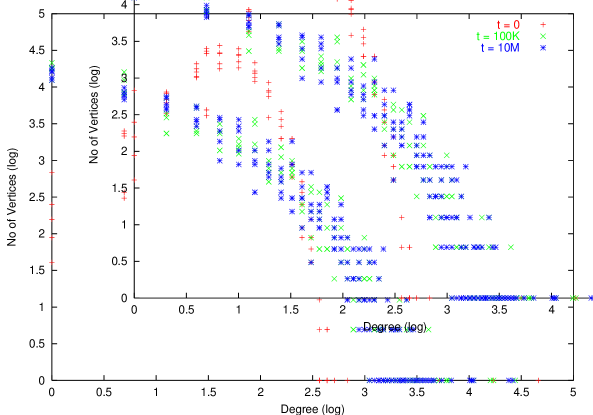
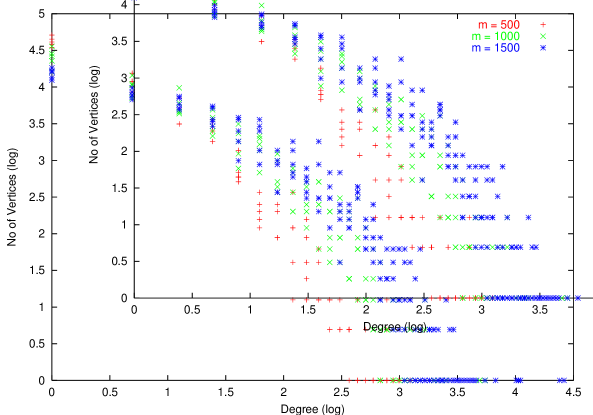
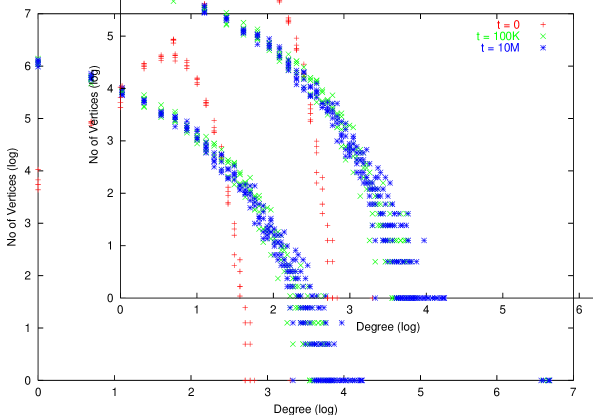
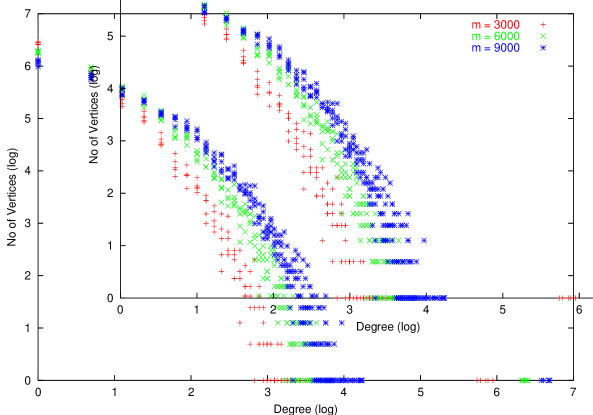
We simulated our model on graphs of different sizes, , and densities , . We repeated each simulation times, and performed edge deletion/insertion operations on each graph. The vertices’ degree distributions appear to converge to power law distributions as the number of edge deletion/insertion operations increases. Some of our simulation results are shown in Figures 1 - 4. Figures 1 and 3 show degree distributions at various stage of simulations. Figures 2 and 4 show degree distributions for graphs with different densities .
3 Cluster Information
Given a subgraph of , is the degree for vertex in . Here we examine the maximum degree in all subgraphs, which is defined as
We use to denote the value obtained under graph model .
To compute for a graph , we perform the following steps until becomes empty:
-
1.
Select a minimum degree vertex from .
-
2.
Set to if .
-
3.
Remove vertex and its edges from .
The above steps correctly compute because we cannot remove any vertices of until the degree of the current subgraph reaches . The minimal degree elimination sequence for graph in Figure 5 will be and . The degrees when those vertices got eliminated are and . is since .

Observation 1
For any model that constructs a graph by adding a vertex at a time, and for which each newly added vertex has the same degree , .
Thus the Barabási and Albert model (BA) [8] or the linear growth copying model in [21] have the same value for for graphs of all sizes once is fixed.
Observation 2
The web graph generated by the linear model has minimum vertex degree of .
Hence, the linear model may not encapsulate all the crucial properties in a web graph if there are significant numbers of vertices with degree less than .
3.1 Web Crawl and Simulation Data
We performed a web crawl on various Computer Science department web sites. We then used the model [6] to generate new graphs from degree sequences in the actual web graphs. We also ran the model using and values from the actual web graphs with edge insertion/deletion steps. For each graph, we run both models times. The following table shows the means and the standard deviations for values using the model and the model.
| Site | |||||||
| arizona | 5315 | 16892 | 15 | 10 | 0 | 8 | 0 |
| berkeley | 2826 | 22957 | 45 | 21.6 | 0.547 | 16 | 0 |
| caltech | 622 | 4830 | 7 | 5.8 | 0.447 | 12.8 | 0.447 |
| cmu | 2052 | 23821 | 57 | 37.2 | 0.447 | 20 | 0.707 |
| cornell | 7145 | 14919 | 17 | 19.4 | 0.547 | 6 | 0 |
| harvard | 915 | 9327 | 21 | 12.6 | 0.894 | 16.4 | 0.547 |
| mit | 4861 | 15360 | 31 | 24.4 | 0.547 | 7 | 0 |
| nd | 1913 | 16328 | 33 | 29.2 | 0.447 | 15.4 | 0.547 |
| stanford | 2553 | 25693 | 27 | 14.6 | 0.547 | 18.4 | 0.547 |
| ucla | 2718 | 19755 | 22 | 16.6 | 0.547 | 14.2 | 0.447 |
| ucsb | 5236 | 10338 | 22 | 13.8 | 0.447 | 5 | 0 |
| ucsd | 553 | 3885 | 15 | 7.2 | 0.447 | 11.8 | 0.447 |
| uiowa | 1410 | 12258 | 8 | 8.8 | 0.447 | 15.2 | 0.447 |
| uiuc | 5623 | 28872 | 29 | 21 | 0 | 11.8 | 0.836 |
| unc | 1465 | 5446 | 17 | 9.8 | 0.447 | 8 | 0 |
| washington | 7001 | 24901 | 17 | 12 | 0 | 9 | 0 |
Table : from Actual Web Crawl and Model Simulation
In general, the model and the model are generating less clustered graphs than what we see on actual web graphs. This implies that we need a more detailed model of web graph clustering behavior.
4 Conclusion and Open Problems
Previously, researchers have conjectured that preferential connectivity and incremental growth are necessary factors in creating power law graphs. In this paper, we provide a model of graph evolution that produces power law without growth. Our model is very simple in comparison with other graph models [21]. It also does not require prior degree sequences as in the model [6].
The difficulty in comparing various models [6, 8, 21] is that each model has different parameters and inputs. Here we provide a simple graph property that captures the clustering behavior of graphs without complicated subgraph enumeration algorithm. It can be useful in gauging the accuracy of various models.
From our web crawl data, we know that the linear models such as Barabási’s [8] are not the best ones to use when considering . Both and models are not generating dense-enough subgraphs when comparing against the actual web graphs. Thus, we need a better web graph model that mimics actual web graph clustering behavior.
Here are some of our open problems:
-
1.
Can one prove theoretically that the SS method actually has a power law distribution?
-
2.
How long does it take for our model to reach a steady state?
-
3.
What are other simple web graph properties that we can use to determine the accuracy of various models?
-
4.
Are there any technique such as graph products that we can use to generate realistic massive web graphs in relatively short times?
References
- [1] Google. www.google.com.
- [2] The Internet Archive. www.archive.org.
- [3] The Online Computer Library Center. wcp.oclc.org.
- [4] Abello, J., Buchsbaum, A., and Westbrook, J. A functional approach to external graph algorithms. In Proc. 6th Eur. Symp. Algorithms (1998), no. 1461 in Lecture Notes in Computer Science, Springer-Verlag, pp. 332–343.
- [5] Adamic, L., and Huberman, B. Power-law distribution of the world wide web. Science 287 (2000), 2115.
- [6] Aiello, W., Chung, F., and Lu, L. A random graph model for massive graphs. In Proc. 32nd Symp. Theory of Computing (2000), ACM, pp. 171–180.
- [7] Albert, R., Jeong, H., and Barabási, A. Diameter of the world-wide web. Nature 401 (September 1999), 130–131.
- [8] Barabási, A., and Albert, R. Emergence of scaling in random networks. Science 286, 5439 (1999), 509–512.
- [9] Barabási, A., Albert, R., and Jeong, H. Mean-field theory for scale-free random networks. Physica A 272 (1999), 173–187.
- [10] Barabási, A., Albert, R., and Jeong, H. Scale-free characteristics of random networks: the topology of the world-wide web. Physica A 281 (2000), 69–77.
- [11] Barabási, A., Albert, R., Jeong, H., and Bianconi, G. Response: Power-law distribution of the world wide web. Science 287 (2000), 2115.
- [12] Broder, A. Z., Kumar, S. R., Maghoul, F., Raghavan, P., Rajagopalan, S., Stata, R., Tomkins, A., and Wiener, J. Graph structure in the web: experiments and models. In Proc. 9th WWW Conf. (2000), pp. 309–320.
- [13] Calvert, K., Doar, M., and Zegura, E. Modeling internet topology. IEEE Communications Magazine (June 1997), 160–163.
- [14] Erdős, P., and Rényi, A. On random graphs I. Publ. Math. Debrecen 6 (1959), 290–297.
- [15] Faloutsos, M., Faloutsos, P., and Faloutsos, C. On power-law relationships of the internet topology. In Proc. ACM SIGCOMM Conf. (1999), pp. 251–260.
- [16] Huberman, B., and Adamic, L. Growth dynamics of the world-wide web. Science 401 (September 1999), 131–131.
- [17] Huynen, M. A., and van Nimwegen, E. Power laws in the size distribution of gene families in complete genomes: biological interpretations. Tech. Rep. 97-03-025, Santa Fe Institue, 1997.
- [18] Janson, S., Luczak, T., and Rucinski, A. Random Graphs. John Wiley & Sons, New York, NY, 2000.
- [19] Kleinberg, J., Kumar, S. R., Raghavan, P., Rajagopalan, S., and Tomkins, A. The web as a graph: Measurements, models and methods. In Proc. 5th Int. Conf. Computing and Combinatorics (1999), no. 1627 in Lecture Notes in Computer Science, Springer-Verlag, pp. 1–18.
- [20] Kleinberg, J., and Lawrence, S. The structure of the web. Science 294 (2001), 1849–1850.
- [21] Kumar, S. R., Raghavan, P., Rajagopalan, S., Sivakumar, D., Tomkins, A., and Upfal, E. Stochastic models for the web graph. In Proc. 41st Symp. Foundations of Computer Science (2000), IEEE, pp. 57–65.
- [22] Kumar, S. R., Raghavan, P., Rajagopalan, S., and Tomkins, A. Trawling the weeb for emerging cyber-communities. In Proc. 8th WWW Conf. (1999), pp. 403–416.
- [23] Lu, L. The diameter of random massive graphs. In Proc. 12th Symp. Discrete Algorithms (2001), ACM and SIAM, pp. 912–921.
- [24] Medina, A., Matta, I., and Byers, J. On the Origin of power laws in internet topologies. ACM Computer Communication Review 30, 2 (2000), 18–28.
- [25] Milgram, S. The small world problem. Psychol. Today 2 (1967), 60–67.
- [26] Ormerod, P., and Smith, L. Power law distribution of lifespans of large firms: breakdown of scaling. Tech. rep., Volterra Consulting Ltd., 2001.
- [27] Palmer, C., and Steffan, J. Generating network topologies that obey power laws. In Proc. IEEE Globecom (2000).
- [28] Palmer, M. W., and Whitge, P. S. Scale dependence and the species-area relationship. American Naturalist 144 (1994), 717–740.
- [29] Qian, J., Luscombe, N. M., and Gerstein, M. Protein family and fold occurrence in genomes: power-law behaviour and evolutionary model. J. Mol. Biol. 313 (2001), 673–681.
- [30] Rhodes, C. J., and Anderson, R. M. Power laws governing epidemics in isolated popluations. Nature 381 (1996), 600–602.
- [31] Watts, D. J. Small Worlds: The Dynamics of Networks Between Order and Randomness. Princeton University Press, Princeton, N.J., 1999.
- [32] Waxman, B. M. Routing of multipoint connections. IEEE J. Selected Areas in Communication 6, 9 (December 1988), 1617–1622.