Finite temperature effects in Coulomb blockade quantum dots and signatures of spectral scrambling
Abstract
The conductance in Coulomb blockade quantum dots exhibits sharp peaks whose spacings fluctuate with the number of electrons. We derive the temperature-dependence of these fluctuations in the statistical regime and compare with recent experimental results. The scrambling due to Coulomb interactions of the single-particle spectrum with the addition of an electron to the dot is shown to affect the temperature-dependence of the peak spacing fluctuations. Spectral scrambling also leads to saturation in the temperature dependence of the peak-to-peak correlator, in agreement with recent experimental results. The signatures of scrambling are derived using discrete Gaussian processes, which generalize the Gaussian ensembles of random matrices to systems that depend on a discrete parameter – in this case, the number of electrons in the dot.
pacs:
PACS numbers: 73.40.Gk, 05.45+b, 73.20.Dx, 73.23. -bA quantum dot is a sub-micron-sized conducting device containing up to several thousand electrons. In closed dots, the coupling between the dot and the leads is weak and the charge on the dot is quantized [1]. The addition of an electron into the dot requires a charging energy of (where is the capacitance of the dot). This charging energy can be compensated by varying the gate voltage , leading to Coulomb blockade oscillations of the conductance versus . In the quantum regime (i.e., for temperatures below the mean level spacing ), conductance occurs by resonant tunneling, and sharp conductance peaks are observed as a function of .
Dots can be fabricated with little disorder such that the electron dynamics in the dot is ballistic. Larger dots are often characterized by irregular shape, resulting in chaotic classical dynamics of the electrons. Such dots are expected to exhibit universal mesoscopic fluctuations which are the signature of quantum chaos. In particular, the distributions of the conductance peak heights in Coulomb blockade quantum dots at )) were predicted to be universal, depending only on the underlying space-time symmetries [2]. The measured distributions [3, 4] were found to agree well with theory. The statistics of the peak heights at finite temperatures () were also derived recently using random matrix theory (RMT) [5]. The measured distributions [6] become narrower and less asymmetric with increasing temperature, in qualitative agreement with theory, although significant deviations were observed at higher temperatures, presumably due to dephasing.
Another quantity whose statistics was recently studied both experimentally and theoretically is the spacing between successive conductance peaks. In the simple constant interaction (CI) model (where Coulomb interactions are included only as an average charging energy) and for , a (shifted) Wigner-Dyson peak spacing distribution is expected, but the observed distributions are Gaussian-like [7, 8, 9, 10]. This has been explained as an interaction effect by numerical diagonalization of a small Anderson model with Coulomb interactions [7, 11]. The temperature dependence of the peak spacing statistics was also measured recently [9]. In this paper we use the finite-temperature theory plus RMT to study the peak spacing fluctuations at temperatures . We find a rapid decrease of the fluctuations above , in agreement with the experimental results.
Interaction effects beyond the charging energy were not included in the finite temperature theory. They can be treated in a single-particle framework within a mean-field approximation (e.g., Hartree-Fock). Due to charge rearrangement, we expect the spectrum to change or “scramble” upon the addition of an electron into the dot [12, 6]. The effects of scrambling on the statistics can be described by a random matrix model that depends on a discrete parameter: the number of electrons on the dot. The theory of discrete Gaussian processes [13] can then be used to analyze the finite temperature statistics of peak spacings and peak heights for various degrees of scrambling. A rescaled parametric distance controls how fast the spectrum is changing, and will be referred to as the scrambling parameter. It was shown that spectral scrambling can lead to nearly Gaussian peak spacing distributions at low temperatures [14]. In this paper we derive two main signatures of a changing spectrum in the finite temperature statistics: the less rapid decrease of the spacing fluctuations with temperature for , and the saturation of the number of correlated peaks at higher temperatures [15]. The first effect has not been experimentally observed while the second has been qualitatively suggested and observed in Ref. [6]. We also derive a simple expression for the scrambling parameter in terms of the dot’s properties.
At , several resonances contribute to each conductance peak [16]
| (1) |
where is the dimensionless conductance expressed as a thermal average over individual level conductances . The thermal weight of a level (for ) is given by . where is the canonical free energy of non-interacting electrons on the dot, is an effective Fermi energy ( is the ratio between the plunger gate to dot capacitance and the total capacitance), and is the canonical occupation of a single-particle level . Both the canonical free energy and occupation are calculated exactly using particle-number projection [5]. In the statistical theory, the eigenvalues and wavefunctions fluctuate according to the corresponding Gaussian random matrix ensemble. The fluctuations of the partial widths are calculated by relating the widths to the eigenfunctions across the dot-lead interfaces.
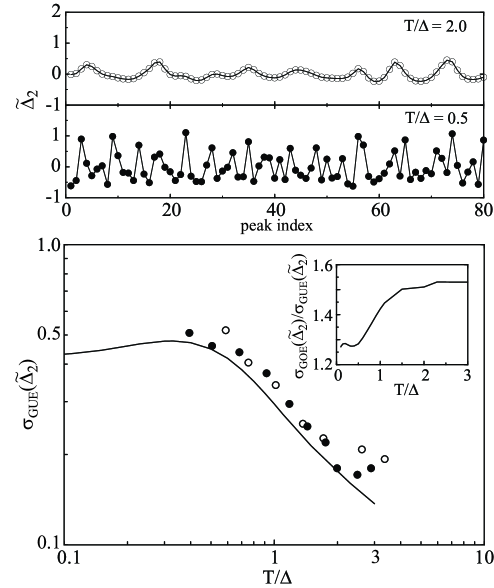
Eq. (1) was used in Ref. [5] to calculate the conductance peak distributions by full RMT simulations, and an approximate analytic expression was derived in the limit where spectral fluctuations are ignored. The finite temperature formulation can also be used to calculate the temperature-dependence of the peak spacing distributions. Unlike the peak height statistics, the peak spacing statistics are sensitive to fluctuations of both the spectrum and the wavefunctions, and full RMT simulations are required. The location of the -th peak is determined by finding the value of for which the conductance (1) is maximal. Statistics of peak spacings are collected from different successive peaks as well as from different realizations of the dot’s Hamiltonian. The peak spacings exhibit less fluctuations at higher temperatures as is demonstrated in the top panel of Fig. 4, where the spacings for a typical peak series calculated in one random matrix realization are shown at and . While we do not expect to reproduce the observed functional form (i.e. Gaussian-like) of the peak spacing distribution using a fixed spectrum, it is still meaningful to study the temperature-dependence of the standard deviation of the spacings (where ). The results for the GUE statistics are shown in the bottom panel of Fig.4 (solid line). The width shows a slight increase until about and then decreases rapidly with increasing . We compare the calculations with recent experimental results [9] in the presence of a magnetic field (circles). The calculations somewhat underestimate the experimental width but describe well the overall observed temperature dependence. Shown in the inset is the calculated ratio which increases as a function of . The experimental ratio of measured at mK is consistent with our theoretical results.
So far we have taken into account only an average value for the Coulomb interaction (). Interaction effects can be described within a single-particle framework in the Hartree-Fock (HF) approximation [17]. The peak spacing at can be expressed as a second order difference of the ground state energy of the dot as a function of particle number [7]. According to Koopmans’ theorem, the change in the HF ground state energy when an electron is added is given by the HF single-particle energy of the added electron
| (2) |
where is the HF ground-state energy of the dot with electrons, and is the energy of -th single-particle state for a dot with electrons. The theorem is valid in the limit when the single-particle eigenfunctions are independent of the number of electrons, and is expected to hold for large dots and for interactions that are not too strong. Its validity in numerical models of quantum dots was recently studied [17]. The spacing between the -th and peak is then given by
| (3) |
is the level spacing for a fixed number of electrons (), and is the energy variation of the -th level when the electron is added to the dot.
The HF Hamiltonian of the dot depends on the number of electrons, and in the following we denote by the Hamiltonian for electrons (in this notation ). For a dot whose single-electron dynamics is chaotic we shall assume that is a discrete Gaussian process, i.e., a discrete sequence of correlated Gaussian ensembles of a given symmetry class [13]. Such a process can be embedded in a continuous process where the Hamiltonian depends on a continuous parameter [18, 19]. A parametric dependence that originates in the dot’s deformation as a function of was used to explain the Gaussian-like shape of the peak spacing distribution [14]. Here the parametric dependence is assumed to be mainly due to interaction effects, as recent experimental results indicate [6, 10]. We further assume that is approximately independent of . According to the theory of Gaussian processes, the parametric statistics are universal upon scaling of the parameter by the rms level velocity [20]. We denote by the variation of the scaled parameter between successive number of electrons. The rms level velocity depends on the symmetry class, and in the following the parameter is always scaled by the GUE rms level velocity.
A simple Gaussian process is given by [18, 19]
| (4) |
where and are uncorrelated Gaussian random matrices. For each realization of the Gaussian process we calculate the single-particle spectrum as a function of the parameter. At , Eq. (3) does not hold. Instead we determine the spacing from the location of successive peaks: the -th peak is determined using the levels and wavefunctions as explained before, while the peak is determined similarly but using a different spectrum and eigenfunctions . Consequently, the spacing depends now on both and .
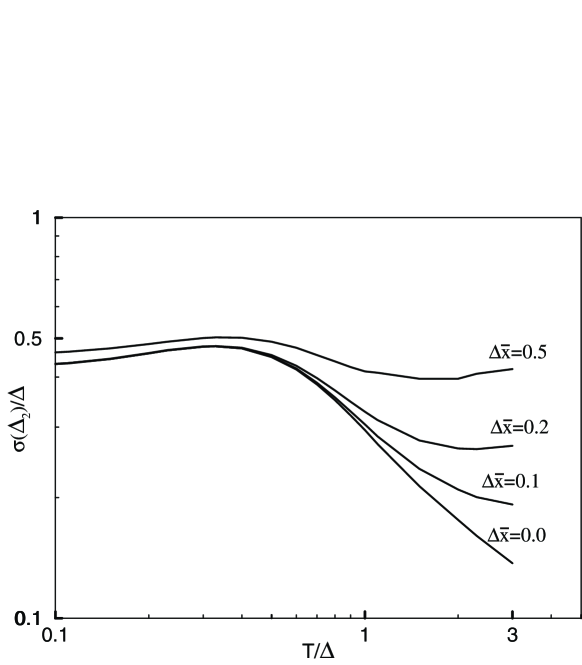
Fig. 4 shows the standard deviation of the GUE peak spacing distribution as a function of (on a log-log scale) for several values of the “scrambling” parameter . As for the case, we observe a decrease above , except that the decrease is more moderate. It would be interesting to see whether this signature of spectral scrambling can be observed experimentally.
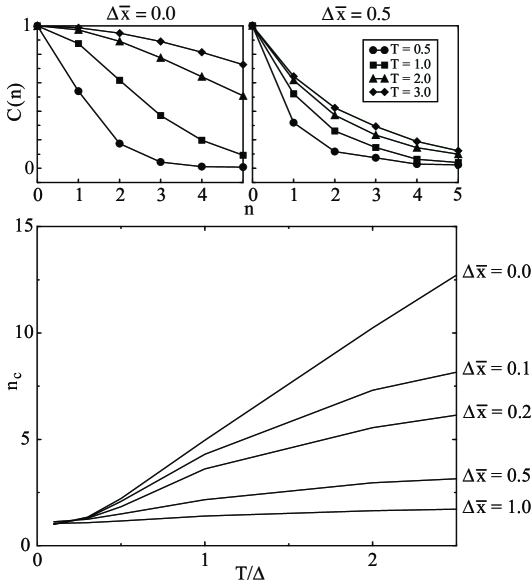
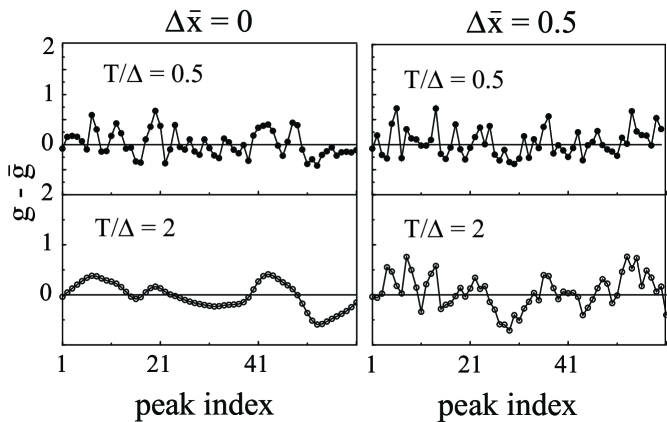
Another quantity that is sensitive to spectral scrambling is the peak-to-peak correlator, which is characterized by its full width at half maximum (FWHM), i.e., the number of correlated peaks . For a constant single-particle spectrum, is found to increase linearly with temperature since the number of levels contributing to a given peak is . However, for a changing spectrum the number of correlated peaks is expected to saturate (as a function of temperature) at a value that measures the number of electrons needed to scramble the spectrum completely. This effect was observed in the experiment [6]. It can be calculated quantitatively by using the Gaussian process (4) [15]. For each value of and , the peak-to-peak correlations are determined universally. The top left panel of Fig. 4 shows the calculated peak-to-peak correlator at several temperatures for a constant spectrum (i.e., ), where the correlator width is seen to increase with temperature. The right inset shows the correlator for the same temperatures but for a changing spectrum , where its width is seen to saturate at higher temperatures. The bottom panel of Fig. 4 shows the number of correlated peaks versus for several values of . saturates at a smaller value of as gets larger, i.e., when the single-particle spectrum scrambles faster. To further illustrate this effect, we show in Fig. 4 the peak height fluctuation for a series of peaks using one realization of the GP (4) at and . For a fixed spectrum () we observe a significant increase of the correlations at the higher temperature (left panels), while for a changing spectrum () the correlations do not change much with temperature (right panels).
Experimentally it was found that, in a smaller dot, saturates at a smaller value [6]. This suggests faster scrambling (i.e., larger ) in the smaller dot. We can derive an expression for the scrambling parameter in terms of the dot’s properties by relating the parametric approach to the microscopic HF-RPA approach of [12]. In the latter the fluctuations in the variation of the -th level upon the addition of an electron (see Eq. (3)) are dominated by charge that is pushed to the surface, and are estimated to be , where is the dimensionless Thouless conductance. In the parametric approach we find, using perturbation theory [19], . Comparing the two expression for we obtain
| (5) |
The symmetry class parameter drops out in this relation. Indeed we expect to depend only on the dot’s properties irrespective of the presence or absence of a magnetic field. Relation (5) is valid in the regime where is linear in , i.e., for (see Fig. 2 of Ref. [13]). The second estimate in (5) is for a ballistic dot where . Relation (5) confirms that is larger for the dot with a smaller number of electrons. Notice the qualitative similarity between the theoretical results of Fig. 4 and the experimental results in Fig. 2 of Ref. [6].
In conclusion, we used the statistical theory of Coulomb blockade quantum dots to calculate the temperature-dependence of the peak spacing fluctuations. Statistical scrambling of the spectrum upon adding an electron to the dot affects the temperature-dependence of both the peak spacing fluctuations and the peak-to-peak correlator.
This work was supported in part by the Department of Energy grant No. DE-FG-0291-ER-40608.
REFERENCES
- [1] L.P. Kouwenhoven et al., in Mesoscopic electron transport, edited by L. L. Sohn, L. P. Kouwenhoven, G. Schoen (NATO Series, Kluwer, Dordrecht, 1997).
- [2] R.A. Jalabert, A.D. Stone, and Y. Alhassid, Phys. Rev. Lett. 68, 3468 (1992).
- [3] A.M. Chang et al., Phys. Rev. Lett. 76, 1695 (1996).
- [4] J.A. Folk et al., Campman and A.C. Gossard, Phys. Rev. Lett. 76, 1699 (1996).
- [5] Y. Alhassid, M. Gökçedağ and A.D. Stone, Phys. Rev. B 58, R 7524, 1998.
- [6] S.R. Patel et al., Phys. Rev. Lett. 81, 5900 (1998).
- [7] U. Sivan et al., Phys. Rev. Lett. 77, 1123 (1996).
- [8] F. Simmel, T. Heinzel and D. A. Wharam, Europhys. Lett. 38, 123 (1997).
- [9] S.R. Patel et al., Phys. Rev. Lett. 80, 4522 (1998).
- [10] F. Simmel em et al., Phys. Rev. B 59, R 10441 (1999).
- [11] R. Berkovits, Phys. Rev. Lett. 81, 2128, 1998.
- [12] Ya. M. Blanter, A.D. Mirlin, and B.A. Muzykantskii, Phys. Rev. Lett. 78, 2449 (1997).
- [13] H. Attias and Y. Alhassid, Phys. Rev. E 52, 4476 (1995).
- [14] R.O. Vallejos, C. H. Lewenkopf and E. R. Mucciolo, Phys. Rev. Lett. 81, 677, 1998.
- [15] S. Malhotra and Y. Alhassid, Proc. Int. Conf. Dynamics of Complex Systems, Dresden, May 10 – 15 (1999).
- [16] C.W.J. Beenakker, Phys. Rev. B 44, 1646 (1991).
- [17] S. Levit and D. Orgad, Phys. Rev. B 60, 5549 (1999); P.N. Walker, G. Montambaux and Y. Gefen, Phys. Rev. B 60, 2541 (1999); A. Cohen, K. Richter and R. Berkovits, Phys. Rev. B 60, 2536 (1999).
- [18] M. Wilkinson, J. Phys. A 22, 2795 (1989); E.A. Austin and M. Wilkinson, Nonlinearity 5, 1137 (1992).
- [19] Y. Alhassid and H. Attias, Phys. Rev. Lett. 74, 4635 (1995).
- [20] B.D. Simons and B.L. Altshuler, Phys. Rev. Lett. 70, 4063 (1993).