A tetragonal-to-monoclinic phase transition in a ferroelectric perovskite: the structure of PbZr0.52Ti0.48O3.
Abstract
The perovskite-like ferroelectric system PbZr1-xTixO3 (PZT) has a nearly vertical morphotropic phase boundary (MPB) around x= 0.45-0.50. Recent synchrotron x-ray powder diffraction measurements by Noheda et al. have revealed a new monoclinic phase between the previously-established tetragonal and rhombohedral regions. In the present work we describe a Rietveld analysis of the detailed structure of the tetragonal and monoclinic PZT phases on a sample with x= 0.48 for which the lattice parameters are respectively: at= 4.044 Å, ct= 4.138 Å, at 325 K, and am= 5.721 Å, bm= 5.708 Å, cm= 4.138 Å, = 90.496o, at 20K. In the tetragonal phase the shifts of the atoms along the polar direction are similar to those in PbTiO3 but the refinement indicates that there are, in addition, local disordered shifts of the Pb atoms of 0.2 Å perpendicular to the polar axis. The monoclinic structure can be viewed as a condensation along one of the 110 directions of the local displacements present in the tetragonal phase. It equally well corresponds to a freezing-out of the local displacements along one of the 100 directions recently reported by Corker et al. for rhombohedral PZT. The monoclinic structure therefore provides a microscopic picture of the MPB region in which one of the “locally” monoclinic phases in the “average” rhombohedral or tetragonal structures freezes out, and thus represents a bridge between these two phases.
pacs:
77.84.Dy; 77.84.-s; 61.10.-iI Introduction
Perovskite-like oxides have been at the center of research on ferroelectric and piezoelectric materials for the past fifty years because of their simple cubic structure at high temperatures and the variety of high symmetry phases with polar states found at lower temperatures. Among these materials the ferroelectric PbZr1-xTixO3 (PZT) solid solutions have attracted special attention since they exhibit an unusual phase boundary which divides regions with rhombohedral and tetragonal structures, called the “morphotropic phase boundary” (MPB) by Jaffe et al.[1]. Materials in this region exhibit a very high piezoelectric response, and it has been conjectured that these two features are intrinsically related. The simplicity of the perovskite structure is in part responsible for the considerable progress made recently in the determination of the basic structural properties and stability of phases of some important perovskite oxides, based on ab-initio calculations (see, e.g., [2, 3, 4, 5, 6, 7, 8, 9]). Recently, such calculations have also been used to investigate solid solutions and, in particular, PZT, where the effective Hamiltonian includes both structural and compositional degrees of freedom [10, 11, 12] .
The PZT phase diagram of Jaffe et al. [1], which covers only temperatures above 300 K, has been accepted as the basic characterization of the PZT solid solution. The ferroelectric region of the phase diagram consists mainly of two different regions: the Zr-rich rhombohedral region, (FR) that contains two phases with space groups R3m and R3c, and the Ti-rich tetragonal region (FT), with space group P4mm[13]. The two regions are separated by a boundary that is nearly independent of temperature, the MPB mentioned above, which lies at a composition close to x= 0.47. Many structural studies have been reported around the MPB, since the early 1950’s, when these solid solutions were first studied[13, 14], since the high piezoelectric figure-of-merit that makes PZT so extraordinary is closely associated with this line [1, 15] .The difficulty in obtaining good single crystals in this region, and the characteristics of the boundary itself, make good compositional homogeneity essential if single phase ceramic materials are to be obtained. Because of this, the MPB is frequently reported as a region of phase-coexistence whose width depends on the sample processing conditions[16, 17, 18, 19].
Recently, an entirely new feature of the morphotropic phase boundary has been revealed by the discovery of a new ferroelectric monoclinic phase (FM) in the Pb(Zr1-xTix)O3 ceramic system[20]. From a synchrotron x-ray powder diffraction study of a composition with x=0.48, a tetragonal-to-monoclinic phase transition was discovered at 300 K. The monoclinic unit cell is such that am and bm lay along the tetragonal and directions (a b a2), and cm deviates slightly from the [001] direction (c ct)[21] . The space group is Cm, and the temperature dependence of the monoclinic angle gives immediately the evolution of the order parameter for the tetragonal-monoclinic (FT-FM) transition. The polar axis of the monoclinic cell can in principle be directed along any direction within the ac mirror plane, making necessary a detailed structural study to determine its direction.
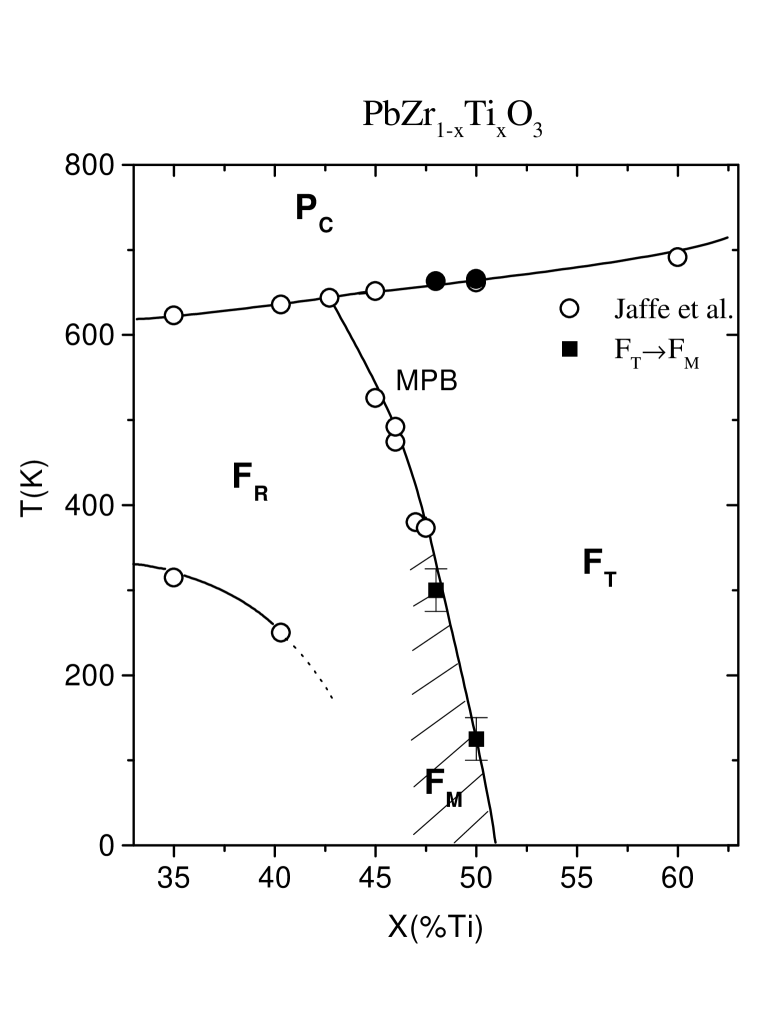
In the present work we present such a detailed structure determination of the monoclinic phase at 20 K and the tetragonal phase at 325 K in PZT with x= 0.48. The results show that the polarization in the monoclinic plane lies along a direction between the pseudo-cubic [001]c and [111]c directions, corresponding to the first example of a species with P= P P. A tentative phase diagram is presented in Figure 1, which includes data for the x= 0.48 composition together with those of the recently-studied x= 0.50 composition [22]. The most striking finding, however, is that the monoclinic cation displacements found here correspond to one of the three locally disordered sites reported by Corker et al. [23] for rhombohedral compositions in the region x= 0.1-0.4, and thus provide a microscopic model of the rhombohedral-to-monoclinic phase transition. This, together with the fact that the space group of the new phase, Cm, is a subgroup of both P4mm and R3m, suggests that FM represents an intermediate phase connecting the well-known FT and FR PZT phases.
II Experimental
A PZT sample with x= 0.48 was prepared by conventional solid-state reaction techniques using appropriate amounts of reagent-grade powders of lead carbonate, zirconium oxide and titanium oxide, with chemical purities better than 99.9. Pellets were pressed and heated to 1250oC at a ramp rate of 10oC/min, held at this temperature in a covered crucible for 2 hours, and furnace-cooled. During sintering, PbZrO3 was used as a lead source in the crucible to minimize volatilization of lead.
High-resolution synchrotron x-ray powder diffraction measurements were made at beam line X7A at the Brookhaven National Synchrotron Light Source. In the first set of measurements, an incident beam of wavelength 0.6896 Å from a Ge(111) double-crystal monochromator was used in combination with a Ge(220) crystal and scintillation detector in the diffraction path. The resulting instrumental resolution is about 0.01o on the 2 scale, an order-of-magnitude better than that of a laboratory instrument. Data were collected from a disk in symmetric flat-plate reflection geometry over selected angular regions in the temperature range 20-736 K. Coupled - 2 scans were performed over selected angular regions with a 2 step interval of 0.01o. The sample was rocked 1-2o during data collection to improve powder averaging.
Measurements above room temperature were performed with the disk mounted on a BN sample pedestal inside a wire-wound BN tube furnace. The furnace temperature was measured with a thermocouple mounted just below the pedestal and the temperature scale calibrated with a sample of CaF2. The accuracy of the temperature in the furnace is estimated to be within 10 K, and the temperature stability about 2 K. For low temperature measurements, the pellet was mounted on a Cu sample pedestal and loaded in a closed-cycle He cryostat, which has an estimated temperature accuracy of 2 K and stability better than 0.1 K. The diffracted intensities were normalized with respect to the incident beam monitor.
For the second set of measurements aimed at the detailed determination of the structure, a linear position-sensitive detector was mounted on the 2 arm of the diffractometer instead of the crystal analyzer, and a wavelength of 0.7062 Å was used. This configuration gives greatly-enhanced counting rates which make it feasible to collect accurate data from very narrow-diameter capillary samples in Debye-Scherrer geometry, with the advantage that systematic errors due to preferred orientation or texture effects are largely eliminated. A small piece of the sintered disk was carefully crushed and sealed into a 0.2 mm diameter glass capillary. The latter was loaded into a closed-cycle cryostat, and extended data sets were collected at 20 and 325 K while the sample was rocked over a 10o range. With this geometry the instrumental resolution is about 0.03o on the 2 scale. Because lead is highly absorbing, the data were corrected for absorption effects[24] based on an approximate value of determined from the weight and dimensions of the sample.
III Phase transitions
The evolution of the lattice parameters with temperature was briefly summarized in ref.[20], and a more complete analysis is presented below. The results of the full structure analysis are described later.
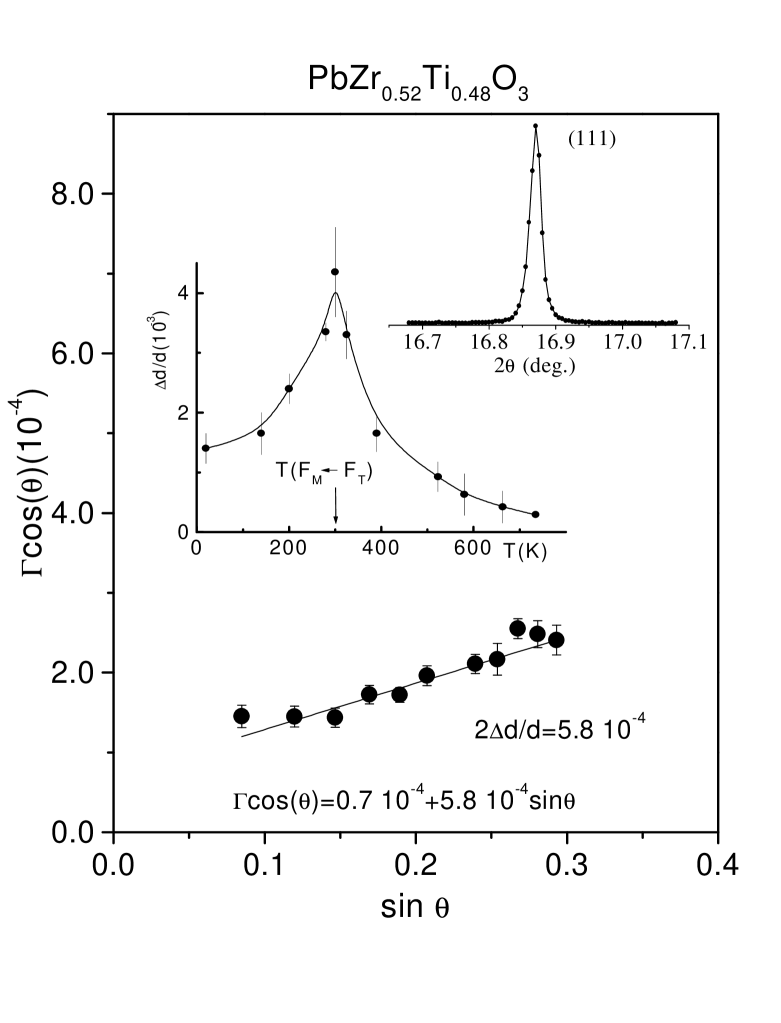
A transition from the cubic to the tetragonal phase was observed at 660 K, in agreement with the phase diagram shown in Fig. 1. The measurements made on the pellet in the cubic phase at 736 K demonstrate the excellent quality of the sample, which exhibits diffraction peaks with full-widths at half-maximum (FWHM) ranging from 0.01 to 0.03o as shown for the (111) reflection plotted as the upper-right inset in Fig. 2. The FWHM’s () for several peaks were determined from least-squares fits to a pseudo-Voigt function with the appropriate corrections for asymmetry effects [25], and corrected for instrumental resolution. The corrected values are shown in Fig. 2 in the form of a Williamson-Hall plot [26]
| (1) |
where is the wavelength and is the mean crystallite size. From the slope of a linear fit to the data, the distribution of d-spacings, d/d, is estimated to be , corresponding to a compositional inhomogeneity x of less than 0.003. From the intercept of the line on the ordinate axis the mean crystallite size is estimated to be 1 m.
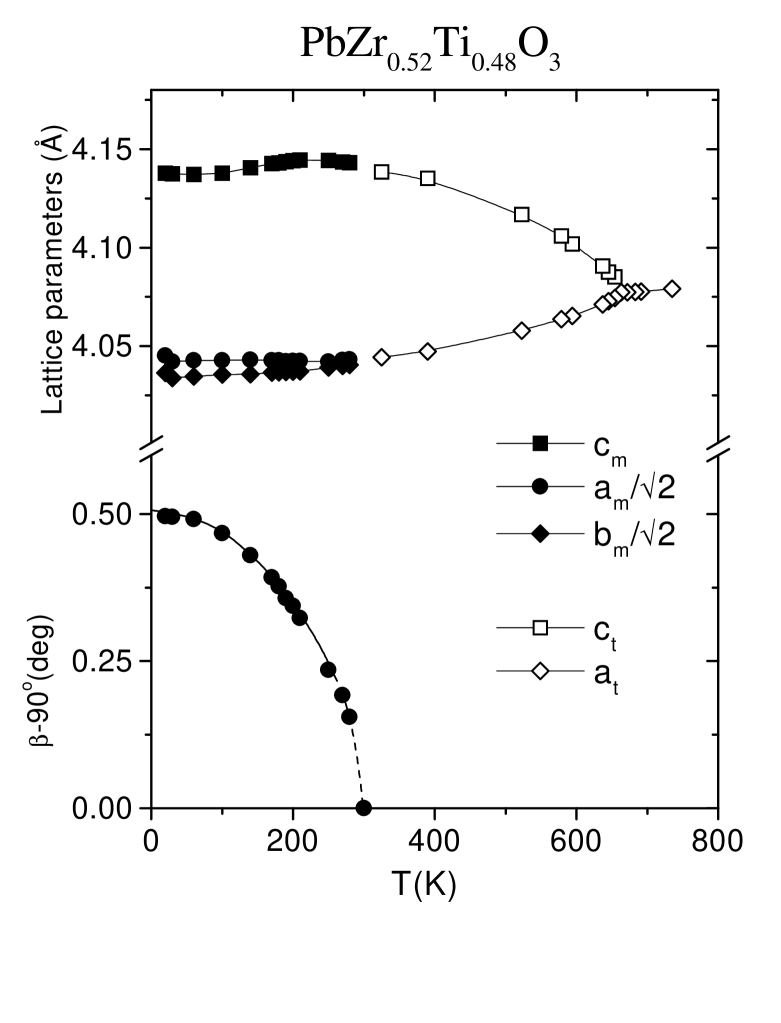
A tetragonal-to-monoclinic phase transition in PZT with x= 0.48 was recently reported by Noheda et al.[20]. Additional data have been obtained near the phase transition around 300 K which have allowed a better determination of the phase transition to be made, as shown by the evolution of the lattice parameters as a function of temperature in Figure 3. The tetragonal strain, ct/at, increases as the temperature decreases from the Curie point (T 660K), to a value of 1.0247 at 300 K, below which peak splittings characteristic of a monoclinic phase with a b a , , are observed (Figure 3). As the temperature continues to decrease down to 20 K, am (which is defined to lie along the [0] tetragonal direction) increases very slightly, and bm (which lies along the [10] tetragonal direction) decreases. The cm lattice parameter reaches a broad maximum value of 4.144 Å between 240-210 K and then reaches a shallow minimum value of 4.137 Å at 60 K. Over the same temperature region there is a striking variation of d/d determined from Williamson-Hall plots at various temperatures, as shown in the upper-left inset in Fig. 2. d/d increases rapidly as the temperature approaches the FT-FM transition at 300K, in a similar fashion to the tetragonal strain, and then decreases rapidly below this temperature in the monoclinic region. Thus the microstrain responsible for the large increase in d/d is an important feature of the phase transition, which may be associated with the development of local monoclinic order, and is very likely responsible for the large electromechanical response of PZT close to the MPB [1].
The deviation of the monoclinic angle from 90o is an order parameter of the FT-FM transition, and its evolution with temperature is also depicted in Figure 3. This phase transition presents a special problem due to the steepness of the phase boundary (the MPB in Fig. 1). As shown in the previous section, the compositional fluctuations are quite small in these ceramic samples (x 0.003) but, even in this case, the nature of the MPB implies an associated temperature uncertainty of T 100 K. There is, therefore, a rather wide range of transition temperatures instead of a single well-defined transition, so that the order parameter is smeared out as a function of temperature around the phase change, thereby concealing the nature of the transition.
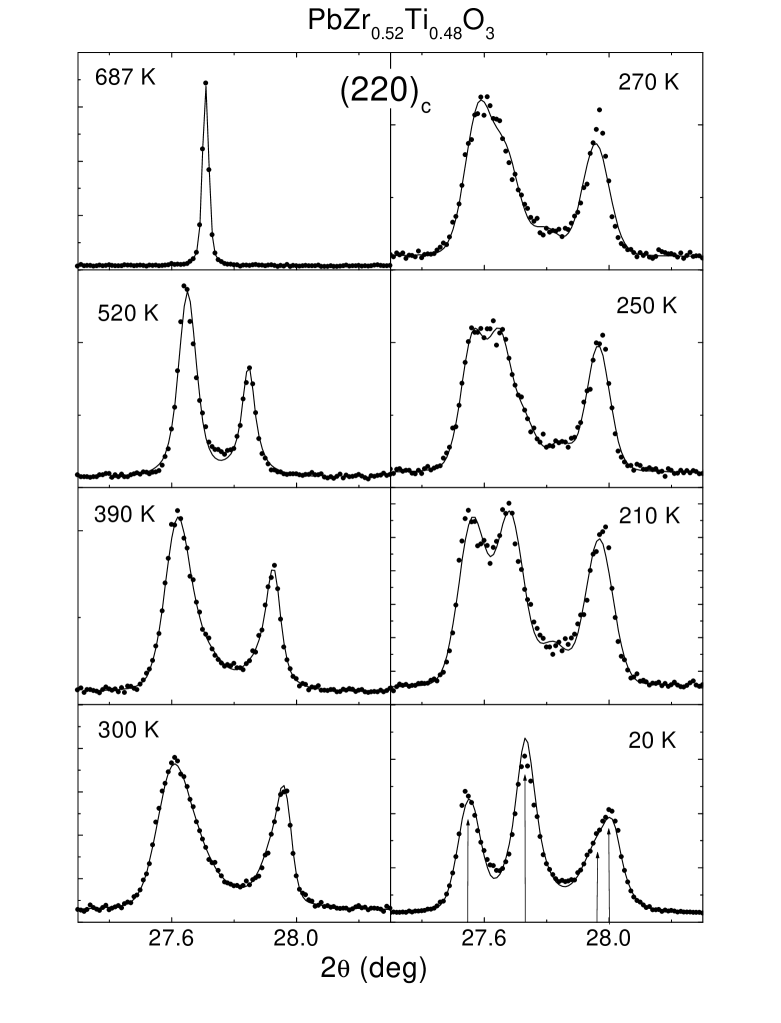
Scans over the (220)c region for several different temperatures are plotted in Figure 4, which shows the evolution of phases from the cubic phase at 687 K (upper-left plot) to the monoclinic phase at 20 K (lower-right plot), passing through the tetragonal phase at intermediate temperatures. With decreasing temperature, the tetragonal phase appears at 660 K and the development of the tetragonal distortion can be observed on the left side of the figure from the splitting of the (202)t and (220)t reflections. On the right side of the figure, the evolution of the monoclinic phase, which appears below 300 K, is shown by the splitting into the (22)m, (222)m, (400)m and (040)m monoclinic reflections. It is quite evident from Fig. 4 that the (202)t peak is much broader than the neighboring (220)t peak, for example, and this “anisotropic” peak broadening is a general feature of the diffraction data for both phases. Another feature of the patterns is the presence of additional diffuse scattering between neighboring peaks, which is particularly evident between tetragonal (00l) and (h00) pairs, and the corresponding monoclinic (00l) and (hh0) pairs.
IV Structure determination
A detailed analysis of the 325 K tetragonal and 20 K monoclinic structures of PbZr0.52Ti0.48O3 was carried out by Rietveld refinement using the GSAS program package [27]. The pseudo-Voigt peak shape function option was chosen[25] and background was estimated by linear interpolation between fixed values. An important feature of the refinements was the need to allow for the anisotropic peak broadening mentioned above. This was accomplished by the use of the recently-incorporated generalized model for anisotropic peak broadening proposed by Stephens[28], which is based on a distribution of lattice parameters. It was also necessary to take into account some additional diffuse scattering by modeling with a second, cubic, phase with broad, predominately Gaussian, peaks. A similar strategy has been adopted by Muller et al.[29] in a recent study of PbHf0.4Ti0.6O3. Although in principle this could represent a fraction of untransformed cubic phase, we suspect that the diffuse scattering is associated with locally disordered regions in the vicinity of domain walls. The refinements were carried out with the atoms assigned fully-ionized scattering factors.
A
Tetragonal structure at 325 K
At 325 K the data show tetragonal symmetry similar to that of PbTiO3. This tetragonal structure has the space group P4mm with Pb in 1(a) sites at (0, 0, z); Zr/Ti and O(1) in 1(b) sites at (1/2, 1/2, z) and O in 2(c) sites at (1/2, 0, z). For the refinement we adopt the same convention as that used in refs.[30] and [31] for PbTiO3, with Pb fixed at (0,0,0). However, instead of thinking in terms of shifts of the other atoms with respect to this origin, it is more physically intuitive to consider displacements of Pb and Zr/Ti from the center of the distorted oxygen cuboctahedra and octahedra, respectively. We shall take this approach in the subsequent discussion.
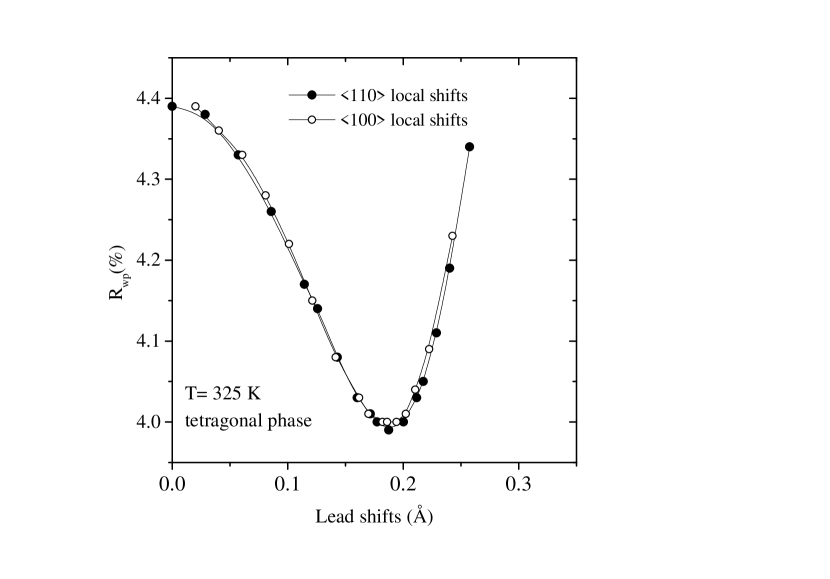
The refinement was first carried out with individual isotropic (Uiso) temperature factors assigned. Although a reasonably satisfactory fit was obtained (R= 8.9%), Uiso for O(1) was slightly negative and Uiso for Pb was very large, 0.026 Å2, much larger than Uiso for the other atoms. Similarly high values for Pb(Uiso) in Pb-based perovskites are well-known in the literature, and are usually ascribed to local disordered displacements, which may be either static or dynamic. Refinement with anisotropic temperature factors [32] (U11 and U33) assigned to Pb (Table I, model I) gave an improved fit (R= 6.1%) with U11(= U22) considerably larger than U33 (0.032 and 0.013 Å2, respectively) corresponding to large displacements perpendicular to the polar [001] axis. A further refinement based on local displacements of the Pb from the 1(a) site to the 4(d) sites at (x,x,0), with isotropic temperature factors assigned to all the atoms, gave a small improvement in the fit ( R= 6.0%) with x, corresponding to local shifts along the 110 axes, and a much more reasonable temperature factor (Table I, model II). In order to check that high correlations between the temperature factor and local displacements were not biasing the result of this refinement, we have applied a commonly-used procedure consisting of a series of refinements based on Model II in which Pb displacements along 110 were fixed but all the other parameters were varied [34, 35]. Fig. 5 shows unambiguously that there is well-defined minimum in the R-factor for a displacement of about 0.19 Å, consistent with the result in Table I. A similar minimum was obtained for shifts along 100 directions with a slightly higher R-factor. Thus, in addition to a shift of 0.48 Å for Pb along the polar [001] axis towards four of its O(2) neighbors, similar to that in PbTiO3[30, 31, 36], there is a strong indication of substantial local shifts of 0.2 Å perpendicular to this axis. The Zr/Ti displacement is 0.27 Å along the polar axis, once again similar to the Ti shift in PbTiO3. Attempts to model local displacements along 110 directions for the Zr/Ti atoms were unsuccessful due to the large correlations between these shifts and the temperature factor. Further attempts to refine the z parameters of the Zr and Ti atoms independently, as Corker et al. were able to do[23], were likewise unsuccessful, presumably because the scattering contrast for x-rays is much less than for neutrons.
From the values of the atomic coordinates listed in Table I, it can be inferred that the oxygen octahedra are somewhat more distorted than in PbTiO3, the O(1) atoms being displaced 0.08 Å towards the O(2) plane above. The cation displacements are slightly larger than those recently reported by Wilkinson et al. [37] for samples close to the MPB containing a mixture of rhombohedral and tetragonal phases, and in excellent agreement with the theoretical values obtained by L. Bellaiche and D. Vanderbilt [38] for PZT with x= 0.50 from first principles calculations. As far as we are aware no other structural analysis of PZT compositions in the tetragonal region has been reported in the literature.
Selected bond distances for the two models are shown in Table II. For model I, Zr/Ti has short and long bonds with O(1) of 1.85 and 2.29 Å, respectively, and four intermediate-length O(2) bonds of 2.05 Å. There are four intermediate-length Pb-O(1) bonds of 2.89 Å, four short Pb-O(2) bonds of 2.56 Å and four much larger Pb-O(2) distances of 3.27 Å. For model II, the Zr/Ti-O distances are the same, but the Pb-O distances change significantly. A Pb atom in one of the four equivalent (x,x,0) sites in Table I now has a highly distorted coordination, consisting of two short and two intermediate Pb-O(2) bonds of 2.46 and 2.67 Å, and one slightly longer Pb-O(1) bond of 2.71 Å (Table II). The tendency of Pb+2, which has a lone sp electron pair, to form short covalent bonds with a few neighboring oxygens is well documented in the literature[23, 39, 40, 41].
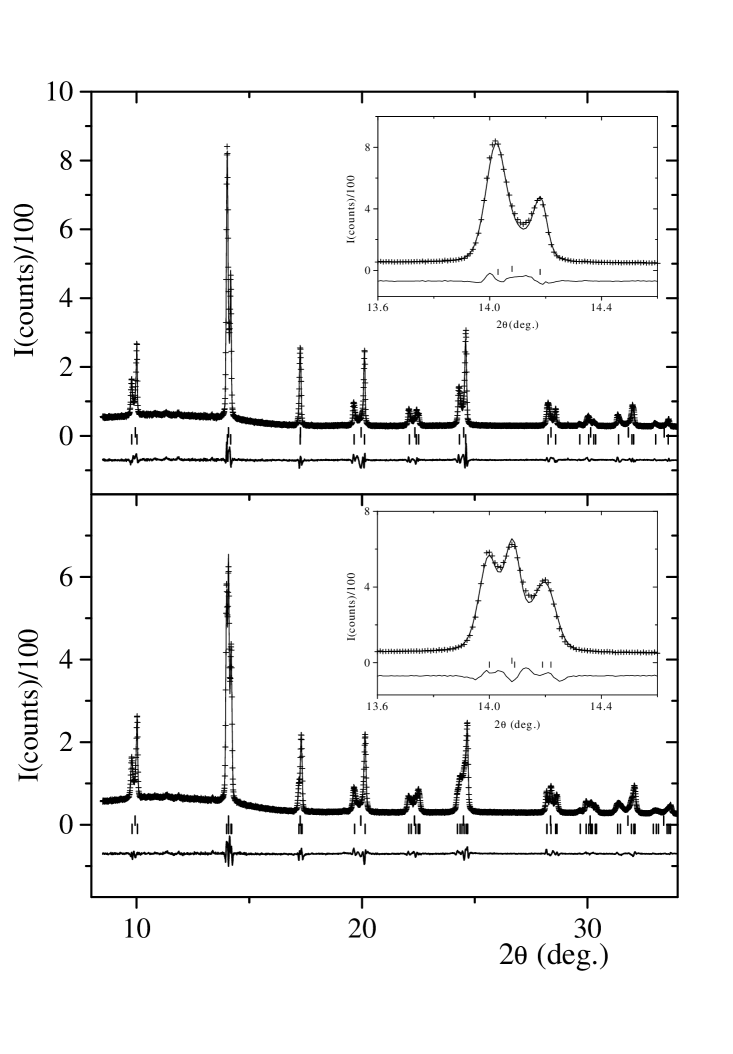
The observed and calculated diffraction profiles and the difference plot are shown in Figure 6 for a selected range between 7 and 34∘ (upper figure). The short vertical markers represent the calculated peak positions. The upper and lower sets of markers correspond to the cubic and tetragonal phases, respectively. We note that although agreement between the observed and the calculated profiles is considerably better when the diffuse scattering is modeled with a cubic phase, the refined values of the atomic coordinates are not significantly affected by the inclusion of this phase. The anisotropic peak broadening was found to be satisfactorily described by two of the four parameters in the generalized model for tetragonal asymmetry[28].
B
Monoclinic structure at 20 K
As discussed above, the diffraction data at 20 K can be indexed unambiguously on the basis of a monoclinic cell with space group Cm. In this case Pb, Zr/Ti and O(1) are in 2(a) sites at (x, 0, z), and O(2) in 4(b) sites at (x, y, z). Individual isotropic temperature factors were assigned, and Pb was fixed at (0,0,0). For monoclinic symmetry, the generalized expression for anisotropic peak broadening contains nine parameters, but when all of these were allowed to vary the refinement was slightly unstable and did not completely converge. After several tests in which some of the less significant values were fixed at zero, satisfactory convergence was obtained with 3 parameters ( , ). During these tests, there was essentially no change in the refined values of the atomic coordinates. A small improvement in the fit was obtained when anisotropic temperature factors were assigned to Pb ( ). The final results are listed in Table III, and the profile fit and difference plot are shown in the lower part of Fig. 6.
From an inspection of the results in Tables I and III, it can be seen that the displacements of the Pb and Zr/Ti atoms along [001] are very similar to those in the tetragonal phase at 325 K, about 0.53 and 0.24Å, respectively. However, in the monoclinic phase at 20 K, there are also significant shifts of these atoms along the monoclinic [00], i.e. pseudo-cubic , towards their O(2) neighbors in adjacent pseudo-cubic (110) planes, of about 0.24 and 0.11 Å, respectively, which corresponds to a rotation of the polar axis from [001] towards pseudo-cubic [111]. The Pb shifts are also qualitatively consistent with the local shifts of Pb along the tetragonal axes inferred from the results of model II in Table I, i.e. about 0.2 Å. Thus it seems very plausible that the monoclinic phase results from the condensation of the local Pb displacements in the tetragonal phase along one of the 110 directions.
Some selected bond distances are listed in Table II. The Zr/Ti-O(1) distances are much the same as in the tetragonal structure, but the two sets of Zr/Ti-O(2) distances are significantly different, 1.96 and 2.13 Å, compared to the single set at 2.04 Å in the tetragonal structure. Except for a shortening in the Pb-O(1) distance from 2.71 to 2.60 Å, the Pb environment is quite similar to that in the tetragonal phase, with two close O(2) neighbors at 2.46 Å, and two at 2.64 Å.
V Discussion
In the previous section, we have shown that the low-temperature monoclinic structure of PbZr0.52Ti0.48O3 is derived from the tetragonal structure by shifts of the Pb and Zr/Ti atoms along the tetragonal [110] axis. We attribute this phase transition to the condensation of local 110 shifts of Pb which are present in the tetragonal phase along one of the four 110 directions. In the context of this monoclinic structure it is instructive to consider the structural model for rhombohedral PZT compositions with x= 0.08-0.38 recently reported by Corker el al.[23] on the basis of neutron powder diffraction data collected at room temperature. In this study and also an earlier study[42] of a sample with x= 0.1, it was found that satisfactory refinements could only be achieved with anisotropic temperature factors, and that the thermal ellipsoid for Pb had the form of a disk perpendicular to the pseudo-cubic [111] axis. This highly unrealistic situation led them to a physically much more plausible model involving local displacements for the Pb atoms of about 0.25 Å perpendicular to the [111] axis and a much smaller and more isotropic thermal ellipsoid. Evidence for local shifts of Pb atoms in PZT ceramics has also been demonstrated by pair-distribution function analysis by Teslic and coworkers[39].
We now consider the refined values of the Pb atom positions with local displacements for rhombohedral PZT listed in Table 4 of ref.[23]. With the use of the appropriate transformation matrices, it is straightforward to show that these shifts correspond to displacements of 0.2-0.25 Å along the direction of the monoclinic [100] axis, similar to what is actually observed for x= 0.48. It thus seems equally plausible that the monoclinic phase can also result from the condensation of local displacements perpendicular to the [111] axis.
The monoclinic structure can thus be pictured as providing a “bridge” between the rhombohedral and tetragonal structures in the region of the MPB. This is illustrated in Table IV, which compares the results for PZT with x=0.48 obtained in the present study with earlier results[43] for rhombohedral PZT with x= 0.40 expressed in terms of the monoclinic cell[44]. For x= 0.48, the atomic coordinates for Zr/Ti, O(1) and O(2) are listed for the “ideal” tetragonal structure (model I) and for a similar structure with local shifts of (0.03, 0.03, 0) in the first two columns, and for the monoclinic structure in the third column. The last two columns describe the rhombohedral structure for x= 0.40 assuming local shifts of (-0.02, 0.02, 0) along the hexagonal axes and the as-refined “ideal” structure, respectively. It is clear that the condensation of these local shifts gives a very plausible description of the monoclinic structure in both cases. It is also interesting to note the behavior of the corresponding lattice parameters; metrically the monoclinic cell is very similar to the tetragonal cell except for the monoclinic angle, which is close to that of the rhombohedral cell.
Evidence for a tetragonal-to-monoclinic transition in the ferroelectric material PbFe0.5Nb0.5O3 has also been reported by Bonny et al.[45] from single crystal and synchrotron x-ray powder diffraction measurements. The latter data show a cubic-tetragonal transition at 376K, and a second transition at 355K. Although the resolution was not sufficient to reveal any systematic splitting of the peaks, it was concluded that the data were consistent with a very weak monoclinic distortion of the pseudo-rhombohedral unit cell. In a recent neutron and x-ray powder study, Lampis et al. [46] have shown that Rietveld refinement gives better agreement for the monoclinic structure at 80 and 250 K than for the rhombohedral one. The resulting monoclinic distortion is very weak, and the large thermal factor obtained for Pb is indicative of a high degree of disorder.
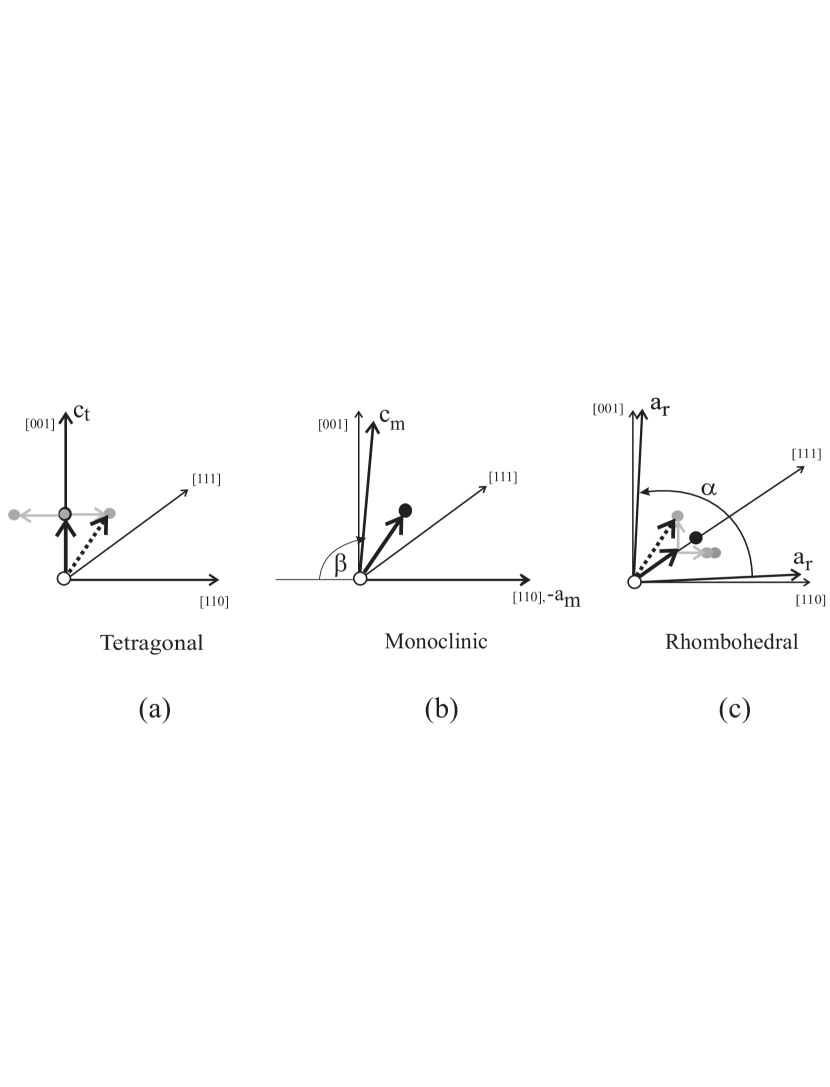
The relationships between the PZT rhombohedral, tetragonal and monoclinic structures are also shown schematically in Figure 7, in which the displacements of the Pb atom are shown projected on the pseudo-cubic (110) mirror plane. The four locally disordered shifts postulated in the present paper for the tetragonal phase are shown superimposed on the [001] shift at the left (Fig.7a) and the three locally disordered shifts proposed by Corker et al.[23] for the rhombohedral phase are shown superimposed on the [111] shift at the right (Fig. 7c). It can be seen that both the condensation of the [110] shift in the tetragonal phase and the condensation of the [001] shift in the rhombohedral phase leads to the observed monoclinic shift shown at the center (Fig. 7b). We note that although Corker et al. discuss their results in terms of shifts and a [111] shift smaller than that predicted in the usual refinement procedure, they can be equally well described by a combination of shifts perpendicular to the [111] axis and the [111] shift actually obtained in the refinement, as is evident from Fig. 7c.
We conclude, therefore, that the FM phase establishes a connection between the PZT phases at both sides of the MPB through the common symmetry element, the mirror plane, and suggest that there is not really a morphotropic phase boundary, but rather a “morphotropic phase”, connecting the FT and FR phases of PZT.
In the monoclinic phase the difference vector between the positive and negative centers of charge defines the polar axis, whose orientation, in contrast to the case of the FT and FR phases, cannot be determined on symmetry grounds alone. According to this, from the results shown in Table III, the polar axis in the monoclinic phase is found to be tilted about 24o from the [001] axis towards the [111] axis. This structure represents the first example of a ferroelectric material with P= P P, (Px, Py, Pz) being the Cartesian components of the polarization vector. This class corresponds to the so-called m3m(12)A2Fm type predicted by Shuvalov [47]. It is possible that this new phase is one of the rare examples of a two-dimensional ferroelectric [48] in which the unit cell dipole moment switches within a plane containing the polar axis, upon application of an electric field.
This new FM phase has important implications; for example, it might explain the well-known shifts of the anomalies of many physical properties with respect to the MPB and thus help in understanding the physical properties in this region, of great interest from the applications point-of-view[1]. It has been found that the maximum values of d33 for rhombohedral PZT with x= 0.40 are not obtained for samples polarized along the [111] direction but along a direction close to the perovskite [001] direction [49]. This points out the intrinsic importance of the [001] direction in perovskites, whatever the distortion present, and is consistent with Corker et al.’s model for the rhombohedral phase[23], and the idea of the rhombohedral-tetragonal transition through a monoclinic phase.
It is also to be expected that other systems with morphotropic phase boundaries between two non-symmetry-related phases (e.g., other perovskites or tungsten-bronze mixed systems) may show similar intermediate phases. In fact, an indication of symmetry lowering at the MPB of the PZN-PT system has been recently reported by Fujishiro et al. [50]. From a different point-of-view, a monoclinic ferroelectric perovskite also represents a new challenge for first-principles theorists, until now used to dealing only with tetragonal, rhombohedral and orthorhombic perovskites.
A structural analysis of several other PZT compositions with x= 0.42-0.51 is currently in progress in order to determine the new PZT phase diagram more precisely. In the preliminary version shown in Fig. 1 we have included data for a sample with x= 0.50 made under slightly different conditions[22] at the Institute of Ceramic and Glass (ICG) in Madrid, together with the data described in the present work for a sample with x= 0.48 synthesized in the Materials Research Laboratory at the Pennsylvania State University (PSU). As can be seen the results for these two compositions show consistent behavior, and demonstrate that the FM-FT phase boundary lies along Jaffe et al.’s MPB. Preliminary results for a sample from PSU with x= 0.47 show unequivocally that the monoclinic features are present at 300 K. However measurements on an ICG sample with the same nominal composition do not show monoclinicity unambiguously, but instead a rather complex poorly-defined region from 300-400K between the rhombohedral and tetragonal phases[22]. The extension of the monoclinic region and the location of the FR-FM phase boundary are still somewhat undefined, although it is clear that the monoclinic region has a narrower composition range as the temperature increases. The existence of a quadruple point in the PZT phase diagram is an interesting possibility.
Acknowledgments
We wish to gratefully acknowledge B. Jones for the excellent quality of the x= 0.48 sample used in this work, and we thank A. M. Glazer, E. Moshopoulou, C. Moure and E. Sawaguchi for their helpful comments. Support by NATO (R.C.G. 970037), the Spanish CICyT (PB96-0037) and the U.S. Department of Energy, Division of Materials Sciences (contract No. DE-AC02-98CH10886) is also acknowledged.
| Model I | Model II | |||||||
| anisotropic lead temperature factors | local 110 lead shifts | |||||||
| x | y | z | U(Å2) | x | y | z | Uiso(Å2) | |
| Pb | 0 | 0 | 0 | U11=0.0319(4) | 0.0328(5) | 0.0328(5) | 0 | 0.0127(4) |
| U33=0.0127(4) | ||||||||
| Zr/Ti | 0.5 | 0.5 | 0.4517(7) | Uiso=0.0052(6) | 0.5 | 0.5 | 0.4509(7) | 0.0041(6) |
| O | 0.5 | 0.5 | -0.1027(28) | Uiso=0.0061(34) | 0.5 | 0.5 | -0.1027(28) | 0.0072(35) |
| O | 0.5 | 0 | 0.3785(24) | Uiso=0.0198(30) | 0.5 | 0 | 0.3786(24) | 0.0197(30) |
| Rwp | 4.00% | 3.99% | ||||||
| R | 6.11% | 6.04% | ||||||
Agreement factors, Rwp, R and are defined in ref.[[33]].
| Bond lengths (Å) | |||
| tetragonal | monoclinic | ||
| model I | model II | ||
| Zr/Ti-O(1) | 1.85 | 1.85 | 1.87 |
| 2.29 | 2.29 | 2.28 | |
| Zr/Ti-O(2) | 2.05 | 2.05 | 2.13 |
| 1.96 | |||
| Pb-O(1) | 2.89 | 2.90 | 2.90 |
| 2.71 | 2.60 | ||
| Pb-O(2) | 2.56 | 2.67 | 2.64 |
| 2.46 | 2.46 | ||
| xm | ym | zm | Uiso(Å2) | |
|---|---|---|---|---|
| Pb | 0 | 0 | 0 | 0.01391 |
| Zr/Ti | 0.5230(6) | 0 | 0.4492(4) | 0.0011(5) |
| O(1) | 0.5515(23) | 0 | -0.0994(24) | 0.0035(28) |
| O(2) | 0.2880(18) | 0.2434(20) | 0.3729(17) | 0.0123(22) |
1 For Pb, Uiso is the equivalent isotropic value
calculated from the refined anisotropic values (U11= 0.0253(7) ÅU22= 0.0106(6) ÅU33= 0.0059(3) ÅU13= 0.0052(4) Å2) .
| tetragonal | monoclinic | rhombohedral (ref.[[43]]) | |||
| x=0.48, 325 K | x=0.48, 20K | x=0.40, 295 K | |||
| ideal | local shifts1 | as refined | local shifts2 | ideal | |
| xZr/Ti | 0.500 | 0.530 | 0.523 | 0.520 | 0.540 |
| zZr/Ti | 0.451 | 0.451 | 0.449 | 0.420 | 0.460 |
| xO(1) | 0.500 | 0.530 | 0.551 | 0.547 | 0.567 |
| zO(1) | -0.103 | -0.103 | -0.099 | 0.093 | -0.053 |
| xO(2) | 0.250 | 0.280 | 0.288 | 0.290 | 0.310 |
| yO(2) | 0.250 | 0.250 | 0.243 | 0.257 | 0.257 |
| zO(2) | 0.379 | 0.379 | 0.373 | 0.393 | 0.433 |
| aÅ) | 5.722 | 5.722 | 5.787 | ||
| bÅ) | 5.722 | 5.710 | 5.755 | ||
| cÅ) | 4.139 | 4.137 | 4.081 | ||
| 90.0 | 90.50 | 90.45 | |||
1 Tetragonal local shifts of (0.03,0.03,0).
2 Hexagonal local shifts of (-0.02,0.02,0).
REFERENCES
- [1] B. Jaffe, W.R. Cook, and H. Jaffe, Piezoelectric Ceramics (Academic Press, London, 1971).
- [2] R. E. Cohen, Nature (London) 358, 136 (1992).
- [3] R.D. King-Smith and D. Vanderbilt, Phys. Rev. B 49, 5828 (1994).
- [4] W. Zhong, D. Vanderbilt, and K. Rabe, Phys. Rev. Lett. 73, 1861 (1994) and Phys. Rev. B 52, 6301 (1995).
- [5] W. Zhong and D. Vanderbilt, Phys. Rev. Lett. 74, 2587 (1995).
- [6] A. Garcia and D. Vanderbilt, Phys. Rev. B 54, 3817 (1996).
- [7] K.M. Rabe and U.W. Waghmare, Phys. Rev. B 55, 6161 (1997).
- [8] K. M. Rabe and E. Cockayne, Proceedings of the AIP Conference A 436, 61 (1998). e-print: cond-mat/9804056
- [9] Ph. Ghosez, E. Cokayne, U.V. Waghmare, and K.M. Rabe, Phys. Rev. B 60, 836 (1999).
- [10] L. Bellaiche, J. Padilla, and D. Vanderbilt, Phys. Rev. B, 59, 1834 (1999).
- [11] L. Bellaiche, J. Padilla, and D. Vanderbilt, First-principles calculations for ferroelectrics: 5th Williamsburg workshop, R. Cohen, ed. (AIP, Woodbury, New York, 1998), p.11, e-print: cond-mat/9802209.
- [12] G. Soghi-Szabo and R. E. Cohen, Ferroelectrics 194, 287 (1997).
- [13] G. Shirane and K. Suzuki. J. Phys. Soc. Japan 7, 333 (1952).
- [14] E. Sawaguchi, J. Phys. Soc. Japan 8, 615 (1953).
- [15] Y. Xu, Ferroelectric materials and their applications.(North Holland, 1991).
- [16] K. Kakewaga, O. Matsunaga, T. Kato, and Y. Sasaki, J. Amer. Ceram. Soc. 78, 1071 (1995).
- [17] J.C. Fernandes, D.A. Hall, M.R.Cockburn, and G.N. Greaves, Nucl. Instrum. and Meth. B 97, 137 (1995).
- [18] M. Hammer, C. Monty, A. Endriss, and M. J. Hoffmann, J. Amer. Ceram. Soc. 81, 721 (1998).
- [19] W. Cao and L.E. Cross, Phys. Rev. B 47, 4825 (1993).
- [20] B. Noheda, D.E. Cox, G. Shirane, J.A. Gonzalo, L.E. Cross, and S-E. Park, Appl. Phys. Lett. 74, 2059 (1999).
- [21] The [ and [1] directions are chosen so that the monoclinic angle to conform with usual crystallographic convention.
- [22] B. Noheda, J.A. Gonzalo, A.C. Caballero, C. Moure, D.E. Cox, and G. Shirane, presented at the 9th European Meeting on Ferroelectricity, Prague, July1999 (to be published in Ferroelectrics). e-print:cond-mat/9907286.
- [23] D.L. Corker, A.M. Glazer, R.W. Whatmore, A. Stallard, and F. Fauth, J. Phys.:Condens. Matter 10, 6251 (1998).
- [24] C.W. Dwiggins Jr., Acta Cryst. A 31, 146 (1975).
- [25] L.W. Finger, D.E. Cox, and A.P. Jephcoat, J. Appl. Cryst. 27, 892 (1994).
- [26] G.K. Williamson and W.H. Hall, Act. Metall. 1, 22 (1953).
- [27] A.C. Larson and R.B. Von Dreele; General Structure Analysis System. LAuR 86-748, Los Alamos National Laboratory (1994).
- [28] P.W. Stephens, J. Appl. Cryst. 32, 281 (1999).
- [29] C. Muller, J.-L. Baudour, V. Madigou, F. Bouree, J.-M. Kiat, C. Favotto, and M. Roubin, Acta Cryst. B 55, 8 (1999).
- [30] A. M. Glazer and S. A. Mabud, Acta Cryst. B 34, 1065 (1978).
- [31] R. J. Nelmes and W.F. Kuhs, Solid State Commun. 54, 721 (1985).
- [32] The structure factor correction is defined in terms of the anisotropic thermal factors as , being the lattice vectors of the reciprocal unit cell.
- [33] L.B. McCusker, R.B. von Dreele, D.E. Cox, D. Louër, and P. Scardi, J. Appl. Cryst. 32, 36 (1999).
- [34] K. Itoh, L.Z. Zeng, E. Nakamura, and N. Mishima, Ferroelectrics 63, 29 (1985).
- [35] C. Malibert, B. Dkhil, J.M. Kiat, D. Durand, J.F. Berar, and A. Spasojevic-de Bire, J.Phys.:Condens. Matter 9, 7485 (1997).
- [36] G. Shirane, R. Pepinski, and B.C. Frazer, Acta Cryst. 9, 131 (1956).
- [37] A.P. Wilkinson, J. Xu, S. Pattanaik and J.L. Billinge, Chem. Mat. 10, 3611 (1998).
- [38] L. Bellaiche and D. Vanderbilt, Phys. Rev. Lett. 83, 1347 (1999).
- [39] S. Teslic, T. Egami, and D. Viehland, J. Phys. Chem. Solids 57, 1537 (1996); Ferroelectrics 194, 271 (1997).
- [40] D.L. Corker, A.M. Glazer, W. Kaminsky, R.W. Whatmore, J. Dec , and K. Roleder, Acta Cryst. B 54, 18 (1998).
- [41] S. Teslic and T. Egami, Acta Cryst. B 54, 750 (1998).
- [42] A. M. Glazer , S. A. Mabud, and R. Clarke, Acta Cryst. B 34, 1060 (1978).
- [43] A. Amin, R.E. Newnham. L.E. Cross, D.E. Cox, J. Solid State Chem. 37, 248 (1981).
- [44] The rhombohedral unit cell can be expressed in terms of a monoclinic one by: , , where cos and and are the R3m cell parameters. Note that in ref. [37] refers to the doubled cell.
- [45] V. Bonny, M. Bonin, P. Sciau, K.J. Schenk, and G. Chapuis, Solis State Commun., 102, 347 (1997).
- [46] N. Lampis, P. Sciau, and A.G. Lehmann, J. Phys. Condens. Matter 11, 3489 (1999).
- [47] .L.A. Shuvalov, J. Phys. Soc. of Japan 28, suppl., 38 (1970).
- [48] S.C. Abrahams and E. T. Keve, Ferroelectrics 2, 129 (1971).
- [49] X-h Du, J. Zheng, U. Belegundu, and K. Uchino, Appl. Phys. Lett 72, 2421 (1998).
- [50] K. Fujishiro, R. Vlokh, Y. Uesu, Y. Yamada, J-M. Kiat, B. Dkhil, and Y. Yamashita, presented at the 9th European Meeting on Ferroelectricity, Prague, July1999 (to be published in Ferroelectrics).