Resonant inelastic x-ray scattering as a probe of optical scale excitations in strongly electron-correlated systems: quasi-localized view
Abstract
An application of resonant inelastic x-ray scattering technique for studying of optical scale excitations in electron-correlated materials is discussed. Examples are given including data obtained for transition metal, lanthanide, and actinide systems. In some cases, the data are compared with the results of crystal-field multiplet and Anderson impurity model calculations. Advantages of this technigue are pointed out, such as an ability to probe an extended multiplet structure of the ground state configuration, which is not fully accessible by other spectroscopies, an extreme sensitivity of spectral profiles to the chemical state of the element in question and to the crystal-field strength, and a great potential in probing the ground state character (for example, ground state -mixing in rare-earths) due to the technique’s elemental selectivity and strict selection rules. Issues are addressed, such as a possible deviations from the linear dispersion of inelastic scattering structures, corresponding to charge-transfer excitations, with varying excitation energies and an estimation of values for model parameters, involved in the description of charge-transfer processes.
1 Technique and models
To successfully describe various physical properties of a system in question it is necessary to obtain knowledge about the ground state and low-energy excited states of this system. For 3 transition element, lanthanide, and actinide compounds with a partly filled or shell, strong correlation effects, when the dispersional part of or bandwidth is smaller than the on-site Coulomb interaction between localized electrons, break down a single-particle picture and an atomic-like approach to characterize the electronic structure of these compounds is more appropriate.
In this case a state of the system without a core hole is described in terms of intra-atomic neutral excitations (a multiplet structure of the ground state electronic configuration due to electrostatic, exchange, crystal field, spin-orbit interactions, etc.) and/or inter-atomic charge-transfer excitations. The latter are the result of electron hopping from delocalized states to a localized state and are treated by short-range models, such as an Anderson impurity model [1], using a set of parameters. The models are represented by the Hamiltonian
| (1) | |||||
Important physical quantities included in this Hamiltonian are the delocalized- and localized-state energies and , hopping matrix element , and . Here , , , and denote a wave vector, an index of the energy level in the valence band, a spin index, and an azimutal quantum number, respectively. For the description of core spectroscopies a further term is added to the Hamiltonian to account for coupling between localized electron and a core hole. The values of model parameters are optimized by fitting both high-energy spectroscopic and low-energy transport data and then employed to describe the character of the ground state, different ground-state properties, the nature and size of the band gap in insulators [2], etc.
Since the interpretation of transport measurements in these regards is often hampered by the presence of defects and by the importance of electron-lattice interactions, high-energy spectroscopies which directly probe the electronic degrees of freedom are often used for preliminary estimations of model parameters. In these estimations, it is important to take into account significant configurational dependence of model parameters which is predicted by first-principles calculations [3]. In particular, removing/adding of a valent or electron is expected to result in a decrease/increase in the value of the hybridization strength which in turn may lead to renormalization effects for . These effects are more pronounced for core-level spectroscopies. In the presence of a core hole is strongly reduced since the waverfunctions become more localized. The renormalization of model parameters in the final state can produce a significant uncertainty in estimated values of these parameters in the ground state. In this situation, x-ray scattering techniques become very attractive because the scattering process is charge-neutral.
By now, it has been proven that at some core-thresholds of electron-correlated systems x-ray emission spectroscopy with monochromatic photon excitation can be considered as an analog of these techniques so that the excitation-radiative deexcitation channel can be treated as resonant inelastic x-ray scattering (RIXS) process. Final states probed via such a channel are related to eigenvalues of the ground state Hamiltonian. The core-hole lifetime is not a limit on the resolution in this spectroscopy (see e. g. Ref. [4]). It is important to distinguish between the many-body description of RIXS and a single-particle approach which is usually applied to wide-band materials [5]. The differences between two formalisms are schematically illustrated in Fig. 1.
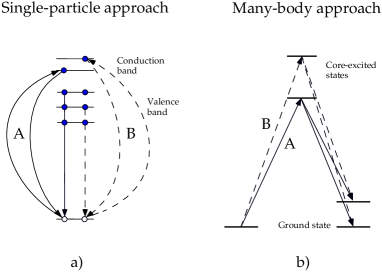
According to the many-body picture, an energy of a photon, scattered on a certain low-energy excitation, should change by the same amount as a change in an excitation energy of the primary beam (see a decay route of core excitation versus that of ) so that inelastic scattering structures have constant energy losses and follow the elastic peak on the emitted-photon energy scale. In the single-particle view, energy positions of specific inelastic-scattering structures with respect to the elastic peak which are defined by the momentum conservation rule may vary only within the energy range covered by the occupied part of the valence band. In Fig. 1a, this is reflected in the situation when, for core excitation with the higher energy, the radiative decay results in a transition with the lower energy than those for , respectively. In spite of simplifications made here, the outlined differences can be used to test the validity of one or another model for a system in question.
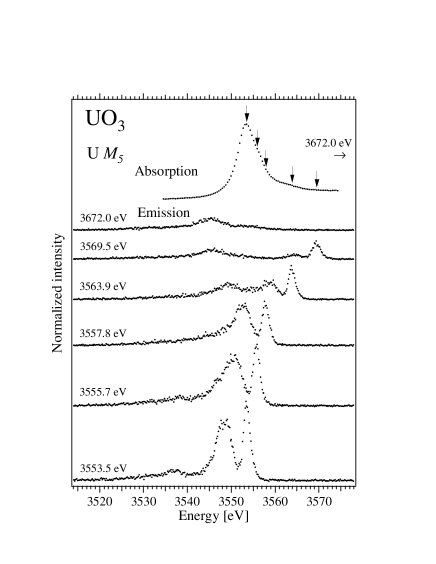
As an example, we use data from Ref. [6] (see Fig. 2) which were obtained at the U 3 edge of UO3. The inelastic scattering structure with the energy loss of about 5 eV is observed to follow the elastic peak up to 20 eV above the 3 threshold while the width of the occupied part of the valence band is only 4 eV. This indicates the importance of electron correlation effects in UO3.
Although, the information provided by the RIXS technique is similar to that obtained from optical absorption or low-energy electron-energy-loss (EELS) spectroscopies, there are some advantages in using this method:
-
1.
the technique is not surface-sensitive, helping to avoid the confusion with a formation of additional states because of surface defects;
-
2.
its element-specificity enables one to study of even very dilute compounds since metal states can be probed separately from ligand states;
-
3.
the cross-section for inelastic x-ray scattering is strongly enhanced on the resonance in contrast to weak dipole-forbidden transitions in optical absorption spectra;
-
4.
the dipole nature of radiative transitions makes it easier to calculate RIXS intensities compared to - (-) intensities in optical spectroscopy or in EELS.
In calculations of resonant x-ray scattering as a second order optical process, only a resonant term of the modified Kramers-Heisenberg equation is usually used, where the spectral intensity is given by
| (2) | |||||
Here, , , and are the ground, intermediate, and final states with energies , , and , respectively, while and represent energies of incident and scattered photons, respectively. is the dipole operator, stands for the intermediate state lifetime and and are polarizations of the light with respect to the quantization axis.
For the -polarized incident photons, spectra detected in different directions with respect to the quantization axis can be described [7] as
| (3) | |||||
For the case of studying the multiplet structure of the ground state configuration, the ability of resonant x-ray emission spectroscopy to probe low-energy excitations was first discussed by Tanaka and Kotani [8] in the description of resonant Cu spectra of La2CuO4 and CuO. The difference in - excitation profiles for multiplets between these two oxides was predicted. However, no experimental data were available with the energy resolution being sufficient enough to support conclusions made by authors. The first experiment which unambiguously confirmed the ability of this resonant technique to probe elementary excitations was performed on MnO [9] (two years later, high-resolution RIXS data at the Cu resonance of cuprates were published [4] which are in good agreement with theoretical predictions). Prior to this, probing of - excitations in rare-earths was discussed in Ref. [10]. The efficiency of the technique in studies of charge-transfer excitations for valence electrons in correlated systems was first demonstrated by Butorin et al. [6] for both soft and intermediate-energy x-ray regions.
Present paper is to large extent centered on the description of RIXS as a tool for studying of elementary excitations. Various aspects of probing the charge-transfer excitations by this spectroscopy and data interpretation within the Anderson impurity model framework are discussed extensively in the contribution by Kotani [11]. A reader is also referred to publications by present author et al. [6, 12, 13, 14] where the latter issue is addressed.
2 transition metal compounds
The study of - excitations is particularly important for elements from the middle of the 3 row because a multiplet structure of the ground state configuration is fairly rich. In the final state of the nonresonant x-ray emission and photoemission processes a system has one electron less compared to the ground state, as a consequence a multiplet structure observed in the x-ray emission and valence photoemission spectra is different from that for the ground state configuration. Instead, optical absorption and EELS are usually used to study low-energy - excitations. These spectroscopies are however not element selective so that intra-atomic - transitions often appear as weak structures on the slope of the main absorption edge. Rich multiplets can be partly hidden under intense inter-band transitions. For instance, - excitations of MnO with energies of around 5 eV and higher can hardly be observed in optical and EELS spectra [15] for that reason. Whereas, RIXS do not have this disadvantage as can be seen from the analysis of the data in Figs. 3 and 4.
When the energy of incident photons is set at the Mn 2 threshold an excited electron itself screens the core hole. Due to dipole selection rules, there are different radiative transitions for the deexcitation process: back to the ground state or to low lying excited states so that the multiplet structure of the ground state configuration can be probed. Mn ( transitions) x-ray fluorescence spectra of single-crystal MnO (100), displayed in Fig. 3, can be ordered by assigning the peaks to one of three categories: the recombination (elastic) peak, the resonating loss structures due to - excitations and charge transfer transitions (i. e. RIXS structures), and the normal x-ray emission lines which appear at constant energies of emitted photons. The electronic recombination peak is at the same energy as the excitation energy, except for the possibility of phonon losses.
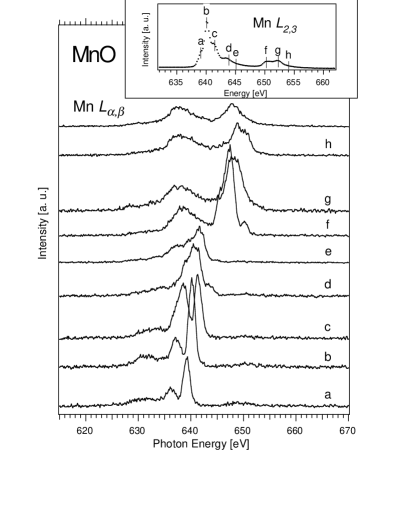
The relative intensity of the recombination peak decreases with increasing excitation energy. This can be understood as a consequence of the spin ordering of the excited states. The lowest intermediate states would have the highest possible spin (also sextets). If these states decay, they are likely to end up again as a sextet, the ground state, contributing to the recombination line. But at higher energies in the absorption multiplet one finds quartets and doublets (spin is not conserved because of the large
spin-orbit interaction). These higher-lying quartets are less likely to recombine into the sextet ground state, which explains the relatively weak recombination line. This general ordering of the spin states in the intermediate state is not only true within the region, but also over the whole spectrum, as explained by Thole and Van der Laan [16]. Within the region, one can see a clearly lower intensity of the elastic peak on the high-energy slope (Fig. 3) than on the first maximum (Fig. 3). Another qualititative explanation for the trends in the intensity of the elastic peak is that if the absorption is relatively weak, the optical matrix element from the excited state back to the ground state is also small, and the core hole is more likely to decay to an excited final state.
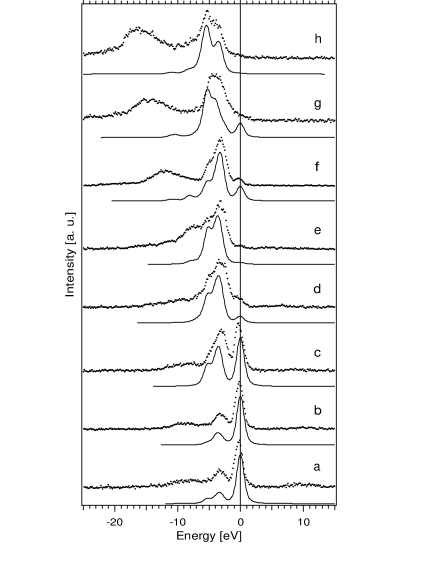
Likewise the elastic peak, inelastic scattering structures reveal the strong dependence on varying excitation energies. To make it easier to identify excitations in the final state, the Mn x-ray fluorescence data are displayed on the energy-loss scale in Fig. 4 along with results of model atomic-multiplet calculations for the Mn2+ ion from Ref. [9]. The calculations were performed using equation (2) where interference terms were neglected. In other words, intensities were summed incoherently. The atomic multiplet structures and matrix elements of dipole transitions between and configurations were calculated in intermediate coupling in the spherical group using Cowan’s programs [17]. The radial parts of the 3-3 and 2-3 Coulomb and exchange multipole interactions (so-called Slater integrals) were scaled down to 80% of their Hartree-Fock values to account for intra-atomic configuration interaction and hybridization effects.
One can see in Fig. 4 that these calculations of transitions are very successful in reproducing the spectra excited on the absorption multiplet (spectra ). Although the crystal field interaction was neglected, the atomic approach is adequate for the interpretation of experimental data due to an extra stabilization of the high-spin configuration by the Hund’s rule coupling. Such an intra-atomic exchange stabilization results in a large energy separation between the ground high-spin and first excited low-spin states [18] compared to the crystal field splitting. The first distinctly-resolved inelastic scattering structure in resonant Mn x-ray fluorescence spectra of MnO is observed at an energy loss of about 3 eV. According to the atomic-multiplet calculations, this structure corresponds to the transitions to , , and -derived states. When the crystal-field interaction is taken into account (see e. g. Ref. [19]), the 3 eV structure can be described to have contributions of , , , and symmetries. Futher increase in the excitation energy results in a development of a shoulder at a loss energy of about 5 eV (Fig. 4, spectra ) which is mainly composed by transitions to states with , , and character. Spectral weight in this energy-loss region becomes strongly enhanced for excitation energies set to the absorption multiplet. In addition, non-zero intensity can be observed for - excitations within 10 eV below the recombination peak despite some ovelap of inelastic scattering spectra with the emission line at the fixed energy of 638 eV (increasing loss energy). The latter line appears as a result of excitations into the continuum and Coster-Kronig decay from the hole states. As a whole, the RIXS data obtained for MnO indicate that the RIXS technique offers an opportunity to study - excitations in the extended energy range which are often not accessible with optical spectroscopy and EELS.
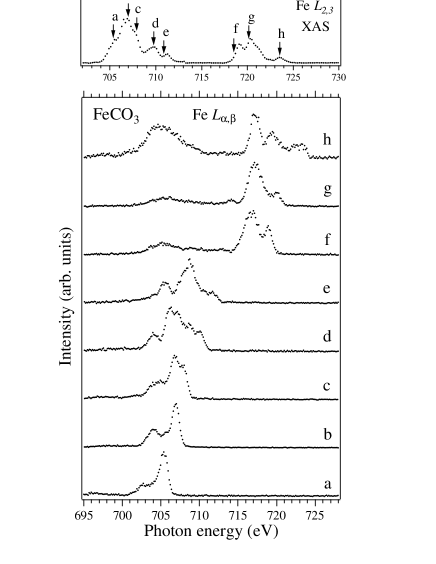
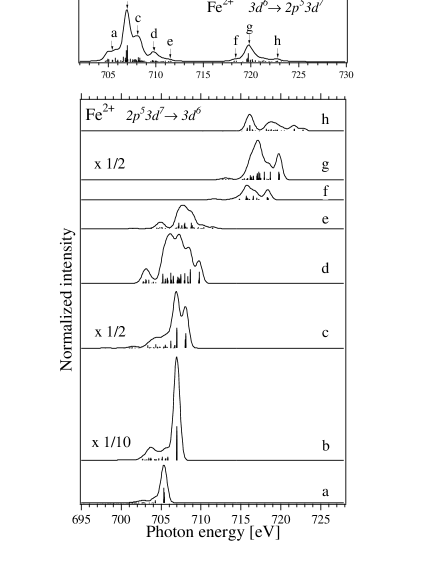
The natural extension of the RIXS spectroscopy to ease the symmetry identification for elementary excitations is polarization-dependent measurements. While the reader is referred to papers by Duda et al. [20, 21] and Hague et al. [22], which are in the same issue of the journal, for more extensive description of linear and circular magnetic dichroism studies, here Fe x-ray fluorescence data of single-crystal FeCO3 from Ref. [21] are used as an example. We show the success of crystal-field multiplet calculations in reproducing of structures in resonant spectra due to the dipole nature of the spectroscopic process. We provide the evidence of that, for the excitation close to Fe thresholds, the experimental spectra of this compound are entirely dominated by the x-ray scattering contribution with the normal emission intensity being significant only when the Coster-Kronig decay channel is open.
Experimental data, obtained with the polarization vector of incident photons being parallel to the axis of the FeCO3 crystal, are displayed in Fig. 5. The corresponding calculated spectra for the Fe2+ system are snown in Fig. 6. The calculations were performed using equation (2) within the framework of crystal-field multiplet theory. Slater integrals and matrix elements were obtained using Cowan’s [17] and Butler’s [23] codes, respectively, which were modified by Thole [24]. A 20% reduction was applied to Hartree-Fock values of Slater integrals. Regarding a small trigonal distortion of FeCO3, the calculations were done in the basis for symmetry, although crystal-field parameters and were set to very small values, for simplicity. The 10 parameter was equal to 1.1 eV. The polarization of incident photons was taken to be along the trigonal axis with the 90∘ angle between directions of the incoming and outgoing radiation. The lifetime of the intermediate state was set to 0.2 and 0.4 eV for and , respectively.
We find that calculated RIXS spectra are very sensitive to the value of the 10 parameter. Distinct splittings observed in experimental spectra and reproduced in calculations with 10 eV become obscure in calculated profiles at 10 eV. The most sensitive spectrum is the one for the excitation . Its highest structure on the low photon energy side (at 706.1 eV in Fig. 6) shows the extreme dependence on small variations of 10, thus providing a good fingerprint of the crystal-field strength. Indeed, the 10 value derived in present calculations is consistent with estimations from other publications (see e. g. Ref. [25]).
A very good agreement between calculated resonant x-ray scattering spectra of Fe2+ and the resonant part of experimental Fe x-ray fluorescence data of FeCO3 indicates a significantly low contribution to the spectra from charge-transfer excitations in the latter system, which were not taken into account in the calculations, as well as from normal emission. In fact, a sizable contribution of normal emission in the region is observed only for excitation energies set to the edge as a result of the Coster-Kronig decay of the hole. The ionic character of Fe chemical bonds in FeCO3 enables crystal-field theory to describe RIXS data in detail and as a conse-
quence to provide knowledge about the ground state and low-lying excited states.
For highly covalent compounds, it is however necessary to take into account charge-transfer excitations and configurational mixing in the ground and intermediate states of the spectroscopic process in analysis of experimental data. The configuration interaction modifies (sometimes significantly) the spacing between energy levels resulting from electrostatic, crystal field, spin-orbit, exchange interactions, etc. The character of states, expressed as a linear combination of wave functions, may change significantly as well. Charge-transfer effects can produce intense structures (charge-transfer satellites) in RIXS spectra, the energy-loss of which is related to physical quantities being crucial for understanding of ground state properties. In particular, the charge-transfer energy , required for a transfer of an electron from a ligand site to a metal site, and hybridization strength between metal states and ligand states are employed in the description of coupling between the ground state configuration and excited ( denotes a hole in the valence band), thus yielding the separation between bonding and anti-bonding states. for electrons is also included in the description of coupling between and configuration to define the separation between gravity centers of these configurations in the limit of . Charge-transfer satellites in RIXS spectra corresponding to transitions to states of predominantly or character can be strongly enhanced by setting the excitation energy to their or conterparts in metal absorption spectra. Due to this resonant behavior, energy positions of satellites can be determined more accurately, thus resulting in more accurate estimations of related physical quantities.
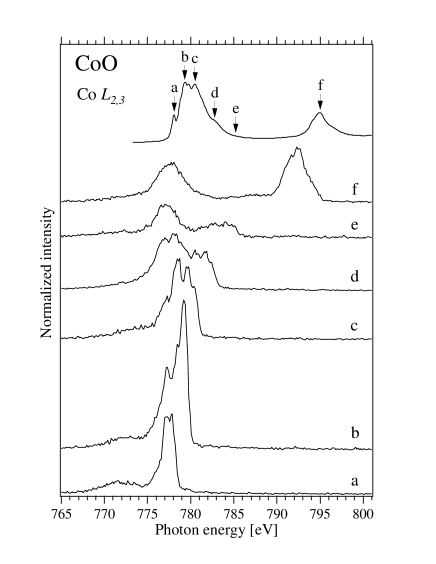
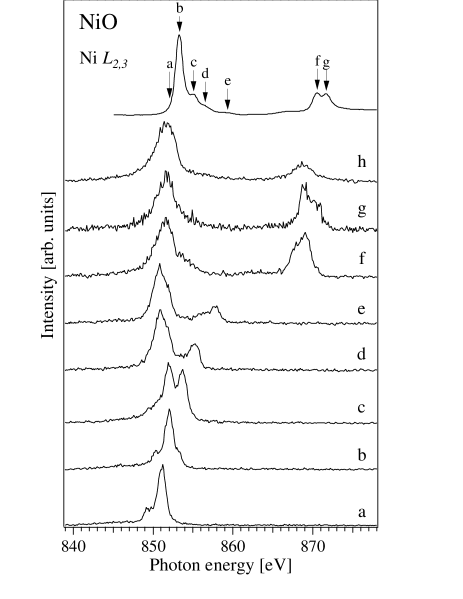
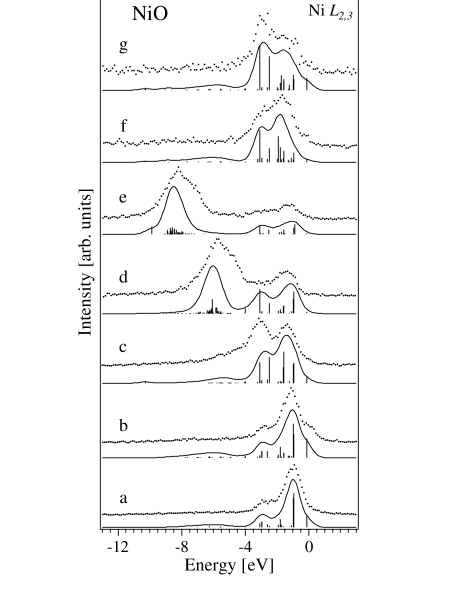
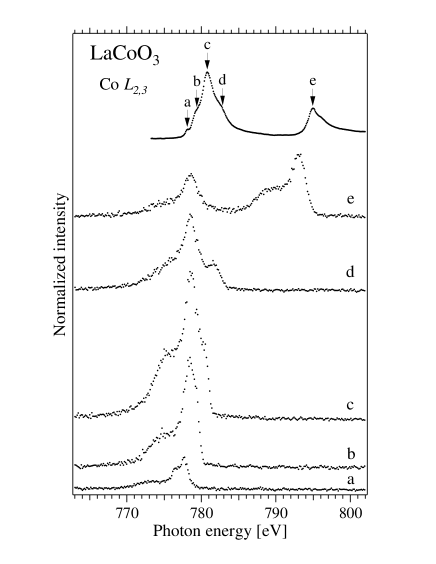
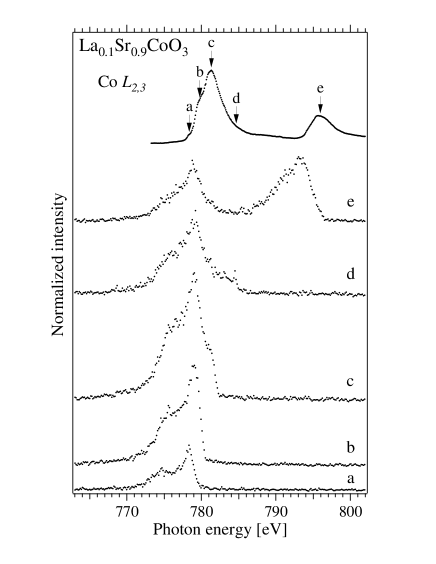
In Figs. 7 and 8, resonant Co and Ni x-ray fluorescence spectra of CoO and NiO, respectively, are shown on the photon energy scale, covering the corresponding absorption edges. Besides the structures clearly dispersing on this scale with varying excitation energies there are lines which barely show any energy shifts. While the dispersing structures can be tentatively attributed to - excitations the assingment of other lines to normal emission is not that obvious for different spectra. In particular, for CoO, setting the excitation energy to the high-energy tail of the absorption line gives rise to an appearance of an intense line at about 777 eV in spectrum in Fig. 7. The energy position of this line is somewhat different from that of in spectrum , thus indicating that it can not entirely consist of the normal emission contribution. The effect is more pronounced for NiO. Low photon energy lines in spectra and in Fig. 8 reveal a distinct low energy shift relative to recorded at an excitation energy set far above and thresholds. The results of Anderson impurity model calculations (see Figs. 9 and 10) suggest that these lines mainly originate from O metal charge-transfer excitations.
Calculations were done using formula (2). Matrix elements were obtained by applying a chain of programs which, in addition to Cowan’s and Butler’s codes, comprises a charge-transfer program written by Thole and Ogasawara. The and configurations for the ground and final states of the spectroscopic process and the and configurations for the intermediate state were included in these calculations ( is equal to 7 and 8 for CoO and NiO, respectively). The configuration was not taken into account in the description of the ground state because its contribution was estimated to be only 1% in these oxides [27, 28]. Spectra, displayed in Figs. 9 and 10, were calculated for the incident light linearly-polarized along the -axis and 90∘ detection geometry with the parameter values summarized in Table 1. The intermediate state lifetime was set to 0.5 and 0.7 eV at and , respectively, for CoO and to 0.6 and 0.8 eV for NiO. The hybridization strength was taken to be weaker in the intermediate state than that in the ground and final states due to its significant configurational dependence, as a priori expected [3].
One can see in Fig. 9 that the discussed above line in spectrum of CoO (here it is at 8 eV on the energy loss scale) is reproduced by calculations as a resonance of transitions to the states of essentially character. Similar situation occurs for NiO. The intense lines in spectra and at the energy loss of 5.7 and 8.2 eV, respectively, were found to have mainly the origin (see Fig. 9) and represent the enhanced inelastic scattering structure due to charge-transfer excitations. This structure does not follow an increasing excitation energy and is observed in the spectra rather at the constant photon energy than at the constant energy loss. Such behavior is not predicted by the simplistic considerations of the scattering process, described in Introduction.
Nevertheless it is not surprising. A possibility of the non-linear dispersion of inelastic scattering structures, corresponding to charge-transfer excitations, was discussed earlier by Tanaka et al. [29]. It was shown that for the excitation energy set to the region of charge-transfer satellites in the absorption spectrum (in this case, intermediate states of mainly character), the corresponding charge-transfer satellite spectrum for inelastic scattering can be decoupled for and in the limit of . No correlation between incident and emitted photon energies can be observed for any changes of within a range of so that the charge-transfer structure behaves as a normal-emission-like line.

Present calculations also reveal the sensitivity of RIXS profiles to the non-zero exchange field giving rise to the spectral weight transfer [30, 31]. Inter-atomic exchange interactions which correspond to very strong effective magnetic fields and act only on the valence electron spins were taken into account using a mean-field theory treatment. In principle, the exchange field strength can be different in the ground and intermediate states of the spectroscopic process. For example, for a charge-transfer gap material like NiO, the (super)exchange parameter, which is defined as [32], is expected to be larger in the presence of a core hole due to the smaller effective . In the calculations, the exchange fields in the ground and intermediate states were set to be the same, for simplicity. The value of the exchange field used in spectral simulations for CoO seems to be too high since the Néel temperature in this oxide is lower than that in NiO. However, it is very difficult to reproduce experimental spectra of CoO without turning on the exchange field even if the Boltzmann distribution in the population of low-lying excited states at room temperature is taken into account in the calculations. One possible reason for applying of an excessive exchange field may be an underestimation of spin-spin correlation effects on the spectral shape [33] in the molecular-field approximation. Another reason could be a possible existance of Co vacancies in the bulk of the single-crystal so that induced electronic holes, having oxygen character, would be antiferromagnetically coupled with Co2+. The exchange interaction between these holes and nearest-neighbor Co ions is expected to be much stronger than the Co–Co (super)exchange interaction [34], thus producing larger spectral effects and requiring larger effective exchange fields for the spectral simulations.
As a whole, results of Anderson impurity model calculations are in good agreement with experimental data except for spectrum of CoO. Although, all the structures are reproduced, their calculated relative intensities are not entirely correct. In particular, the structure at the energy loss of 5.6 eV, which has a charge-transfer origin, is clearly lacking an intensity in the calculated spectrum. This suggests that the difference and/or bandwidth , as parameters to large extent defining the charge-transfer satellite weight in the absorption spectrum at the corresponding excitation energy, may be somewhat larger than those used in calculations.
Despite the relative success of Anderson impurity model calculations of RIXS data in CoO and NiO, it is not really clear to what extent this approach may be valid for even more covalent Co
| Parameters | CoO | NiO |
| 0.8 | 0.8 | |
| 4.0 | 3.5 | |
| , ground state | 2.2 | 2.2 |
| , intermediate state | 1.8 | 1.8 |
| 4.0 | 5.0 | |
| 8 | 10 | |
| 0.0 | 1.0 | |
| 0.5 | 0.5 | |
| Exchange field | 0.3 | 0.15 |
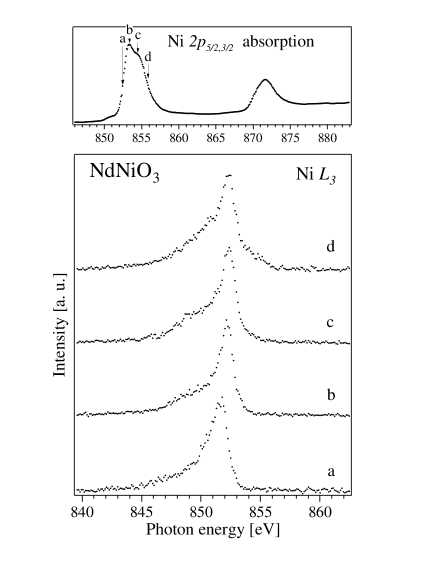
and Ni systems, where states have higher degree of delocalization. In fact, for highly covalent compounds, such as La1-xSrxCoO3 and NdNiO3, only small changes in the shape of Co and Ni x-ray fluorescence spectra with varying excitation energies across the corresponding absorption edges are observed (see Figs. 11, 12, and 13). Although relatively high resolution was used to measure these data (total resolution was set to about 0.7 eV for both Co and Ni compounds), the spectra do not show many structures and look quite broad. The energy position of the main peak has almost no dependence on the excitation energy tuned above or at the threshold. However, at least for La0.1Sr0.9CoO3 and NdNiO3, the interpretation of these spectra as mostly consisting of a normal emission contribution, which would be a projection of the partial density of states, can be challenged by their Anderson impurity model description as spectra of compounds with negative . In the latter case, the ground and low-lying excited states will mainly have the character so that main spectral structures may behave in a similar manner as charge-transfer satellites in the RIXS spectra of CoO and NiO, i. e. reveal no shifts on the emitted photon energy scale for some range of incident photon energies. Detailed calculations of spectral shapes using both band theory and quasi-atomic approach are needed to clarify the role of partial localization and - correlation in these systems.
3 Lanthanide compounds
Since the nature of the ground state defines various physical properties of a system in question, knowing the ground state character is a key issue, especially in materials science. It turns out that for rare-earth compounds the RIXS technique can provide information about -mixing in the ground state through studies of intra-atomic - excitations.
When the symmetry in a solid is not spherical, the angular momentum of electrons is not conserved and therefore is not a good quantum
number. However, the crystal field is an order of magnitude smaller than the spin-orbit splitting and can be treated as a perturbation. In the case of weak hybridization effects, the interlevel coupling and consequently -mixing in the ground state of the system are often disregarded in the interpretation of experimental data by applying a pure atomic approximation (mainly for high-energy spectroscopies) or by using a first order crystal-field theory where the crystal field interaction is assumed to act only within the separate manifolds. This is partly due to complications in extracting information about the ground state -mixing directly from the data. For example, the estimation of the -mixing degree in high-order crystal-field theory by adjusting the crystal-field parameters from the fit of optical absorption or low-energy electron-energy-loss spectra [35, 36] may result in a large uncertainty originating from difficulties calculating the intensities of dipole-forbidden transitions. In turn, the possible influence of the weak metal-ligand hybridization is difficult to analyze quantitatively in the absence of so-called charge-transfer satellites in high-energy spectroscopic data.
In this situation, the use of alternate spectroscopic means to obtain ground-state -mixing information is essential. Recently, Finazzi et al. [37] have shown that this mixing can be studied by taking advantage of dichroic properties of rare-earth x-ray absorption. However, the method is limited to magnetically ordered systems. Here, we discuss a potential of resonant x-ray scattering spectroscopy in studying of the ground-state -mixing when applied to compounds without distinct long-range magnetic order and significant metal-ligand hybridization.
Similar to optical absorption and EELS with respect to probing the optical scale excitations, RIXS at the same time provides an additional level of the transition selectivity due to the element specificity and dipole selection rules. In contrast to systems with the strong metal-ligand hybridization where the charge-transfer process leads to an appearance of intense lines in RIXS spectra as a result of inter-ionic excitations, -mixing in systems with weak hybridization effects is expected to manifest itself in an intensity gain of some intra-ionic (-) transitions which are disallowed for the pure Hund-rule ground state. In other words, transitions with other than 0, 1, and 2 are probed in the resonant excitation-deexcitation process. Although is not a good quantum number in the -mixing case, we use this terminology for simplicity.
A discussion about the RIXS potential to probe the ground-state -mixing is based on analysis of data obtained at the Dy threshold of DyF3 at room temperature. Measurements at the threshold of rare-earths provide naturally higher resolution than those at the threshold, thus allowing one to study elementary excitations in greater detail (see e. g. Ref. [38]). Experimental spectra of DyF3 are displayed in Figs. 14 and 15 on both photon-energy and energy-loss scales. Two distinct groups of pronounced inelastic-scattering peaks are observed in these spectra. The first group is distinguished by small energy losses on the tail of the elastic line, whereas the second is characterized by energy losses more than 2.5 eV. When the excitation energy approaches the main broad maximum of the Dy absorption edge, the first group still possesses significant intensity while the structures of the second group become relatively faint. Regarding the energy scale on which the spectral variations occur, the observed transitions can be attributed to intra-ionic - excitations. The energy gap between two groups of inelastic x-ray scattering structures reflects the separation between sextets and quartets of trivalent Dy [18, 40] which can be reached due to the excitation-deexcitation process.
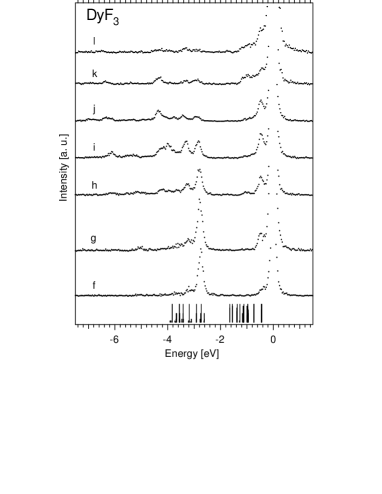
Indeed, the overall spectral shapes and their behavior with varying excitation energies are reasonably well reproduced by atomic multiplet calculations for the Dy3+ ion [41]. The results of calculations show that the dominant elastic peak in all of the RIXS spectra of DyF3 is to large extent a consequence of strong interference effects in the intermediate state of the coherent second-order optical process. The states constituting the main 4 absorption edge have a lifetime broadening of about 2 eV largely because of the Coster-Kronig decay. However, a close inspection of experimental RIXS spectra shows that there are some spectral structures which are not revealed in calculations within the pure atomic approximation. Thus, the feature with the energy loss of about 1.17 eV is observed in spectra , , and , presented in detail by Fig. 15. While atomic multiplet theory predicts the non-zero intensities for resonant inelastic x-ray scattering transitions to the , , and sextets of the configuration (the Hund rule’s ground state is ), the energy of the extra-feature in experimental spectra , , and
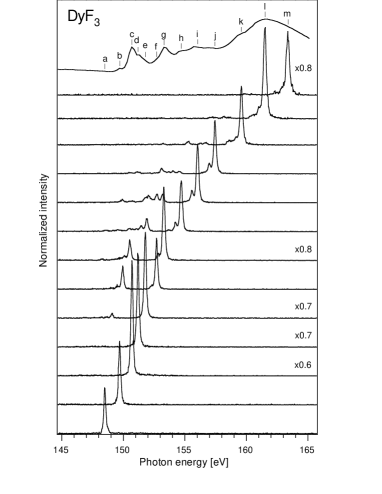
(Fig. 15) is close to those of and manifolds of Dy3+ in LaF3 [42]. This is an indication of -mixing and the presence of and components in the ground state of DyF3. Indications of other extra-structures missing from atomic multiplet calculations can be seen in the energy loss range between 1.2 and 2.0 eV, as in spectra and .
To simulate the effect of -mixing, we calculated transition intensities within the pure atomic approximation by choosing and as
initial states for the scattering process. The excitation energy was taken to be the same as that for experimental spectrum (since the intensity of extra-structures is higher for excitation energies at the main absorption edge) and the core-hole lifetime broadening was set to 2.0 eV. According to these calculations, the spectral weight at an energy loss of about 1.17 eV (transitions to and ) should constitute 56 % and 217 % of that at 1.0 eV (transitions to ) for and as initial states, respectively. Although, accounting for weak but finite Dy -F hybridization may give rise to some changes in calculated relative intensities in both cases, it is clear that an admixture of the component in the ground state results in a stronger effect than that for the component. Since the degree of -mixing in DyF3 is relatively low, the contribution to the ground states is expected to be comparable with the contribution in order to explain the noticeable weight of “forbidden” transitions in the inelastic scattering spectra in Fig. 15. This is not unusual. For example, the component has been found to be comparable to the component in the ground state of Dy3+-doped yttrium scandium gallium garnet [36] as a result of the crystal-field interaction.
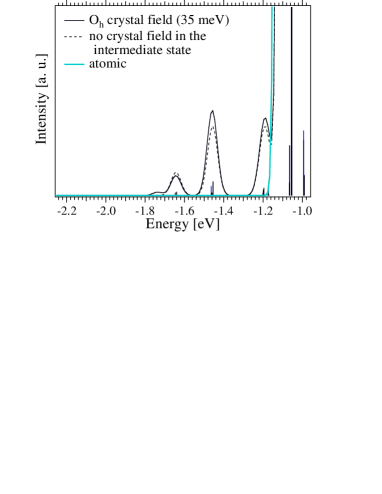
To estimate the effect of this interaction on the shape of RIXS spectra, we also performed model crystal-field multiplet calculations for the Dy3+ ion in the crystal field of symmetry with the strength of 35 meV. Fig. 16 shows the 1.0-2.2 eV energy-loss region of the spectra calculated using a pure atomic approximation and crystal field multiplet theory. It is clear that switching on the crystal field gives rise to additional transitions. The calculated intensities are low to fully account for the observed spectral weight in experimental data at the corresponding energy loss. This suggests that inter-atomic coupling is also important for the description of the inelastic-scattering profile in the energy loss range between 1.0 and 2.0 eV and that the appearance of additional structures is rather a combined effect of the crystal-field interaction and Dy -F hybridization. However, the calculations which would take into account both the crystal field and F Dy charge transfer excitations are complicated by a huge number of multiplets and require large computational resources. At present, they are out of the scope of the paper.
The existance of -mixing in the intermediate state raises a question about how strongly the inelastic-scattering intensity at energy losses between 1.0 eV and 2.0 eV is related to -mixing in the ground state of DyF3. To estimate this, crystal-field multiplet calculations with the crystal-field interaction switched off in the intermediate state were performed. Thus, any -mixing in the core-excited state was disallowed. A comparison of the results of calculations with and without crystal-field interaction in the intermediate state (Fig. 16) shows no significant changes in the inelastic-scattering intensities of “forbidden” structures on switching off -mixing in the core-excited state. One of the main reasons for that is a large core-hole lifetime broadening. As a whole, the calculations indicate that the spectral weight in the energy loss region between 1.0 and 2.0 eV is largely determined by -mixing in the ground state of DyF3.
4 Actinide compounds
The usual perspective on the actinides is that their electrons are more localized than electrons of transition elements but less localized than electrons of lanthanides. Charge-transfer effects are expected to be significant in actinide compounds as a result of metal 5ligand 2 hybridization. Indeed, the analysis of our data obtained at U threshold shows that the ligand 2U 5 charge-transfer plays an important role in uranium compounds, such as UO2, UO2(NO3)6H2O, and even in UF4.
The most extensive studies of the electronic structure of these aforementioned compounds have been carried out for UO2 (Refs.[43, 44]). Molecular-orbital calculations by several research groups [45, 46, 47, 48] gave values for the 5 occupancy, which range from 2.3 to 2.9 electrons, while this occupancy was estimated at about 2.3 electrons from the analysis of x-ray absorption and photoemission data within an Anderson impurity model [49, 50]. These results indicate significant degree of covalency for U–O chemical bonds in UO2. For UF4, a contribution of 0.3 electrons to the bonding orbitals was also predicted from relativistic Dirac-Slater local-density calculations [51]. For compounds containing U6+, the degree of covalency for metalligand bonds is expected to be even higher than that for U4+ systems. For example, molecular-orbital calculations yielded the 5 occupancy of 2.6 electrons for the uranyl ion UO (Refs. [52, 53]). Although, the values for the 5 occupancy obtained from molecular-orbital calculations seem to be overestimated [54] one can not rule out the importance of the U 5-ligand 2 hybridization even in a compound with “ionic” bonds such as UF4.
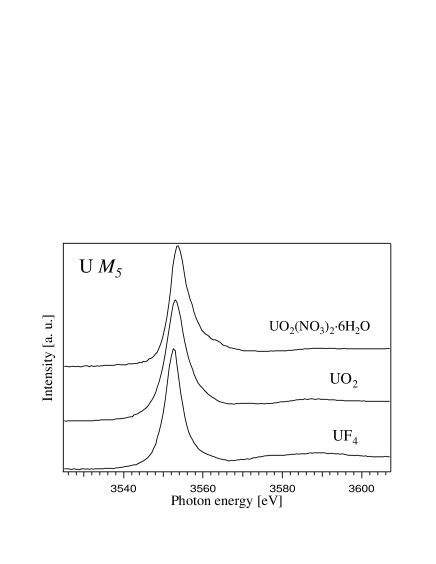
As discussed above, one of the consequences of high covalency and hybridization in the ground state is an appearance of charge-transfer satellites in the high-energy spectroscopic data. For actinides, the 3 core-hole lifetime broadening is quite large, thus reducing the efficiency of the x-ray absorption technique. As a result, the U 3 x-ray absorption spectra of UF4, UO2, and UO2(NO3)6H2O, displayed in Fig. 17, do not exhibit many sharp features. In particular, spectra of UF4 and UO2 appear as a single line with some asymmetry on the high-energy side (weak and broad structures in the continuum at about 3576 and 3590 eV for UF4 and at about 3570 and 3586 eV for UO2 were earlier assigned to multiple-scattering resonances) [55, 56, 57]. While for UO2(NO3)6H2O, the structure observed at about 4 eV above the main absorption maximum was suggested to represent a charge-transfer satellite [55] (other structures at about 10 eV and 32 eV above the main absorption maximum were attributed to multiple scattering resonances), for UO2 and UF4, where charge-transfer effects are less pronounced, an identification of possible charge-transfer satellites is hampered due to the substantial smearing out of the spectral structures. In this situation, the virtually unlimited resolution (defined by the responce function of the instrument) of the RIXS technique and its ability to enhance transitions to charge-transfer excited states are especially useful.
The U 5 x-ray fluorescence spectra of UO2 (7 transition probability is much lower) detected in the horizontal plane at 90∘ angle between directions of incident and scattered photons and for different excitation energies across the U absorption edge are displayed in Fig. 18. One can identify contributions from scattering and normal fluorescence in these spectra. The scattering part follows varying excitation energies while the normal fluorescence part appears at constant emitted-photon energies. For excitation energies set near the U 3 threshold, the spectra consist of the “recombination” line and low-energy structure, extending over 10 eV (structures present at about 19 eV below the recombination peak correspond to U 6 transitions).
The shape of resonant spectra can not be attributed solely to the 5 excitation-deexcitation process. The 3 multiplet spread is about 4 eV while the separation between centroids of the “recombination” line and low-energy structure is approximately 6.5 eV. Due to significant U 5O 2 hybridization, the ground state of UO2 can be described as a mixture of primarily 5 and 5 configurations. Then, the intermediate state of the spectroscopic process is mainly a mixture of 3 and 3 configurations so that there is a radiative decay to 5 and 5 states, i. e. transitions back to the ground state and to low-lying excited states. Final states of this second order optical process can be divided into three categories: bonding (the “recombination” line), nonbonding, and antibonding (the low-energy structure) states between 5 and 5 configurations. The whole low-energy structure grows slightly and then decreases with increasing excitation energies, showing a hint of some enhancement at about 8 eV below the “recombination” line for 3558.1-eV incident photons.
The energy separation between the slightly resonating structure and the “recombination” line is close to that between the 8.5-eV satellite and 1-eV main line in resonant valence band photoemission spectra of UO2 (Ref. [58]) which have been attributed to antibonding and bonding states between 5 and 5 configurations, respectively [49]. Taking into account the configuration dependent hybridization [3], the ’8-eV’ enhancement in the scattering spectrum can be tentatively associated with transitions to antibonding states between 5 and 5 configurations. Setting to 1.3 eV (due to higher localization of wavefunctions, bare in this oxide is expected to be lower than the one derived for UO2(NO3)6H2O, see below) we then estimate () in UO2 to be about 6 eV. This value is larger than 4.5 eV derived for the on-site - Coulomb interaction Uff from photoemis-
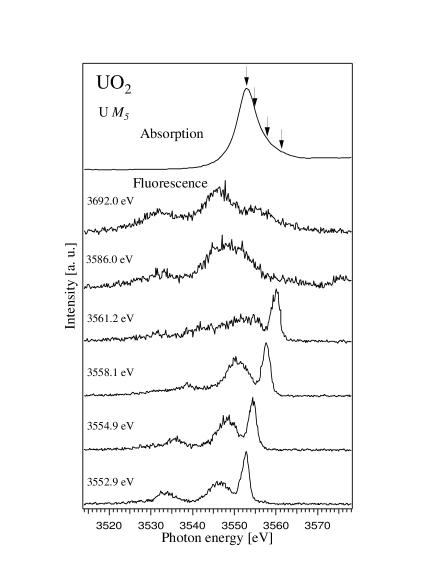
sion and bremsstrahlung isochromat data [50, 59], thus suggesting that UO2 is a Mott-Hubbard-type insulator [2]. This conclusion is consistent with those made from the analysis of both resonant and non-resonant photoemission spectra [49, 50].
The low-energy structure that corresponds to transitions involving ligand 2U 5 charge-transfer excitations is also present in the RIXS spectra of UF4 (Fig. 19) obtained at the excitation energy set to the U absorption maximum and to 5 eV above it. The situation for UF4 contrasts to that for CeF3 where charge-transfer effects are not observed in the RIXS data recorded at Ce thresholds. The shape of the UF4 spectra in Fig. 19 thus concurs with the common expectation that 5 states in actinides are more extended than 4 states in lanthanides. The relative intensity of the charge-transfer structure in the RIXS spectra of UF4 is lower than that in UO2 whereas the energy separation between centroids of this structure and the “recombination” line, which is mainly determined by values of and in the ground state, increases up to 9 eV. Since in UF4 is rather close to that in UO2, an increase of this energy separation observed for uranium fluoride is mainly due to an increase of .
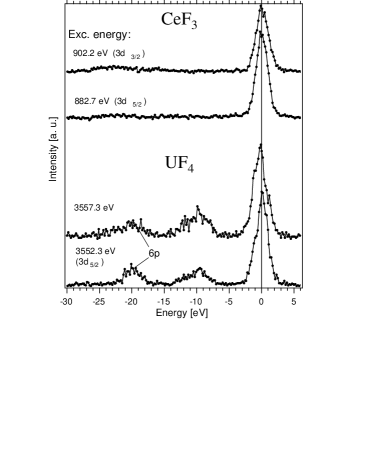
Relative intensities of structures in scattering spectra depend not only on values of model parameters in the ground state of the system but also on the channel interference and relationship between on-site - Coulomb interaction and the attractive core-hole potential in the intermediate state of the spectroscopic process. For the spectral intensity, given by formula (2), the interference effects lead to an enhancement or suppression of transitions to a certain final state due to a summation over inside the modulus. Since is usually somewhat larger than , the effective charge-transfer energy decreases in the intermediate state, thus giving rise to stronger configuration mixing. On the other hand, is shown to be reduced in the presence of a core hole [3]. This leads to a weakening of the U 5ligand 2 hybridization. In addition, the relative intensities of scattering structures may be affected by self-absorption. Therefore, the difference in relative intensities of the “recombination” line and the charge-transfer structure between UO2 and UF4 may not necessarily be determined by the difference in the 5 admixture in the ground state of these compounds.
In UO2(NO3)6H2O, a degree of covalent character of the chemical bonds is high because U is in the highest oxidation state 6+. The admixture of the 5 configuration is expected to be significant so that the ground state of the system can be described as a mixture of 5, 5, and 5 configurations. As a consequence, there are large changes in the shape of resonant x-ray scattering spectra with varying excitation energies (Fig. 20). For the excitation energy set to the U 3 absorption satellite at 3557.5 eV, one can observe an enhancement in the inelastic scattering weight at an energy loss of about 9.5 eV (spectrum ). Similar enhancement was detected in the RIXS spectra of UO3 (Fig. 2) at corresponding excitation energies although, in the present case, this resonance is more pronounced. The resonance indicates the charge-transfer character of the absorption satellite at about 4 eV above the U 3 maximum. Referring to the discussion for UO3 (Ref. [6]), the elastic peak and structures with energy losses of 5.1 eV and 9.5 eV in the scattering spectra of UO2(NO3)6H2O can be associated with transitions to bonding, nonbonding, and antibonding states between 5 and 5 configurations, respectively.
For UO3 (Ref. [6]), a resonance of transitions to nonbonding states between 5 and 5 configurations was also observed in scattering spectra at an energy loss of about 14.5 eV when the excitation energy was set to the U 3 absorption satellite 10 eV above the main maximum (see also Fig. 2). This in turn supported the assignment of the latter satellite to the one originating from the O 2U 5 charge-transfer. For UO2(NO3)6H2O, spectrum recorded at similar excitation energy (3564.2 eV versus 3563.9 eV for UO3) exhibits a broad line with energy losess of around 15.4 eV. However, the origin of this line is not clear because of uncertainty in the energy of normal fluorescence transitions and their relative contribution to spectrum (unfortunately, the high-energy excited spectra, where normal fluorescence dominates, were not recorded). The broad line can belong to normal fluorescence, or it can correspond to a resonance of charge-transfer excited states as a result of coupling between 5 and 5 configurations. The possibility of some contribution of transitions to the latter states is suggested by the shape of other spectra of UO2(NO3)6H2O recorded at lower excitation energies. For example, spectra and (Fig. 20) contain structures with similar energy losses to those for the broad line in spectrum .
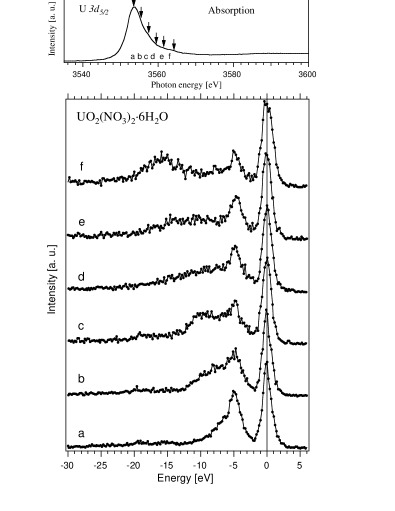
Some differences in the behavior of RIXS spectra between UO2(NO3)6H2O and UO3 which both contain U6+ are due to somewhat different environment for U in these compounds. In UO2(NO3)6H2O, the U ion is surrounded by eight O ions [60] which create two “short” and six “long” U–O bonds of 1.76 Å and 2.48 Å, respectively. In UO3, U has six nearest O neighbors [61] with two of them located at the 1.79-Å distance and others at 2.30 Å. This strong inequivalence of O sites implies a large variation in the value of for the same compound since is expected to scale with the cation-anion distance. The values of may also be different for inequivalent U–O bonds.
The determination of the energies of transitions to bonding, nonbonding and antibonding states between 5, 5, and 5 configurations from resonances in scattering spectra puts additional constrains on values of , , and in the ground state of UO2(NO3)6H2O. Neglecting the inequivalence of U-O bonds, model parameters can be estimated by diagonalizing a simplified Hamiltonian so that its eigenvalues coincide with energies of corresponding states. This gives 1.4, 3.5, and 4 eV for , , and , respectively. The derived average values suggest that UO2(NO3)6H2O is in the intermediate regime of the Zaanen-Sawatzky-Allen diagram [2].
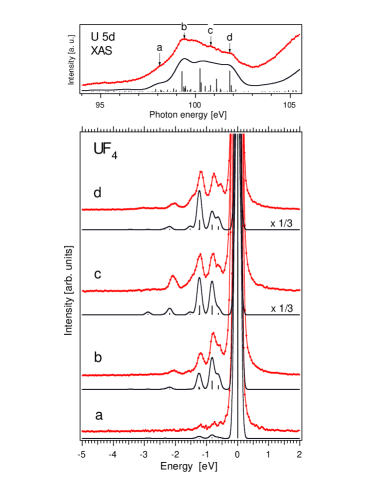
RIXS measurements at the actinide threshold provide an opportunity to study in detail elementary excitations in actinide compounds due to the naturally higher resolution of such experiments in comparison with those at the actinide and thresholds. An example of probing the - excitations in actinide systems is illustrated in Fig. 21 where the RIXS spectra of solid UF4, recorded for different incident photon energies in the pre--threshold region, are displayed. The assignment of sharp inelastic scattering structures to the - transitions is supported by atomic multiplet calculations for the U4+ ion. The spectra were calculated using equation (2), where the varying lifetime of core-excited states due to the autoionization via the - super Coster-Kronig decay was taken into account. The autoionization into the continuum of symmetry was only considered since it is the most dominant path. Matrix elements were obtained from Cowan’s programs so that Slater integrals , , , and were scaled down to 75%, 75%, 66%, and 80%, respectively, from the Hartree-Fock values. The density of states of the continuum was assumed to be constant and the kinetic energy of the continuum electron was set to the value which made the average energies of and equal.
The calculations reproduce all of the spectral structures very well especially an enhancement of the peak at about 1.2 eV with increasing excitation energies. The growth of the peak is due to enhanced transitions into the state. Changes in absolute intensities of inelastic scattering structures corresponding to the - transitions are reproduced on going from spectrum to spectrum . For spectra and , such changes in calculated intensities are about three times higher as compared to those in the experiment. The discrepancy may originate from the normalization procedure for the experimental spectra to account for variations in the incident photon flux. The intensity of the elastic peak was used as a reference in this procedure. However, the elastic peak contains some contribution of diffuse scattering which may vary with varying excitation energies.
RIXS profiles, corresponding to the - excitations, are found to be very sensitive to the chemical state of U in different systems [62]. For example, it is a matter of the presence or absence of these excitations when going from U4+ to U6+ compounds. Even for the same oxidation state, the corresponding RIXS structures are observed to be broadened in compounds with the increasing degree of covalency in chemical bonding. Therefore, RIXS measurements near the U threshold provide good fingerprints for the chemical state of U in different systems in contrast to x-ray absorption spectra which show only small differences at the U edge [56, 62].
Acknowledgements
Much of experimental work reviewed here have been carried out in collaboration with Prof. Joseph Nordgren, Dr. Akane Agui, Dr. Laurent Duda, Dr. Jinghua Guo, Dr. Pieter Kuiper, Dr. Yanjun Ma, Dr. Martin Magnuson, Dr. Derrick Mancini, Dr. Ken Miyano, Dr. David Shuh, and Conny Såthe. The author is also grateful to Dr. Frank de Groot for making available TT-MULTIPLETS programs and for his help in using those. This work was supported by the Swedish Natural Science Research Council (NFR) and the Göran Gustavsson Foundation for Research in Natural Sciences and Medicine.
References
- [1] P. W. Anderson, Phys. Rev. B, 124 (1961) 41.
- [2] J. Zaanen, G. A. Sawatzky, and J. W. Allen, Phys. Rev. Lett., 55 (1985) 418.
- [3] O. Gunnarsson and O. Jepsen, Phys. Rev. B, 38 (1988) 3568; O. Gunnarsson, O. K. Andersen, O. Jepsen, and J. Zaanen, ibid., 39 (1989) 1708; O. Gunnarsson and K. Schönhammer, ibid., 40 (1989) 4160; O. Gunnarsson and N. E. Christensen, ibid., 42 (1990) 2363.
- [4] P. Kuiper, J.-H. Guo, C. Såthe, L.-C. Duda, J. Nodgren, J. J. M. Pothuizen, F. M. F. de Groot, G. A. Sawatzky, Phys. Rev. Lett., 80 (1998) 5204.
- [5] Y. Ma, N. Wassdahl, P. Skytt, J. Guo, J. Nordgren, P. D. Johnson, J.-E. Rubensson, T. Boske, W. Eberhardt, and S. D. Kevan, Phys. Rev. Lett., 69 (1992) 2598.
- [6] S. M. Butorin, D. C. Mancini, J.-H. Guo, N. Wassdahl, J. Nordgren, M. Nakazawa, S. Tanaka, T. Uozumi, A. Kotani, Y. Ma, K. E. Myano, B. A. Karlin, and D. K. Shuh, Phys. Rev. Lett., 77 (1996) 574.
- [7] B. T. Thole, G. vand der Laan, and M. Fabrizio, Phys. Rev. B, 50 (1994) 11466.
- [8] S. Tanaka and A. Kotani, J. Phys. Soc. Jpn., 62 (1993) 464.
- [9] S. M. Butorin, J.-H. Guo, M. Magnuson, P. Kuiper, and J. Nordgren, Phys. Rev. B., 54 (1996) 4405.
- [10] S. M. Butorin, D.-C. Mancini, J.-H. Guo, N. Wassdahl, and J. Nordgren, J. Alloys & Compounds, 225 (1995) 230.
- [11] see a review paper by A. Kotani, published in this issue of the journal.
- [12] S. M. Butorin, J.-H. Guo, M. Magnuson and J. Nordgren, Phys. Rev. B, 55 (1997) 4242.
- [13] S. M. Butorin, L.-C. Duda, J.-H. Guo, N. Wassdahl, J. Nordgren, M Nakazawa, and A. Kotani, J. Phys.: Condens. Matter, 9 (1997) 8155.
- [14] S. M. Butorin, M. Magnuson, K. Ivanov, D. K. Shuh, T. Takahashi, S. Kunii, J.-H. Guo, and J. Nordgren, J. Electr. Spectrosc., 101-103 (1999) 783.
- [15] B. Fromme, U. Brunokowski, and E. Kisker, Phys. Rev. B, 58 (1998) 9783.
- [16] B. T. Thole and G. van der Laan, Phys. Rev. B, 38 (1988) 3158.
- [17] R. D. Cowan, The Theory of Atomic Structure and Spectra (University of California Press, Berkeley, 1981).
- [18] D. van der Marel and G. A. Sawatzky, Phys. Rev. B, 37 (1988) 10674.
- [19] J. van Elp, R. H. Potze, H. Eskes, R. Berger, and G. A. Sawatzky, Phys. Rev. B, 44 (1991) 1530.
- [20] L.-C. Duda, in this issue of the journal.
- [21] L.-C. Duda, J. Nordgren, G. Dräger, S. Bocharov, and T. Kirchner, in this issue of the journal.
- [22] C. F. Hague, J.-M. Mariot, L. Journel, J.-J. Gallet, A. Rogalev, G. Krill, and J.-P. Kappler, in this issue of the journal.
- [23] P. H. Butler, Point Group Symmetry Applications: Methods and Tables (Plenum Press, New York, 1981).
- [24] B. T. Thole, G. van der Laan, and P. H. Butler, Chem. Phys. Lett., 149 (1988) 295.
- [25] Z. Yi-Yang and Y. Chun-Hao, Phys. Rev. B, 47 (1993) 5451.
- [26] S. M. Butorin, M. Magnuson, C. Såthe, A. Agui, T. Käämbre, J.-H. Guo, J.-E. Rubensson, and J. Nordgren, unpublished results.
- [27] K. Okada and A. Kotani, J. Phys. Soc. Jpn., 61 (1992) 449.
- [28] F. M. F. de Groot, J. Electr. Spectrosc., 92 (1998) 207.
- [29] S. Tanaka, Y. Kayanuma, and A. Kotani, J. Phys. Soc. Jpn., 59 (1990) 1488.
- [30] D. Alders, J. Vodel, C. Levelut, S. D. Peacor, T. Hibma, M. Sacchi, L. H. Tjeng, C. T. Chen, G. van der Laan, B. T. Thole, and G. A. Sawatzky, Europhys. Lett., 32 (1995) 259.
- [31] F. M. F. de Groot, P. Kuiper, and G. A. Sawatzky, Phys. Rev. B, 57 (1998) 14584.
- [32] J. Zaanen and G. A. Sawatzky, Canad. J. Phys., 65 (1987) 1262.
- [33] M. A. van Veenendaal, D. Alders, and G. A. Sawatzky, Phys. Rev. B, 51 (1995) 13966.
- [34] P. Kuiper, G. Kruizinga, J. Chijsen, G. A. Sawatzky, and H. Verweij, Phys. Rev. Lett., 62 (1989) 221.
- [35] J. D. Axe and G. H. Dieke, J. Chem. Phys., 37 (1962) 2364.
- [36] M. D. Seltzer, A. O. Wright, C. A. Morrison, D. E. Wortman, J. B. Gruber, and E. D. Filer, J. Phys. Chem. Solids, 57 (1996) 1175.
- [37] M. Finazzi, F. M. F. de Groot, A.-M. Dias, B. Kierren, F. Bertran, Ph. Sainctavit, J.-P. Kappler, O. Schulte, W. Felsch, and G. Krill, Phys. Rev. Lett., 75 (1995) 4654.
- [38] A. Moewes, T. Eskildsen, D. L. Ederer, J. Wang, J. McGuire, and T. A. Callcott, Phys. Rev. B, 57 (1998) R8059.
- [39] S. M. Butorin, J.-H. Guo, D. Shuh, and J. Nordgren, ALS Compendium of User Abstracts and Technical Reports 1997 (LBNL, University of California, Berkeley, 1998) p. 143.
- [40] W. T. Carnall, P. R. Fields, and K. Rajnak, J. Chem. Phys., 49 (1968) 4424.
- [41] A. Kotani, Technical Report of ISSP, Ser. A, No. 3456 (1999), to be published in Proceedings of The Second International Conference on Synchrotron Radiation in Materials Science (Kobe, 1998)
- [42] J. L. Fry, H. H. Caspers, H. E. Rast, and S. A. Miller, J. Chem. Phys., 48 (1968) 2342.
- [43] J. W. Allen, in R. Z. Bachrach (Ed.), Synchrotron Radiation Research: Advances in Surface and Interface Studies, Vol. 1, Plenum Press, New York, 1992, p. 253.
- [44] see, for example, a compilation of various high-energy spectroscopic data and corresponding references by J. R. Naegele, in A. Goldmann (Ed.), Electronic Structure of Solids: Photoemission and Related Data, Landolt-Börnstein New Series, Solid State Phys., Vol. 23B, Springer-Verlag, 1994, p.183.
- [45] V. A. Gubanov, A. Rosén, and D. E. Ellis, Solid State Commun., 22 (1977) 219.
- [46] V. Heera, G. Seifert, and P. Ziesche, Phys. Stat. Sol. (b), 118 (1983) K107.
- [47] D. E. Ellis and G. L. Goodman, Int. J. Quant. Chem., 25 (1984) 185.
- [48] G. L. Goodman, J. Alloys & Compounds, 181 (1992) 33.
- [49] O. Gunnarsson, D. D. Sarma, F. U. Hillebrecht, and K. Schönhammer, J. Appl. Phys., 63 (1988) 3676; O. Gunnarsson and T. C. Li, Phys. Rev. B, 36 (1987) 9488.
- [50] A. Kotani and H. Ogasawara, Physica C, 186-188 (1993) 16.
- [51] K. Pierloot, A. Reinders, G. L. Goodman, D. Devoghel, C. Görller-Walrand, and L. G. Vanquickenborne, J. Chem. Phys., 94 (1991) 2928.
- [52] P. F. Walsh and D. E. Ellis, J. Chem. Phys., 65 (1976) 2387.
- [53] J. H. Wood, M. Boring, and S. B. Woodruff, J. Chem. Phys., 74 (1981) 5225 and references therein.
- [54] L. E. Cox, J. Electr. Spectrosc., 26 (1982) 167.
- [55] J. Petiau, G. Calas, D. Petitmaire, A. Bianconi, M. Benfatto, and A. Marcelli, Phys. Rev. B, 34 (1986) 7350.
- [56] G. Kalkowski, G. Kaindl, W. D. Brewer, and W. Krone, Phys. Rev. B, 35 (1987) 2667.
- [57] J. Guo, D. E. Ellis, E. Alp, L. Soderholm, and G. K. Shenoy, Phys. Rev. B, 39 (1989) 6125.
- [58] L. E. Cox, W. P. Ellis, R. D. Cowan, J. W. Allen, S.-J. Oh, I. Lindau, B. B. Pate, and A. J. Arko, Phys. Rev. B, 35 (1987) 5761.
- [59] Y. Baer and J. Shoenes, Solid State Commun., 33 (1980) 885.
- [60] D. Hall, A. D. Rae, and T. N. Waters, Acta Crystallogr., 19 (1965) 389; J. C. Taylor and M. H. Müller, ibid., 19 (1965) 536.
- [61] S. Siegel and H. R. Hoekstra, Inorg. Nucl. Chem. Lett., 7 (1971) 455.
- [62] D. K. Shuh, K. E. Ivanov, S. M. Butorin, J.-H. Guo, M. Magnuson, J. Nordgren, P. G. Allen, L. Terminello, G. Galleqos, and T. van Buuren, unpublished.