[
Diffusion of hydrogen in crystalline silicon
Abstract
The coefficient of diffusion of hydrogen in crystalline silicon is calculated using tight-binding molecular dynamics. Our results are in good quantitative agreement with an earlier study by Panzarini and Colombo [Phys. Rev. Lett. 73, 1636 (1994)]. However, while our calculations indicate that long jumps dominate over single hops at high temperatures, no abrupt change in the diffusion coefficient can be observed with decreasing temperature. The (classical) Arrhenius diffusion parameters, as a consequence, should extrapolate to low temperatures.
pacs:
PACS numbers: 66.30.Jt, 66.30.DnSubmitted to Physical Review B
]
In spite of the tremendous efforts that have been engaged in determining the rate of diffusion of hydrogen in crystalline silicon, a concensus on the “true value” has not yet been reached. Of course, the diffusion constant varies strongly with temperature — not necessarily in a perfect Arrhenius manner — making a precise determination of the diffusion parameters difficult. Other complications arise from possible collective effects (as opposed to tracer diffusion), low-temperature quantum effects, impurities and defects, etc.
Experimental estimates of the diffusion constant are numerous and vary widely,[4, 5, 6, 7, 8, 9, 10] sometimes by two orders of magnitude at a given temperature, as can be appreciated from the open circles in Fig. 1(a). This is an unpleasant state of affairs, since precise knowledge of this quantity is important for both practical and fundamental reasons: Because it forms complexes with a variety of defects, hydrogen affects deeply the optical and electronic properties of semiconductors. It is usually present as a result of the fabrication process, but is often intentionally introduced in order to passivate defects. Being a light species, further, H diffuses readily, inducing additional defects along its way, thus affecting the transport properties of the material to an extent which is determined by its relative concentration. It is therefore important to understand diffusion at the atomic level in order to gain better control on the properties of semiconductors and, in view of the simplicity of the structure of the host material, it is of fundamental importance to be able to understand this prototypical system.
The diffusion coefficient can be estimated, at sufficiently high temperature, using the now well-established molecular-dynamics method; a proper model for the interatomic potentials is then needed. Empirical potentials lack the transferability and predictive power of first-principles methods. The latter, however, are subject to limitations in size and time, which makes them unpractical for the long simulations required for a proper (statistically meaningful) estimate of the rate of diffusion. In an early application of the Car-Parrinello method,[11] Buda et al. [12] calculated the coefficient of diffusion of H+ in Si at three temperatures in the range 1200–1950 K, covering a minuscule maximum observation time of 4 ps.
The semi-empirical, semi-quantum tight-binding molecular-dynamics (TBMD) scheme, originally proposed by Khan and Broughton[13] and Goodwin, Skinner and Pettifor (GSP),[14] provides good accuracy at a very reasonable computational cost.[15] Here, the attractive part of the atom-atom interactions is described quantum-mechanically using (parametrized) overlap (or hopping) integrals, while the repulsive part is fitted from known properties of the system, e.g., binding energy vs distance. The forces are then derived from the Hellman-Feynman theorem. TBMD models for Si:H were proposed by Panzarini and Colombo (PC),[16] Boucher and DeLeo (BDL),[17] and Kim, Lee and Lee; [18] all three models are based on the GSP model for Si–Si interactions, and use comparable fitting schemes to take into account Si–H and H–H interactions.
The problem of hydrogen diffusion in silicon was addressed using TBMD by Panzarini and Colombo [16] as well as by Boucher and DeLeo;[17] both considered a single H atom in a 64-atom c-Si supercell. While extending significantly the range of temperatures that were covered by the ab initio simulations of Buda et al.[12] (1050–2000 K for BDL, 800–1800 K for PC), the timescales covered by these MD calculations remain short (42 and 300 ps, respectively): indeed, for a diffusion constant of cm2/s — as found at about 800 K — a quick calculation indicates that the average size of the region visited by the diffusing particle over 300 ps would be about 4 Å, corresponding roughly to the second-neighbour distance in c-Si. Further, the two calculations exhibit some disagreement which might be inherent to the models or, more likely, to the statistical quality of the MD data.
In this short note, we revisit the problem using, again, TBMD (PC version), but with much longer timescales: our simulations ran during a formidable 7 nanoseconds at the lowest temperature we could decently examine — 700 K, which is 100 K below the lowest temperature looked at by PC. Our calculations generally confirm PC’s results, in particular the discrepancies with experiment observed at the lowest temperatures. However, while our calculations indicate that long jumps dominate over single hops at high temperatures, the diffusion coefficient exhibits no abrupt change with temperature. We are led to conclude that the Arrhenius diffusion parameters should extrapolate to low temperatures as far as the classical part of the motion is concerned.
As previewed earlier, Fig. 1(a) presents the results of several measurements of the diffusion constant, plotted à la Arrhenius. Also indicated are the ab initio MD data of Buda et al.;[12] they are found to be in reasonable agreement with the high-temperature experimental points of Van Wieringen and Warmoltz[4], fitted to the Arrhenius law , with cm2/s and eV. When extended to low temperatures [dotted line in Fig. 1(a)], one clearly sees the deviations from the Arrhenius behaviour; it should be said, however, that there is no “guarantee” that diffusion should be Arrhenius over the whole range of temperatures.
The TBMD data of PC and BDL are also plotted in Fig. 1(a), and more legibly in Fig. 1(b). The agreement with experiment is clearly excellent at high temperature — certainly within the errors that can be associated with both measurements and calculations. The data of BDL are found to be extremely well fitted by the Arrhenius law with cm2/s and eV all the way down to 1050 K, in striking agreement with experiment, as can be judged by the close similarity between the prefactors and energy barriers. PC, in contrast, observe significant deviations from Arrhenius already at 1200 K, a problem that can possibly be attributed to the statistical quality of their data.
In Fig. 2 we give, as an example, the calculated time-dependence of the mean-square displacement for our lowest-temperature run, viz. 700 K. The simulation at this temperature ran for a total of 7 ns and the mean-square displacement is calculated for a maximum correlation time of 1 ns in order to minimize statistical uncertainties. We also evaluated the mean-square displacement using only the first half of the run, then only the second half so as to have a feeling for the “error bar” of our estimate of the diffusion coefficient, . The three different calculations are indicated in Fig. 2 by full, dashed, and dotted lines, respectively. The corresponding coefficients of diffusion, which we discuss next, are presented in Fig. 1; for each temperature we investigated (700, 800, 900, 1000, 1200, and 1500 K), three data points are thus given.
As can be appreciated from Fig. 1(b), our estimates of the diffusion coefficient generally agree with the values reported by PC, but clearly with much improved statistical quality: the data points exhibit very little scatter, falling along a single, rather well-defined straight line. It is of course hazardous to assume that the diffusion process is perfectly Arrhenius and that no “exotic” diffusion mechanisms (i.e., other than single hops) are taking place. In order to “guide the eye”, however, we fitted our data to the law cm2/s; this is displayed as the dashed line in Fig. 1. Our calculations, clearly, show no evidence of a sizeable change in the diffusive behaviour as a function of temperature, as can possibly be (and was) inferred from the data of PC.
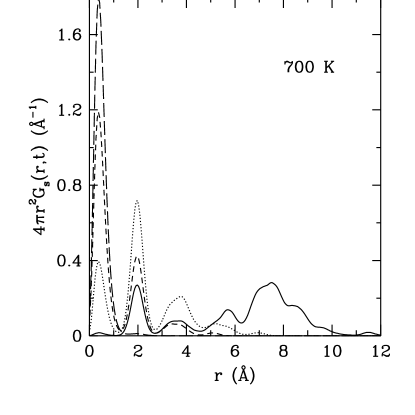
Exotic mechanisms — in the present case long jumps — are in fact present; this has already been noted by PC, who also found long jumps to be quenched in as temperature drops; this observation was based on a visual examination of the mean-square displacements. A physically more appropriate characterization of single-atom motion is provided by the self part of the van Hove correlation function (see, e.g., Ref. [19]), , which gives the probability of finding a particle at at time given that it was at the origin at . Averaging out over angular space, the function of interest is .
The van Hove self-correlation function for the H atom in c-Si at 700 K is displayed in Fig. 3. Here, is plotted as a function of distance for four different times. At short time (but somewhat longer than the typical vibrational period), single hops dominate the motion. As time increases, the particle is (of course) on average further away and, evidently, the diffusive motion proceeds via a sequence of single jumps — to a reasonable approximation.
Because diffusion is activated, it is more meaningful, in order to compare the modes of diffusion at different temperatures, to examine the behaviour of at fixed mean-square displacement. Thus, it is possible in this way to determine the type of motion that leads a particle a certain distance away from its original position. Here we chose (somewhat arbitrarily) a fixed mean-square displacement of 50 Å2. From the curves, it is easy to determine the time at which, on average, and for each temperature, the particle will be at the required fixed position.
The results of this analysis are presented in Fig. 4. Again, here, we find that the motion consists of single hops at low temperatures, but acquires a “long-jump” character as temperature increases. At the highest temperatures, in fact, the distribution is nearly continuous, and single jumps become almost undetectable. There is some evidence, in these plots, of a discontinuous change in the manner that diffusion proceeds as a function of temperature: upon going from 800 to 900 K, nearest-neighbour jumps are found to become negligible, to the advantage of second- and further-neighbour hops. But then no sign of such a change is apparent in the diffusion coefficient (cf. Fig. 1), which perhaps lacks the sensitivity needed to reveal such details. Thus, we are led to conclude that the low-temperature ( about 900 K) diffusion coefficient is indeed Arrhenius-like, whereas high-temperature diffusion proceeds via a complicated sequence of jumps whose energy barriers combine into a single activation energy that is close to that for single hops.
In view of this, there are no reasons to believe that this Arrhenius law should not extrapolate to very low temperatures, if the system were classical. This is clearly not the case here and it is of course expected that diffusion will be enhanced by quantum contributions, even more so as temperature decreases. We have not included quantum corrections in the present study: this is a difficult problem and it is not clear that their role is significant at the temperatures considered here. The small discrepancies between TBMD and experimental data at high temperatures might be related to quantum effects, but are perhaps more likely due to some limitations of the model, i.e., are not significant. Likewise, Fig. 1 seems to indicate some partial “recovery” of the experimental data at very low temperature. This might be a manifestation, again, of quantum contributions. Clearly a more consistent set of experimental data is needed in order to have a proper perspective on the problem.
Aknowledgements — We are grateful to Normand Mousseau for useful suggestions and to Edward Hernandez for providing us with a TBMD code for the Goodwin-Skinner-Pettifor Si model. We also thank Luciano Colombo for useful advice on implementing the TBMD code for Si:H and for providing us an electronic version of Fig. 1 in Ref. [16]. This work is supported by grants from the Natural Sciences and Engineering Research Council (NSERC) of Canada and the “Fonds pour la formation de chercheurs et l’aide à la recherche” (FCAR) of the Province of Québec.
REFERENCES
- [1]
- [2] e-mail address: bedardsa@magellan.umontreal.ca
- [3] To whom correspondence should be sent; e-mail address: Laurent.Lewis@umontreal.ca
- [4] A. Van Wieringen and N. Warmoltz, Physica (Utrecht) 22, 849 (1956).
- [5] T. Ichimiya and A. Furuichi, Int. J. Radiat. Isot. 19, 573 (1968).
- [6] C. H. Seager and R. A. Andersen, Appl. Phys. Lett. 53, 1181 (1988).
- [7] A. Mogro-Compero, R. P. Love, and R. Schubert, J. Electrochem. Soc. 132, 2006 (1985).
- [8] A. J. Tavendale, A. A. Williams, D. Alexiev, and S. J. Pearton, Mater. Res. Soc. Symp. Proc. 104, 285 (1988).
- [9] S. J. Pearton, J. Electron. Mater. 14a, 737 (1985).
- [10] N. M. Johnson, D. K. Biegelsen, and M. D. Moyer, Appl. Phys. Lett. 40, 882 (1982).
- [11] R. Car and M. Parrinello, Phys. Rev. Lett. 55, 2471 (1985).
- [12] F. Buda, G. L. Chiarotti, R. Car, and M. Parrinello, Phys. Rev. Lett. 63, 294 (1989).
- [13] F. S. Khan and J. Q. Broughton, Phys. Rev. B 39, 3688 (1989).
- [14] L. Goodwin, A. J. Skinner, and D. G. Pettifor, Europhys. Lett. 9, 701 (1989).
- [15] For a recent review, see L. J. Lewis and N. Mousseau, Comp. Mat. Sci. 12, 210 (1998) and other articles in this issue.
- [16] G. Panzarini and L. Colombo, Phys. Rev. Lett. 73, 1636 (1994); see also L. Colombo, in Annual Reviews of Computational Physics, vol.IV (edited by D. Stauffer, World Scientific, Singapore, 1996), p. 147.
- [17] D. E. Boucher and G. G. DeLeo, Phys. Rev. B 50, 5247 (1994).
- [18] E. Kim, Y. H. Lee and J. M. Lee, J. Phys: Condens. Matter 6, 9561 (1994).
- [19] J.-P. Hansen and I. R. McDonald, Theory of simple liquids (Academic, London, 1986).