Transmission of Information and Herd Behavior: an Application to Financial Markets
Abstract
We propose a model for stochastic formation of opinion clusters, modelled by an evolving network, and herd behavior to account for the observed fat-tail distribution in returns of financial-price data. The only parameter of the model is , the rate of information dispersion per trade, which is a measure of herding behavior. For below a critical the system displays a power-law distribution of the returns with exponential cut-off. However for an increase in the probability of large returns is found, and may be associated to the occurrence of large crashes.
pacs:
PACS numbers: 87.23.Ge, 02.50.Le, 05.45.Tp, 05.65.+bRecently, there has been a significant interest in applications of physical methods in social and economical sciences [4]. In particular, the analysis of financial stock market prices have been found to exhibit some universal characteristics similar to those observed in physical systems with large number of interacting units, and several microscopic models have been developed to study them [5, 6, 7]. For example the distribution of the so-called returns, i.e. the logarithmic change of the market price, has been observed to present pronounced tails larger than in a Gaussian distribution [5, 6, 8, 9, 10]. Several models have been put forward which phenomenologically show the fat-tail distributions. Among the more sophisticated approaches are dynamic multi-agent models[7, 11] based on the interaction of two distinct agents populations, (“noisy” and “fundamentalists” traders) which reproduces the desired distributions, but fails to account for the origin of the universal behavior. An alternative approach, explored in this Letter, is that herd behavior [12, 13] may be sufficient to induce the desired distributions. Herding assumes some degree of coordination between a group of agents. This coordination may arise in different ways, either because agents share the same information, or they follow the same rumor. This approach has been recently formalized by Cont and Bouchaud[14], as a static percolation model.
We present a model for opinion cluster formation and information dispersal by agents in a network. As a first approach to model this complicated social behavior we consider: (i) a random dispersion of information, (ii) agents sharing the same information form a group that make decisions as a whole (herding), and (iii) whenever a group performs an action, the network necessarily adapts to this change. We then apply the model to study the price dynamics in a financial market. Our results show that when the information dispersion is much faster than trading activity, the distribution of the number of agents sharing the same information behaves as a power-law. Using a linear relationships for the price update in terms of the order size [14, 15], the price-returns also exhibit this universal feature (with a different exponent). On the other hand when the dispersion of information becomes slower, a smooth transition to truncated exponential tails is observed, with a portion of the distribution remaining close to the power law. In our approach the average connectivity of the network is driven by the rumors in a dynamic way, and provides an extension to the static percolation model proposed by Cont and Bouchaud[14], where the average connectivity was a fixed external parameter. We find that the fat-tails distributions are observed even when the time-average density is far from the critical threshold found in Ref. [14].
The model. We consider a system composed by agents, represented by vertices in a network. The state of agent is represented by corresponding to an inactive state (waiting [), and two active states (either buying [] or selling []). Agents can be isolated or connected through links forming a cluster, i.e. those who share the same information. Initially, all agents are inactive () and isolated (i.e. no links between them). The network of links evolves dynamically in the following way. At each time step :
-
1.
an agent is selected at random,
-
2.
with probability , the state of becomes active by randomly choosing the state or , and instantly all agents belonging to the same cluster follow this same action by imitation. The aggregate state of the system and the total size of the cluster are computed. After that the cluster is broken up into isolated agents, removing all links inside the cluster, and resetting their state ;
-
3.
with probability , the state of remains inactive (), and instead, a new link between agent and any other agents from the whole network is established.
This process is repeated from step (1).
The evolution of the system is characterized by a succession of discrete events , which correspond to avalanches, occurring instantly whenever an activation occurs. Interspeded between these events, new links are incorporated to the network. A quantity relevant in bond percolation is the connectivity of the network, , defined as the average number of links per agent, which will grow as long as the agents remain inactive, or decay when an avalanche occurs. Thus, we expect that the system will reach an asymptotic regime where the connectivity fluctuates around a mean value, which increases as the activation rate decreases.
An application to price dynamics. Consider now that the above agents participate in a stock market. When an agent becomes active, a buy () or a sell () order is posted to an external centralized market-maker. When inactive (i.e. waiting), the agent disperses an information unit represented by the random addition of a link to the cluster. All the members in the cluster share the same information, thus it constitutes a group of opinion or an information cluster. This process includes the possibility of cluster merging, in which case the information is shared among the new set.
Herding assumes that agents are not making decisions independently, but that each agent acts as belonging to a group that makes a collective action. In the above model the herding behavior is represented by the instantaneous imitation of an activated agent throughout the information cluster. We notice also that the instantaneous imitation process we apply above may also result when financial agents all use similar tools for analysis (and similar know-how). Also, we assume that after an activation event takes place the information content of the cluster is no longer useful, so all links in the cluster are removed after the order has been placed.
The parameter controls the rate of trading activity vs. information dispersion, and appears as the only adjustable parameter of the model. For only trading activity takes place. Thus, starting with some randomly dispersed links, the evolution of the market will asymptotically approach that of isolated agents trading in the market, without large clusters and thus no herding behavior. On the other hand, for small , dispersion of information occurs on most time steps, increasing the internal connectivity. Initially the empty network has time to build many clusters, which eventually merge into bigger clusters, until most agents belong to a super-cluster. When an order arrives, this will most probably come from the agents in the super-cluster, inducing a large impact on the market. Although an extreme scenario, we can estimate that this should occur when . From the above discussion we can define the parameter as the “herding parameter”: no herding occurs () for , while herding is observed () for . Alternatively this parameter also tells how many links are born between two trade orders, i.e. the rate of information dispersion.
Finally we introduce the price index dynamics, executed by an external centralized market-maker. We follow the simple update rule for the price index discussed in Ref. [15], which arises considering that each order acts as an “impact” to the price proportional to the size of it. In our case, when activity takes place at step , all agents in the expiring cluster act simultaneously, so the size of the order is . Therefore we consider that evolves as , where is a parameter which controls the size of the updates and provides a measure of the liquidity of the market. With the above rule, the price return is proportional to the order size. Other nonlinear suggestions exist for the price update [16], which will modify the exponents of the distribution of returns. However we stress that the power-law features observed in this model persist with this modification and are a consequence of the network growth and annihilation of links.
We have performed numerical simulations for a population of agents and for different values of the herding parameter. In the following simulations the time unit has been rescaled to that of the average time to place an order: . For example, a value of [] corresponds to an average of a buy or sell order every iterations, or in other words the “market time” of one unit will correspond in average to agents dispersing a rumor and one (buy or sell) order. Figure 1(a) displays a typical evolution of the market price , Fig. 1b shows the corresponding returns , while the evolution of the connectivity is shown in Fig. 1(c). The latter panel displays the connectivity fluctuates around the time average , with some fluctuations overshooting the critical value . The mean value of the connectivity and its standard deviation increases with increasing herding parameter (decreasing ).
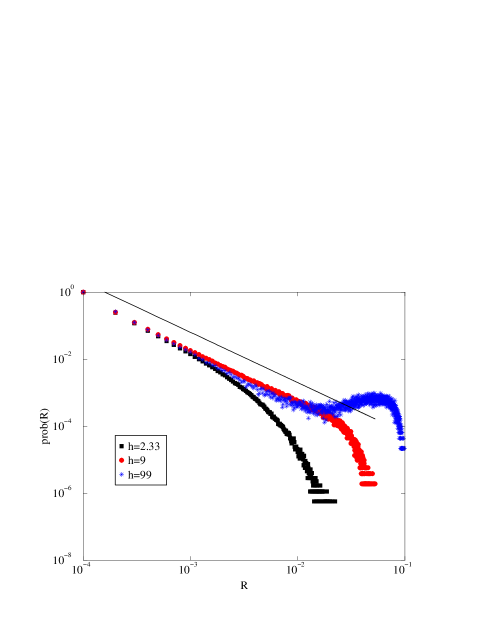
In Fig. 2 we show the distribution of returns for three different herding parameters , and [, and , respectively]. The solid line shows a power-law with exponent . Note that in all cases one observes power-law decay in a range of returns. Moreover, for increasing this range increases, up to a critical value where we conjecture a power-law will be fitted on the whole range. For the distributions display a continuous crossover to an exponential cut-off, where the time average is far from . However for , the time-average lies very close to the critical threshold , and the distribution changes qualitatively. A relative increase in the probability of extremely high returns is observed, which would favor the creation of “financial crashes”. We remark that this bump in the distribution has not been reported using financial time series, but is common in other physical systems [17]. In this regime clusters of the system size are created and produce the large returns.
The distribution of returns is related in this model to the distribution of cluster. In fact, if is the exponent for the distribution of cluster sizes and is the exponent for the distribution of returns, then the distribution of returns is equal to the distribution of cluster times the probability to chose a given cluster that is proportional to its size: . The exponents are related by . We plot in Fig. 3 the averaged distribution of clusters. The solid line represents a power law with exponent . This result agrees with the previous calculation and with theoretical results on stationary random graphs that predict an exponent of at the critical point [14]. Recently, this exponent was found by D’Hulst and Rodgers [18] in a mean-field analysis of our model. They also extended the model by allowing multiple rumors to be dispersed at a single time-step, finding the exponent is robust.
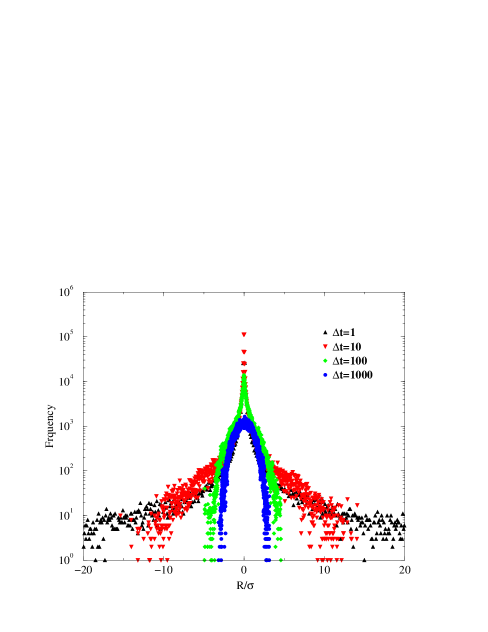
In Fig. 4 we show a linear-log plot of the probability distribution of normalized returns, defined as with the average return (about 0) over the time series and the volatility , for and different time intervals . With an increasing time interval , a crossover towards a Gaussian distribution is observed from the figure, in agreement with empirical financial data [10].
In summary, we have presented a self-organized model for the propagation of information and the formation of groups and we have applied it to the description of herd behavior in a financial market. We suppose that the propagation of information within the network follows a random process, and the traders can be classified into groups (clusters) having the same opinion. In our description the size and number of clusters evolves in time reflecting the information content of the market. This is controlled by the herding parameter, which is a measure of the rate of rumor dispersion. Our numerical calculations show that for herding behavior below a critical value , herding produces qualitatively the same distributions observed in empirical data: a power-law range and an exponential cut-off. However for sufficiently high herding parameter , a qualitatively change is observed, where the probability of large crashes increases. We conclude that information dispersion and herding may be able to account for the occurrence of crashes. In our approach, we propose a mechanism for the fluctuation of the connectivity of the network in contrast with fixed [14] or random “sweeping” of the connectivity in other percolation-like models [14, 19]. More elaborate mechanisms for the activation of the agents, for opinion conflicts when two cluster merge, and feedback between the price index and the activation should be incorporated in the model to make it more realistic. Slight modifications of the model could be applied to study, for example, social systems of opinion formation.
We acknowledge fruitful discussions with Dante R. Chialvo, Juan Pedro Garrahan, P. Gopikrishnan and Emilio Hernández-García. Financial support has been provided by PB94-1167 and PB97-0141-C02-01 projects from Dirección General de Investigación Científica y Técnica (DGICYT, Spain).
REFERENCES
- [1] Corresponding author email: victor@imedea.uib.es
- [2] URL: http://www.imedea.uib.es/Nonlinear
- [3] URL: http://www.nld.df.uba.ar/
- [4] See e.g. , S. Moss de Oliveira, P.M.C. de Oliveira, and D. Stauffer, Evolution, Money, War and Computers, (Teubner, Stuttgart-Leipzig, 1999)
- [5] R.N. Mantegna and E. Stanley, An introduction to Econophysics: Correlations and Complexity in Finance, (Cambridge University Press, Cambridge 1999).
- [6] J.P. Bouchaud and M. Potters, Theory of Financial Risk, (Cambridge University Press Cambridge 2000).
- [7] T. Lux and M. Marchesi, Nature 397, 498 (1999).
- [8] R.N. Mantegna and E. Stanley, Nature 376, 46 (1995).
- [9] T. Lux, Appl. Financial Economics 6, 463 (1996).
- [10] For a recent empirical study of financial market indices see e.g. P. Gopikrishnan, V. Plerou, L.A.N. Amaral, M. Meyer, and H.E. Stanley, Phys. Rev. E 60, 5305 (1999); and for individual companies see e.g. V. Plerou, P. Gopikrishnan, L.A.N. Amaral, M. Meyer, and H.E. Stanley, Phys. Rev. E 60, 6519 (1999) and references therein.
- [11] P. Bak, M. Paczuski and M. Shubik, Physica A 246, 430 (1997).
- [12] R. Topol, Economic Journal 101, 768 (1991).
- [13] A. Bannerjee, Rev. of Economic Studies 60, 309 (1993).
- [14] R. Cont and J.P. Bouchaud, Macroeconomic Dynamics 4, 170 (2000).
- [15] J.D. Farmer, ‘Market force, ecology and evolution’, Los Alamos archive (www.lanl.gov) adap–org/9812005 (1998).
- [16] Y.-C. Zhang, Physica A 269, 30 (1998).
- [17] See e.g., A. Corral, C.J. Pérez and A. Díaz-Aguilera, Phys. Rev. Lett. 78, 1492 (1997).
- [18] R. D’Hulst and G.J. Rodgers, ‘Exact solution for a model of crowding and information transmission in a financial markets’, Los Alamos archive (www.lanl.gov) cond–mat/9908481 (1999); ‘Transition from coherence to bistability in a model of financial markets’ cond–mat/0008008 (2000).
- [19] D. Stauffer and D. Sornette, Physica A 271, 496 (1999).