The Fermi surfaces of Metallic Alloys and the Oscillatory Magnetic Coupling between Magnetic Layers separated by such Alloy Spacers
Abstract
We review the theory of oscillatory magnetic coupling in Metallic Multilayers across alloy spacers. We illustrate the relationship between the frequencies of the oscillations and the extremal caliper vectors of the Fermi surface of the spacer by explicit calculations for Cu(1-x)Nix, Cr(1-x)Vx and Cr(1-x)Mox alloys. We argue the measurement of the frequencies of such oscillations can be an extremely useful and cheap probe of the Fermi surface of random alloys.
1 Introduction
Many random alloys such as Cu(1-x)Nix, Cu(1-x)Aux are metals and therefore have Fermi surfaces in a well defined sense[1]. Moreover these Fermi surfaces determine many of the properties of these scientifically interesting and technologically important class of materials. Thus, it would be useful to know what these Fermi surfaces are like and how they evolve with changing concentration. Unfortunately the classic probes of the Fermi surface such as the measurement of the de Haas van Alphen (dHvA) oscillations[2, 3] work only if the quasi-particles can complete a cycle along the Landau orbit between two scattering events associated by deviations of the crystal potential from periodicity. As it happens this physical requirement of long quasi-particle life times translates into very small, ppm, concentration of impurities and hence no dHvA signal is expected for the concentrated alloys of interest. This leaves, until recently, two dimensional Angular Correlation of (Positron) Annihilation Radiation (2d ACAR) and Compton Scattering (SC) studies, which do not require long quasi-particle life times, as the only source of reasonably direct quantitative information about the Fermi Surfaces of Random Alloys. Our aim here is to argue that measurements of the oscillatory coupling between magnetic layers across random alloy spacers can also provide such information.
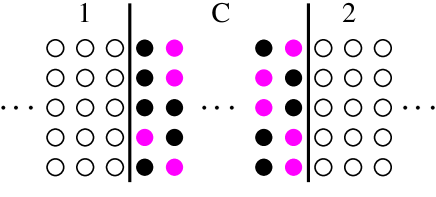
In short, what one measures is the exchange coupling between magnetic layers 1 and 2 separated by a non magnetic spacer layer of thickness made of a random metallic alloy. A schematic picture of the experiment configuration is shown in Fig. 1 and the exchange interaction is defined in terms of the magnetic interaction energy :
| (1) |
where , are the average magnetization of magnetic layers 1 and 2 respectively. As was discoverer by Parkin et al[4], and has been observed for a vast variety of systems[5], oscillates between being Ferromagnetic, and Antiferromagnetic, as a function of the separation . In fact most experiments seem to be consistent with the formula[6, 7]
| (2) |
where each contribution is characterized by the period , amplitude , phase and coherence length which is infinite for pure metal spacer but is finite if the spacer is a random metallic alloy. Our discussion will focus on the astonishing fact that is a quantitative measure of a geometrical feature of the Fermi surface of the infinite (bulk) spacer metal. In fact, most theories predict the form in eq. (1) asymptotically for large and turns out to be an extremal caliper vector, connecting two opposite points on the Fermi surface, in the direction perpendicular to the plane of the magnetic layers, that is to say in the growth direction of the multilayer system. This result is well confirmed for a large number of pure metal spacers. In the next two sections we review the agreement between the predicted and measured evolution of with concentration for random metallic alloys. In section 4 we will discuss the exponential damping factor and in section 5 we present an asymptotic theory for the amplitudes and the phases .
The interest in the above interlayer magnetic coupling has arisen in the wake of its discovery, because of its connection with the technologically very important Giant Magneto-resistance (GMR) phenomenon. From this point of view the problem is largely solved. The physical mechanism understood to be the planar defect analogue of the RKKY interaction between point like magnetic defects in metals, enhanced by confinement[6]. In this contribution we wish to emphasize an other aspect of the problem. Namely, we shall explore the possibility of using the oscillatory coupling phenomenon as a new probe of the Fermi surface in transition metal alloys. Clearly, compared with 2d-ACAR the measurement of these oscillations are simple and cheap and hence the prospects of such project are bright. However, before the full power of the method can be assessed both the experimental technique and the theoretical framework used to interpret the data will require further scrutiny. In what follows we will present a few initial steps in the direction of the latter.
2 Evolution of the Fermi surface of Cu(1-x)Nix alloys with concentration.
The FCC Cu(1-x)Nix alloys are one of the best known examples for which the rigid band model completely misconstrues the nature of the changes in the electronic structure on alloying[8, 9]. Thus a direct experimental study of the Fermi surface is of fundamental interest from the point of view of the electronic structure of metallic alloys.
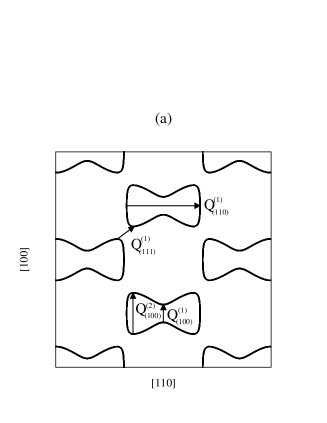
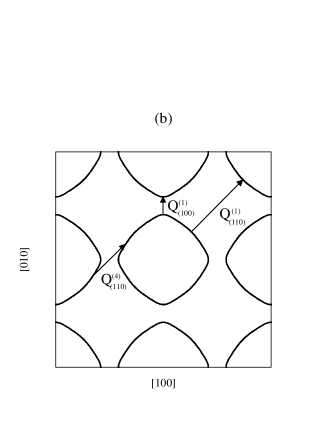
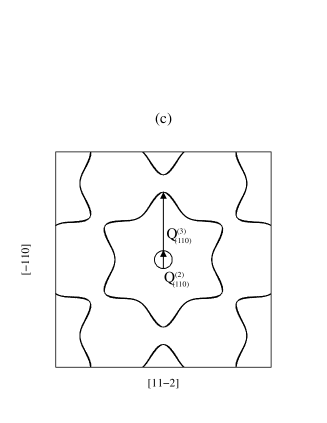
Oscillations for this alloy systems have been observed in three separate experiments. Parkin et al[10] and Bobo et al[11] studied a Co/Cu(1-x)Nix/Co system with (111) growth direction, while Okunoet al[12] studied the same system for the (110) orientation. The relatively long oscillation period ( 10Å) observed in all of these experiments is believed to correspond to neck caliper vectors of the Cu-like Fermi surface of Cu(1-x)Nix alloys for . In particular in the case of (110) direction the caliper vector is the diameter of the neck itself, while in the case of (111) orientation it spans the neck in an angle of 19.47o with respect to the neck plane. In fig. 2 all the extremal vectors for the (100), (110) and (111) directions are shown. The ones we already mentioned for the (110) and (111) directions are the and respectively. In the refs.[14, 15] we have calculated the concentration dependence of these extremal vectors using the KKR-CPA electronic structure method[8, 16] and have compared the predicted oscillation periods with the experimental ones. We present that result also in fig. 3 for both the (110) and (111) orientations.
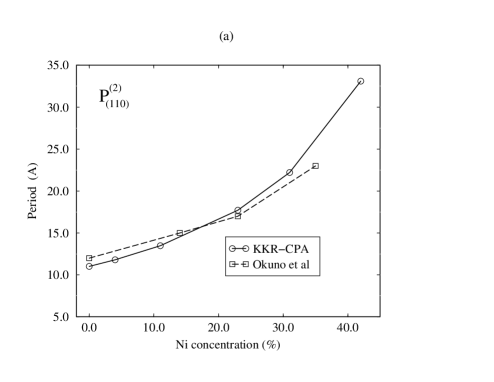
The decrease with concentration of the neck diameter, resulting in an increase of the oscillation period, is in qualitative agreement with the Rigid Band Model. Indeed, that decrease comes from the fact that an electron-like neck of the Fermi surface such as the one we are looking for is expected to shrink when electrons are removed from the system (for instance by increasing the Ni concentration) but the calculated as well as the observed shrinkage is more gentle than the predicted from the Rigid Band Model. The excellent agreement between our calculation and the experiment as illustrated in fig. 3 is one more striking example of the success of the CPA theory in binary alloy systems. The relatively simple Fermi surface of the Cu(1-x)Nix binary alloy system () makes it easy to examine whether the evolution of the Fermi surface with alloying is in agreement with OMC measurements, and as is illustrated in fig. 3 that agreement is excellent. In the next section a binary alloy system with much more complicated Fermi surface is examined, namely the Cr1-xVx binary alloy.
3 Which piece of the Fermi surface drives the long period oscillations across Cr(1-x)Vx spacers?
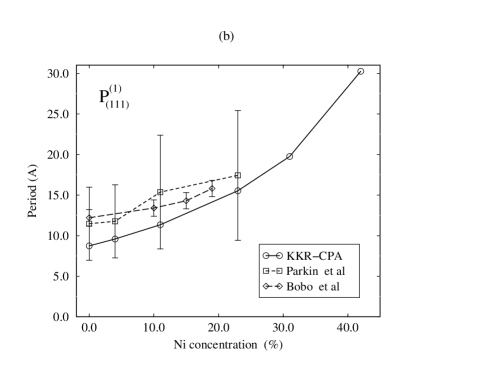
Although the long period oscillation for Fe/Cr/Fe (18 Å) was the first example of Oscillatory coupling discovered[4], until recently the origin of that long period oscillation was the subject of an open debate[13, 17, 18, 19, 20, 21, 22]. In the literature, the most popular candidate parts of the Fermi surface for being relevant are the electron-like lens of the Fermi surface and the N point centered hole-like pocket. A further point of interest is that the long period oscillation appears to be unaffected by the orientation of the specimen, at least for the (100), (110) and (211) directions, leading to the conclusion that the coupling comes from a fairly isotropic region of the Fermi surface[23]. The extra complication that makes it extremely difficult to associate the oscillation period with an area of the Fermi surface comes from the fact that the Cr Fermi surface is fairly complicated with high degree of nesting features arising from the d-states. Its rather difficult even to enumerate all the extremal vectors of the Fermi surface and of course the procedure of just comparing the experimental periods with the modes of the Fourier transform of a total energy calculation totally fails in this case. Of course the panacea would be to calculate the amplitudes of the individual oscillatory terms and reveal which terms are dominant. Such calculations have been done using semi-empirical Tight Binding methods[13, 22], and although the size of the associated period is significantly smaller than the observed, they conclude that the origin of the oscillation is the N hole-like pocket for both the (100) and (110) orientations. Unfortunately, other authors are drawing different conclusions[18, 23].
In ref. [24] we suggested that the evolution of the Fermi surface with alloying in the Cr spacer could give conclusive answer to the debate. Indeed, there are experiments on the OMC across Cr(1-x)Vx as well as Cr(1-x)Mnx spacers for poly-crystalline samples with (110) predominant orientation[25]. The idea is that if the origin of the oscillation is an electron-pocket then that pocket should shrink as V is added enhancing the size of the oscillation period. If on the other hand, the origin is a hole-like pocket the period should decrease when V is added. The opposite apply in the case of alloying with Mn. What the experiment shows is a monotonic decreases of the period with V concentration and increase with Mn concentration, which is consistent with the source of oscillation being a hole-like pocket. Of course the RBM is not quantitatively correct in general, but it serves as a good qualitative picture. Of course, our calculation is based on the KKR-CPA method and someone expects the agreement to be beyond the qualitative level. In fig. 4 the experimental period is shown as a function of the V concentration along with the theoretical periods predicted from various extremal vectors of the alloy Fermi surface. As we see the period predicted from the N-hole-like pocket is the only one which agrees quantitatively with experiment. Thus, our results strongly suggest that the source of the oscillations for both pure Cr as well as Cr(1-x)Vx spacers is the N-hole-like pocket of the Fermi surface[24]. For this particular case the rigid band model seem to agree quantitatively with the more accurate CPA result, as has been shown by Koelling[26] who used that model to draw similar conclusion to ours for the Cr spacer long period oscillation.
The lattice mismatch at the interfaces of the sandwich structures, is one of the factors that could probably affect the agreement between theory and experiment in comparing the sizes of the oscillation periods to the sizes of the extremal vectors of the bulk Fermi surface[27]. In the case of Cr as well as Cr(1-x)Vx spacers, that lattice mismatch is not important since the lattice constants of Cr, V, and Fe are very close to each other, but in other cases like for example Fe/Mo/Fe or Fe/Cr1-xMox/Fe alloy spacers the effect of lattice mismatch might be large enough to be ignored. Thus for instance in ref. [27], we argue that it could be the explanation for the discrepancy between the Rigid Band Model and the significant decrease with concentration been observed experimentally for Fe/Cr1-xMox/Fe systems. The Rigid Band Model is been proved to be correct for the isoelectronic Cr, Mo and their alloys and is not consistent with the decrease in the oscillation period with concentration. We argue in ref, [27] that the size of the effect of lattice mismatch is enough to explain such a behavior, although someone needs to know the exact geometry of the sandwich structure to draw a conclusive evidence.
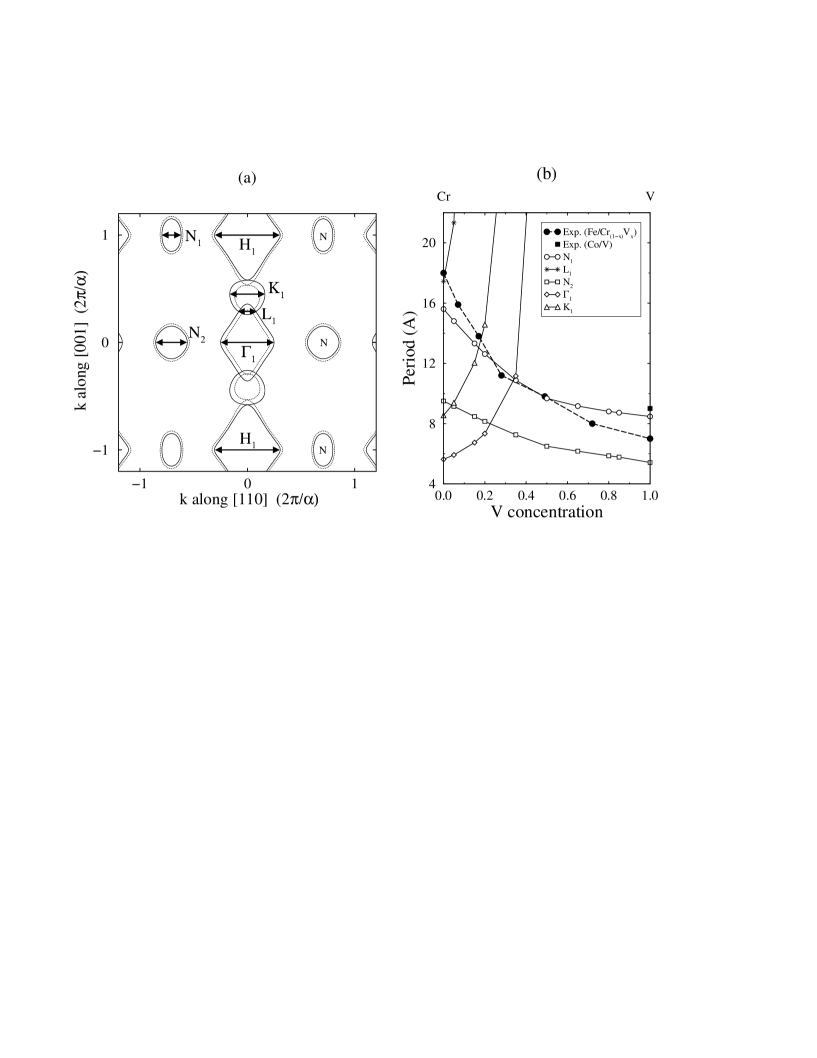
Having established the relation of the N-hole pocket and the OMC across Cr and Cr(1-x)Vx spacers the OMC is proven to be a powerful experimental technique for studying the geometry of that pocket and how it evolves with concentration. In particular the N-hole pocket ellipsoid appears to grow isotropically with V concentration as is shown in fig. 5. In that figure the periods predicted form the 3 smallest N pocket extremal vectors for the (100), (110) and (211) directions are shown as functions of V concentration. That does not appear to be the case in recent 2d-ACAR experiments[28] where a rotation of the N-hole pocket is observed with increasing concentration of Vanadium. The only experimental technique apart from 2-d ACAR which could resolve this extremely delicate feature of the Fermi surface appears to be the OMC.
The long period oscillation across Cr(1-x)Vx spacers is an example in which the alloy theory gives a conclusive answer, by continuity to an outstanding problem concerning the pure metal spacer system.
4 The exponential damping due to disorder scattering.
 |
 |
 |
 |
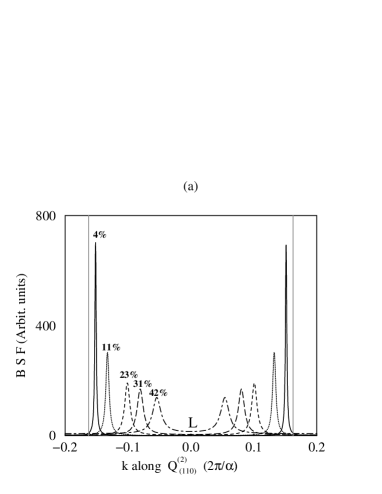
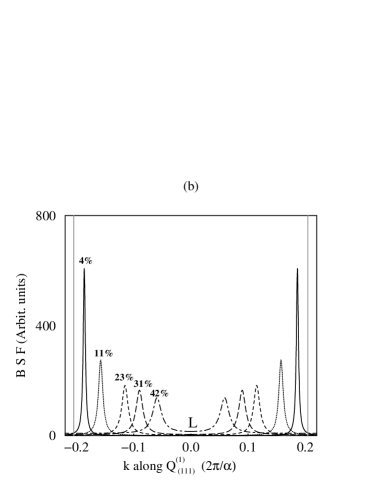
As we have already mentioned an exponential damping of the OMC is present in the case of disordered binary alloy spacers. The characteristic length of the damping, i.e. the quantity in the eq. (2) is related to the coherence length of the quasi-particle states at the endpoints of the extremal vector, which is a measure of the mean free path for these states. A convenient quantity to describe the electronic structure of substitutionally disordered systems such as the random binary alloys is the so called Bloch Spectral Function (BSF) which is the number of states per Energy and wave length[8]. In the case of pure metals that function is simply a sum of delta functions either as function of at a constant wavevector , or as a function of the wavevector for constant value of the energy. For constant where is the Fermi energy the positions of the peaks in k-space define the Fermi surface of the metal. The k-space representation is still a good description of the electronic structure of the alloy although strictly speaking there is periodicity only on the average. In terms of the BSF, the fundamental difference is the peak lowering and broadening being Lorentzian-like. Thus a Fermi surface for the alloy is still defined through the position of the peaks but these peaks have a finite width, the inverse of which defines the coherence lengths we mentioned above. In a simple theory for the OMC in the case of disordered spacer in ref [14] we showed that
| (3) |
where , are the widths of the BSF peaks along the direction of the extremal vector with and labeling the two peaks at the end-points of the extremal vector. Of course the Fermi surface is well defined if the size of is small compared to , i.e. the size of the extremal vector itself. In that case of course, is large compared to the oscillation period , i.e. no damping is observed within the first few oscillation periods.
The obvious question in the light of the above discussion is of course how broad are the spectral functions for the cases of extremal vectors we considered above for the Cu(1-x)Nix and Cr(1-x)Vx Fermi surfaces? In fig 6 we show the BSF along these extremal vectors. We see that for Cu(1-x)Nix at concentrations of the order , where an electronic topological transition (ETT) takes place[30], in order the widths become comparable with the size of the extremal vectors. On the other hand for Cr(1-x)Vx the extremal wave vector size is always very large compared to the width of the peaks. The BSF peaks for the N-hole pocket appear to be the sharpest for the whole Fermi surface. Although ETT occurs in other parts of the Fermi surface, the N-hole pockets are robust in alloying, with only its total volume increased as more V is added. Thus, in both Cu(1-x)Nix () and Cr(1-x)Vx for the whole range of V concentration, no significant damping is expected agreement with the experiments on these two systems[10, 11, 12, 25].
It would be interesting if an alloy spacer system was found with a strong topological transition happening in the area of the extremal vector at some value of the concentration . The exponential damping of the OMC for values of close to could be measured and the dramatic prediction of the theory is that no oscillation would be observed for the concentration where the ETT occurs. Such an experiment would be a direct observation of the ETT. Moreover, the characteristic length of the damping for close to but not equal to would be a direct measurement of the coherence length at particular points of the Fermi surface, i.e. the endpoints of the extremal vector. Of course such measurements require further refinement of the experimental techniques used for measuring the OMC.
5 Calculations of the amplitudes and phases .
The asymptotic analysis leading to a theory of the amplitudes and the phases has been carried out within a number of approaches to the problem of calculating the distortions in the electronic structure of the spacer by the magnetic layers[31]. In particular, it was carried out for the powerfull, fully first principles screened KKR method[32]. Quantitative calculation of the asymptotic formulas are compared with the results of full total energy calculations and experiments in fig. 7. Similar calculations for alloy spacers are in progress.
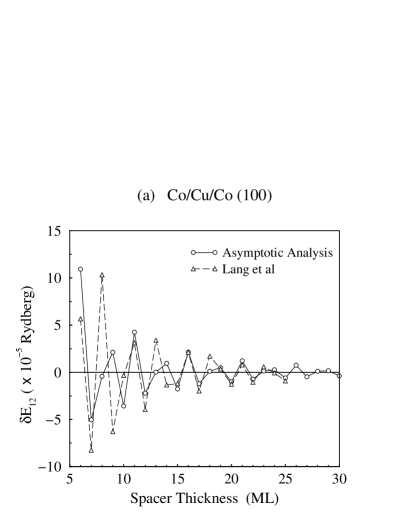
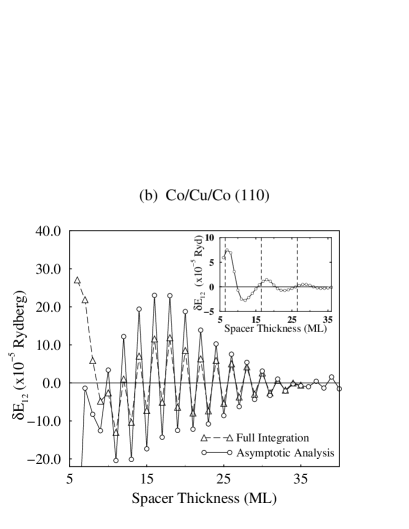
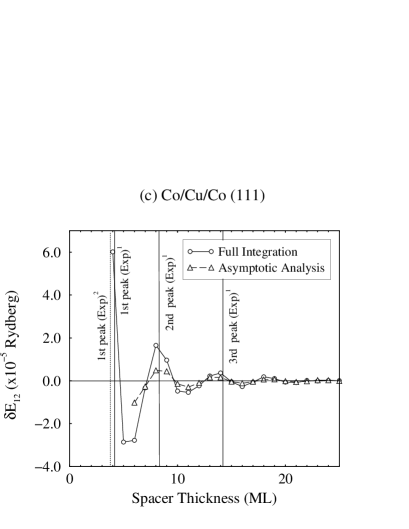
As can be seen in fig. 7 the agreement between our calculated amplitudes and phases with both theoretical [33] and experimental results[34, 35] for the OMC across Co/Cu/Co is remarkable for all the orientations. In particular there is very good quantitative agreement between our results and Lang et al[33] in the amplitudes as seen in fig. 7a for the (100) orientation. Furthermore, there is excellent agreement with the experiments of refs. [34, 35] concerning the phases and periods, i.e. the positions of AF peaks, as seen in the inset of fig. 7b and in fig. 7c. There is only agreement in the order of magnitude with experiments concerning the size of the interaction. For example, for the (100) orientation Johnson et al[34] have measured 0.4 mJ/m2 for an average Cu thickness of 6.7 ML, while we find 3.3 mJ/m2 and -1.0 mJ/m2 for 6 and 7 ML respectively. For the (111) Johnson et al[34] measured 1.1 mJ/m2 for 4 ML of Cu thickness, while our calculated value for the same thickness is 2.1 mJ/m2. The agreement with experiments concerning the amplitudes, although it is restricted to the order of magnitude so far, is at least a convincing evidence that our models have picked up the effect which is also seen by experiments.
In conclusion, we note that the asymptotic formulas such as the one we derived in [31] may play a role in interpreting OMC experiments similar to that of the Lifshitz-Kosevich semi-classical formula, used to deducing the Fermi surface geometry from the measurement of the de Haas van Alphen oscillations.
References
- [1] B. L. Györffy, B. Ginatempo, D. D. Johnson, D. M. Nicholson, F. J. Pinski, J. B. Staunton and H. Winter, Phil. Trans. R. Soc. London A 334 515-526 (1991).
- [2] M. Springford (Ed) “Electrons at the Fermi Surface”, Cambridge University Press, (1980).
- [3] P. T. Coleridge in “Electrons at the Fermi Surface”, Ed. M. Springford, Cambridge University Press, (1980).
- [4] S. S. P. Parkin, N. More, K. P. Roche, Phys. Rev. Lett. 64, 2304 (1990).
- [5] B. Heinrich, J. A. C. Bland (Eds.), Ultrathin Magnetic Structures II, Springer-Verlag (1994).
- [6] P. Bruno, C. Chappert, Phys. Rev. Lett. 67, 1602 (1991).
- [7] D. M. Edwards, J. Mathon, R. B. Muniz and M. S. Phan, Phys. Rev. Lett. 67, 493 (1991); J. Phys.: Cond. Matt., 3, 4941 (1991).
- [8] B. L. Györffy, and G. M. Stocks, ‘Electrons in Disordered Metals and at Metallic Surfaces’, Ed. P. Phariseau, B. Györffy and L. Scheire, NATO ASI Series, Plenum Press, New York (1979).
- [9] J. S. Faulkner, Progress in Matt. Sc., 27, 1-87 (1982).
- [10] S.S.P. Parkin, C. Chappert, F. Herman, Europhys. Lett. 24, p 71 (1993).
- [11] Bobo F-J., Hennet L., Piecuch M. and Hubsch J., Europhys. Lett. 24, pp. 139-144 (1993); ibid. J.Phys.: Condens. Matter 6 2689 (1994).
- [12] S.N. Okuno, K. Inomata, Phys. Rev. Lett. 70, 1711 (1993); ibid. J. Mag. Mag. Matt. 126, 403 (1993).
- [13] M.D. Stiles., Phys. Rev. B, 48, 7238 (1993).
- [14] N. N. Lathiotakis, B. L. Györffy, Újfalussy B and Staunton J (1998) J. Mag. Mag. Matt. 185 293
- [15] N. N. Lathiotakis, B. L. Györffy, J. B. Staunton, J. Phys.: Condens. Matter 10, 10357 (1998).
- [16] E. Bruno, B. Ginatempo, Phys. Rev. B 55, 12946 (1997); E. Bruno, G. M. Florio, B. Ginatempo, E. S. Giuliano, J. Comp. Phys. 111, 248 (1994).
- [17] M. van Schilfgaarde, W. A. Harrison, Phys. Rev. Lett. 71, 3870 (1993).
- [18] D. D. Koelling., Phys. Rev. B 50, 273 (1994).
- [19] D. Li, J. Pearson, S. D. Bader, E. Vescovo, D.-J. Huang, P. D. Johnson, B. Heinrich, Phys. Rev. Lett. 78, 1154 (1997).
- [20] S. Mirbt, A. M. N. Niklasson, B. Johansson, H.L. Scriver, Phys. Rev. B54, 6382 (1996); S. Mirbt, B. Johansson Phys. Rev. B 56, 287 (1997).
- [21] M. D. Stiles, Phys. Rev. 54, 14679 (1996).
- [22] L. Tsetseris, B. Lee, Y-C. Chang, Phys Rev. B 55, 11586 (1997).
- [23] E. E. Fullerton, M. J. Conover, J. E. Mattson, C. H. Sowers, S. D. Bader, Phys. Rev. B, 48, 15755 (1993); ibid J. App. Phys., 75, 6461 (1994).
- [24] N. N. Lathiotakis, B. L. Györffy, E. Bruno, B. Ginatempo and S. S. P. Parkin, Phys. Rev. Lett. 83, 215 (1999).
- [25] M. van Schilfgaarde, F. Herman, S. S. P. Parkin, and J. Kudrnovský. Phys. Rev. Lett., 74, 4063 (1995).
- [26] D. D. Koelling, Phys. Rev. B 59, 6351 (1999).
- [27] N. N. Lathiotakis, B. L. Györffy, B. Ginatempo, E. Bruno, J. Mag. Mag. Matt., 198, 447 (1999).
- [28] A. Alam, et al, to be published.
- [29] S. S. P. Parkin, Phys. Rev. Lett. 67, 3598 (1991).
- [30] E. Bruno, B. Ginatempo, E.S. Giuliano, A.V. Ruban, Y. Vekilov, Phys. Rep., 249, 353 (1994).
- [31] B. Újfalussy, N. N. Lathiotakis, B. L. Györffy, J. B. Staunton, Phil. Mag. B 78, 577 (1998); N.N. Lathiotakis, B. L. Györffy and B. Újfalussy, to be published.
- [32] L. Szunyogh, B. Újfalussy, P. Weinberger, J. Kollár, Phys. Rev. B, 49, 2721 (1994).
- [33] L. Nordström, P. Lang, R. Zeller and P. H. Dederichs, Phys. Rev. B50, 13058 (1994).
- [34] M. T. Johnson, R. Coehoorn, J. J. de Vries, N. W. E. McGee, J. aan de Stegge, P. J. H. Bloemen, Phys. Rev. Lett. 69, 969 (1992).
- [35] S. S. P. Parkin, R. F. Marks, R. F. C. Farrow, G. R. Harp, Q. H. Lam, and R. J. Savoy, Phys. Rev. B46, 9262 (1992).
- [36] S. S. P. Parkin, R. F. Marks, R. F. C. Farrow, G. R. Harp, Q. H. Lam, and R. J. Savoy, Phys. Rev. B46, 9262 (1992).