[
Angle-resolved photoemission study of untwinned PrBa2Cu3O7: undoped CuO2 plane and doped CuO3 chain
Abstract
We have performed an angle-resolved photoemission study on untwinned PrBa2Cu3O7, which has low resistivity but does not show superconductivity. We have observed a dispersive feature with a band maximum around (/2,/2), indicating that this band is derived from the undoped CuO2 plane. We have observed another dispersive band exhibiting one-dimensional character, which we attribute to signals from the doped CuO3 chain. The overall band dispersion of the one-dimensional band agrees with the prediction of model calculation with parameters relevant to cuprates except that the intensity near the Fermi level is considerably suppressed in the experiment.
pacs:
PACS numbers: 74.25.Jb, 71.27.+a, 73.20.Dx, 79.60.Bm]
I Introduction
In the study of YBa2Cu3O7 (YBCO) and its family cuprates, the physical properties of the CuO3 chain itself have been a subject of interest as well as those of the CuO2 plane. In particular, evidence for charge instability has been observed in the hole-doped CuO3 chain of YBCO and its relation with superconductivity has been discussed. [1] Among the YBCO family compounds, PrBa2Cu3O7 (PBCO) is unique in that it does not show superconductivity while the other rare-earth substituted YBCO compounds are superconducting. [2] Optical studies [3] have revealed that the CuO2 plane is not doped with holes and consequently that the superconductivity is suppressed in PBCO. In order to explain the hole depletion in the CuO2 plane, several models have been proposed. Among them, the model proposed by Fehrenbacher and Rice (FR), [4] in which the Pr 4-O 2 states trap holes from the Cu 3-O 2 band, has been most successful. It was also argued that hole transfer between the CuO2 plane and the CuO3 chain may play an important role. [5] Experimental studies of the band structure of the CuO2 plane, the CuO3 chain and the Pr 4 state should further reveal the difference between the superconducting YBCO and non-superconducting PBCO. [6] Another important and potentially even more interesting point is that, if the CuO2 plane is undoped and the CuO3 chain is doped as suggested by the various experimental and theoretical studies, PBCO may give us an opportunity to study a hole doped CuO3 chain with good one-dimensionality compared to YBCO. Recently, an angle-resolved photoemission spectroscopy (ARPES) study of SrCuO2 by Kim et al. [7] has shown the spinon and holon bands of the undoped CuO3 chain, which is a manifestation of spin-charge separation in the one-dimensional system, and has attracted much interest. However, no ARPES study of a hole-doped CuO3 chain has been made so far. Although YBCO has been studied by ARPES, [8] the band dispersion from the CuO3 chain is far from being one dimensional because of the strong interaction between the chain and the plane.
In this paper, we report an ARPES study of untwinned PBCO samples which have relatively low resistivity but is not superconducting. As we show below, we observe at least two kinds of dispersive features: one from the undoped antiferromagnetic CuO2 plane and the other which is highly one-dimensional band from the doped CuO3 chain.
II Experimental
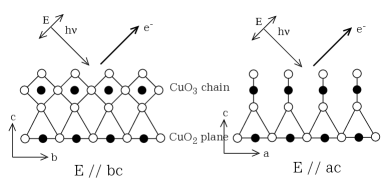
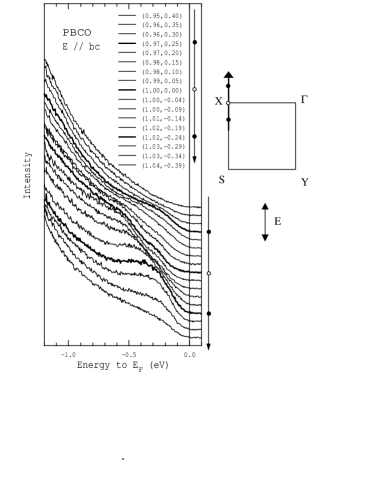
Single crystals of PBCO were grown in a MgO crucible by a pulling technique. The composition was determined to be Pr1.02Ba1.98Cu2.92Mg0.08O7 by inductively coupled plasma analysis. [9] Because a small amount of Mg-impurities originating from the crucible are substituted preferentially for the plane Cu sites, [10] it is expected that the CuO3 chain is not affected by these impurities. Rectangular shaped samples were cut out from the as-grown crystal and annealed at 500 ∘C in oxygen atmosphere under uniaxial pressure. The resistivity parallel to the chain direction increases with cooling from 8 mcm at 300 K up to 10 cm at 10K and that perpendicular to the chain direction increases from 400 mcm at 300 K to 70 cm at 10K. The ARPES measurements were performed using the Vacuum Science Workshop chamber attached to the undulator beamline 5-3 of Stanford Synchrotron Radiation Laboratory (SSRL). Incident photons were linearly polarized and had energy of 29 eV. The total energy resolution including the monochromator and the analyzer was approximately 40 meV. The angular resolution was degree, which gives the momentum resolution of 0.05 at = 29 eV. [In the text, momenta along the - and -axes are given in units of and , respectively. Here, (= 3.87 ) and (= 3.93 ) are the lattice constants of PBCO perpendicular and parallel to the chain direction, respectively.] The chamber pressure during the measurements was less than Torr. The samples were cooled to 10 K and cleaved in situ. The cleaved surface was the plane. Orientation of the - and -axes was done by Laue diffraction before and after the measurement. The cleanliness of the surfaces was checked by the absence of a hump at energy eV. [8] All the spectra presented here were taken within 30 hours of cleaving. We cleaved the samples three times and checked the reproducibility. As shown in Fig. 1, ARPES data were taken in two arrangements: an arrangement in which the photon polarization is in the plane and is perpendicular to the chain and an arrangement in which is in the plane and has a component parallel to the chain. The position of the Fermi level () was calibrated with gold spectra for every measurement.
III Results and discussion
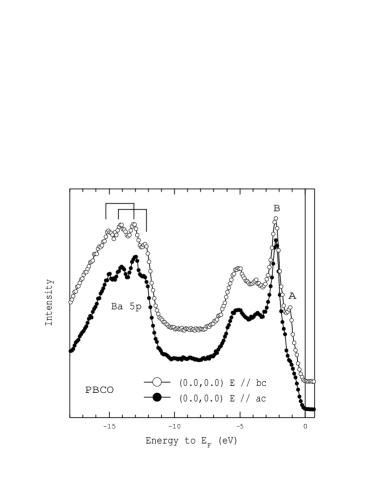
The entire valence band data measured at (,) = (0,0) are shown in Fig. 2. Here, and are momenta along the - and -axes, respectively. The Ba 5 core levels are split into surface and bulk components as observed in YBCO, [8] indicating that the cleaved surface is as good as that of YBCO. The peak labeled as A is intense for , while it loses its weight for . This strong polarization dependence indicates that peak A is derived from the CuO3 chain and that the CuO3 chain is well aligned at the surface. Peak A can be attributed to the non-bonding O 2 states of the CuO3 chain. [7] On the other hand, the intensity of peak B is insensitive to the photon polarization, indicating that it is derived from the CuO2 plane. Peak B has energy of -2.3 eV and is similar to that found in Sr2CuO2Cl2. [11] As pointed out by Pothuizen et al., [11] peak B corresponds to the non-bonding O 2 states of the CuO2 plane.
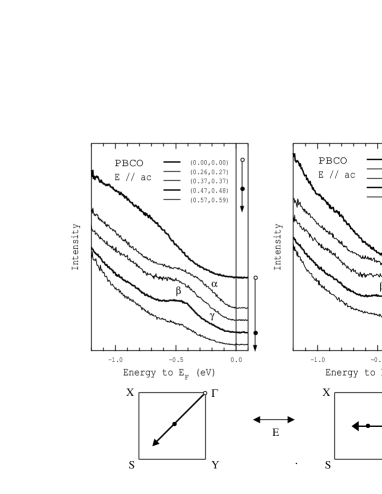
Figure 3 shows ARPES spectra along the (0,0)(,) direction and those along the (0,/2)(,/2) direction taken with . The uppermost and second uppermost spectra in the left panel were taken at (0,0) and (/4,/4), respectively. The intensity from -0.2 to -0.4 eV is enhanced at (/4,/4) compared to that at (0,0). Let us denote this feature as and discuss it in following paragraphs. The spectra taken at (/2,/2) are shown by the thicker solid curves and marked by the closed circles in the two panels of Fig. 3. Figure 4 shows ARPES spectra nearly along the (0,0)(,) direction for . In Fig. 4, the spectrum taken at (/2,/2) is shown by the thicker solid curve and marked by the closed circle. In these spectra taken around (/2,/2), a dispersive feature with a band maximum at -0.4 eV is clearly seen and is labeled as . This structure is very similar to that found at (/2,/2) in Sr2CuO2Cl2 and can be interpreted as the Zhang-Rice (ZR) singlet state of the undoped antiferromagnetic CuO2 plane. [11] The energy difference between the ZR state at (/2,/2) (structure ) and the non-bonding O 2 state at (0,0) (peak B) is 2 eV in PBCO, in agreement with the observation in Sr2CuO2Cl2. [11] In addition to the ZR state, a weak structure at -0.2 eV was observed around (/2,/2).
By comparing Figs. 3 and 4, one can notice that the intensity of structure at (/4,/4) is weak for compared to that for . In addition, while the relative intensity of structure to structure has strong polarization dependence, that of structure to structure has only small polarization dependence. This suggests that these two structures and have different origins. As discussed in the next paragraph, structure at (/4,/4), which shows strong polarization dependence, is part of a one-dimensional band from the CuO3 chain. On the other hand, since structure shows weak polarization dependence and probably has two-dimensional character, it is tempting to interpret structure as a Pr 4-O 2 hybridized state or a so-called FR state. If this is the FR state, the present spectra are consistent with the FR scenario because the FR state is closer to than the ZR state of the CuO2 plane. [12] The situation that the FR state is partially occupied and is observable in photoemission spectroscopy is consistent with the optical result, which has shown that the formal valence of the Pr ion is +3.5 and the FR state is occupied by 0.5 electrons on the average if it exists. [3] This argument on structure should be confirmed by using Pr 4-4 resonant photoemission in the future.
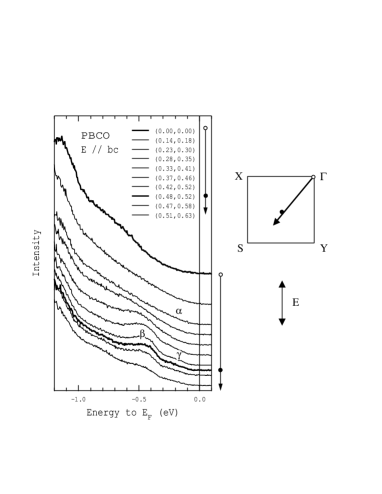
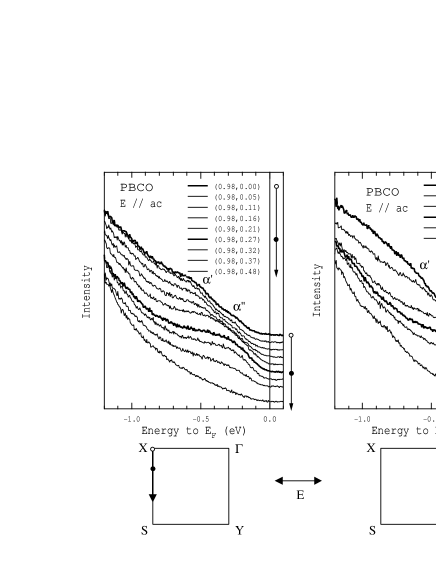
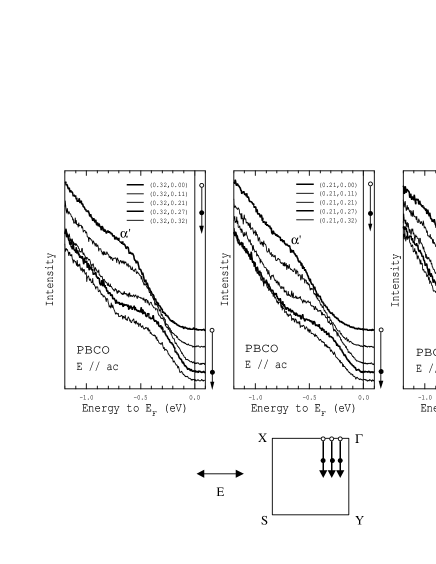
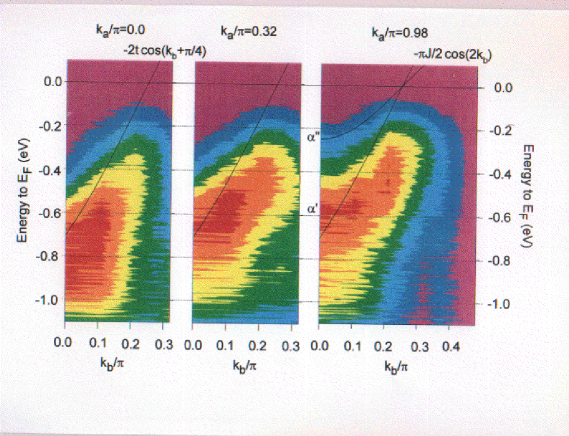
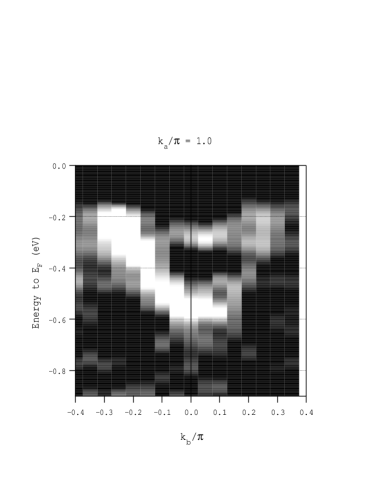
In Figs. 5 and 6, we have plotted ARPES data along the chain direction taken with . In the spectra taken at (,0) ( is 0, /10, /5, 3/10, or ), which are shown at the uppermost position in each panel, the broad feature labeled as is located at -0.7 0.2 eV. This feature moves toward as increases and reaches a band maximum with energy of -0.2 eV around (,/4). The spectra taken at (,/4) are shown by the thicker solid curves and marked by the closed circles in each panel of Figs. 5 and 6. This feature loses its weight for and the spectrum at (,/2) is almost featureless. This behavior does not depend on , i.e., the momentum perpendicular to the chain, meaning that this dispersive feature is highly one dimensional. In order to demonstrate the dispersion more clearly, the contour plots of the difference spectra, which are obtained by subtracting the featureless spectrum at (,/2) from the spectra at each -point, are shown for = 0, 3/10, and in Fig. 7. Indeed, the overall dispersion of structure does not depend on so much. Therefore, we can conclude that the band is derived from the CuO3 chain. Structure at (/4,/4) [see Fig. 3] is also part of this one-dimensional band. The fact that the one-dimensional band reaches a band maximum at /4 and disappears for indicates that the filling of the Cu 3-O 2 band in the CuO3 chain is close to 1/4, namely, the formal valence of Cu in the chain is +2.5. This is consistent with the optical study. [3]
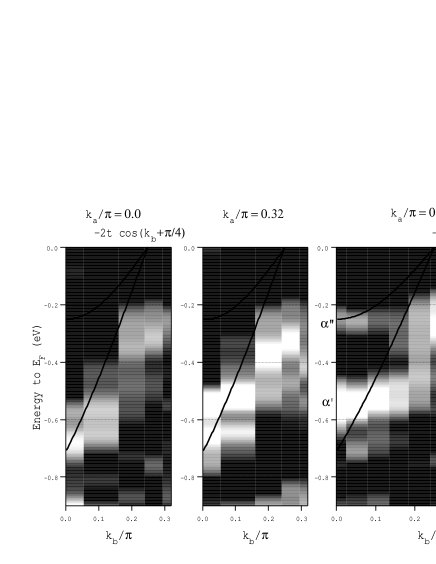
There are two interesting points in this one-dimensional band. The first point is that the other structure (), which has higher energy than structure , is observed around (,0) [Compare the uppermost spectra shown by the thicker solid curves in the two panels of Fig. 5.]. In order to show the dispersion clearly, the density plots of the second derivatives of the ARPES spectra along the chain direction are diplayed for = 0, 3/10, and in Fig. 8. The dispersion of is visible in the spectra for = which is shown in the right panel of Fig. 8. It is possible to attribute and to the holon and spinon bands of the Tomonaga-Luttinger (TL) liquid. [13] While the total width of the holon band is predicted to be 4, that of the spinon band has an energy scale of . [14] In Figs. 7 and 8, model holon and spinon dispersions of -2cos(+/4) and -cos(2) [13, 14] are shown by solid curves. The two curves with of 0.5 eV and of 0.16 eV, which are reasonable values for the cuprates, [14] roughly follow the dispersions in Fig. 8. The second point is that the spectral weight near is considerably suppressed in the experimental data in disagreement with the theoretical prediction on the TL liquid. [13, 14] Although the lengths of the CuO3 chain at the surface are finite because of the surface termination, [8] the observation of the nice dispersive behavior indicates that the lengths of the CuO3 chains are long enough to allow us to compare the data with the theory for the doped CuO3 chain. A possible origin of the intensity suppression near is the instability of the nearly-1/4-filled CuO3 chain leading to charge density waves (CDW). [15] Actually, charge instability in the hole-doped CuO3 chain of PBCO has been observed by NMR and NQR measurements. [16] In addition, it has recently been pointed out that the spectral function of one-dimensional CDW insulators can have the holon and spinon dispersions. [17]
Here, it should be remarked how we would observe the feature with . In PBCO, the CuO4 square plane of the CuO3 chain is perpendicular to the plane, i.e., the sample surface. Therefore, the photon polarization has a component perpendicular to the sample surface, namely, parallel to the CuO4 square plane of the CuO3 chain as shown in Fig. 1. It is this additional component of the polarization that gives a finite transition matrix element to the ZR state in the CuO3 chain.
With , the contribution from the chain is very weak when is small. As becomes larger, the intensity of the one-dimensional band for becomes larger and, at = , is comparable to that for . Figure 9 shows ARPES spectra along the (,/2)(,-/2) direction, namely, along the chain direction taken with . The two dispersive features, which can be interpreted as the holon and spinon dispersions, are also observed for . In order to show the dispersion obtained for clearly, the density plot of the second derivatives of the ARPES spectra is displayed in Fig. 10. The dispersions of the holon and spinon bands are almost symmetric with respect to = 0 and reach maxima around = /4 and -/4. These dispersions obtained for are consistent with those obtained for .
In the present ARPES data taken with and , the relative intensity of the spinon band to the holon band strongly depends on . The spinon band becomes more intense as becomes larger. The same behavior was found in the undoped CuO3 chain by Kim et al. [7] Further experimental and theoretical investigation is required to reveal this peculiar dependence of the spectral function.
IV Conclusion
In conclusion, we have observed the band dispersions from the CuO2 plane and the hole-doped CuO3 chain of non-superconducting PBCO. The band dispersion from the CuO2 plane clearly shows that PBCO has an undoped insulating CuO2 plane. On the other hand, the one-dimensional dispersive feature from the doped CuO3 chain consists of two structures which can be interpreted as holon and spinon bands. These bands lose intensity beyond /4, indicating that the CuO3 chain is nearly 1/4-filled. Further experimental and theoretical studies are desirable to reveal the nature of the one-dimensional band including its momentum and polarization dependence.
Acknowledgment
We would like to thank M. Schabel, I. Terasaki, T. Thoyama, S. Maekawa, D. D. Sarma, and K. Penc for valuable comments. We are grateful to P. J. White, A. Y. Matsuura and the staff of SSRL for technical support. This work was supported by a Grant-in-Aid for Scientific Research from the Ministry of Education, Science, Sports and Culture of Japan, Special Coordination Funds of the Science and Technology Agency of Japan, the New Energy and Industrial Technology Development Organization (NEDO), the U. S. DOE, Office of Basic Energy Science and Division of Material Science. SSRL is operated by the U. S. DOE, Office of Basic Energy Sciences, Division of Chemical Sciences.
REFERENCES
- [1] H. A. Mook et al., Phys. Rev. Lett. 77, 370 (1996); H. L. Edwards et al., Phys. Rev. Lett. 73, 1154 (1994).
- [2] H. B. Radousky, J. Mater. Res. 7, 1917 (1992).
- [3] K. Takenaka et al., Phys. Rev. B 46, 5833 (1992).
- [4] R. Fehrenbacher and T. M. Rice, Phys. Rev. Lett. 70, 3471 (1993); A. I. Liechtenstein and I. I. Mazin, Phys. Rev. Lett. 74, 1000 (1995).
- [5] D. Khomskii, J. Supercond. 6, 69 (1993).
- [6] Very recently, it has been reported that PBCO synthesized by the traveling-solvent floating-zone method has a longer c-axis lattice parameter than the usual non-superconducting PBCO and shows superconductivity. [Z. Zou et al., Phys. Rev. Lett. 80, 1074 (1998).] The essential difference between the superconducting and non-superconducting PBCO samples remain controversial.
- [7] C. Kim et al., Phys. Rev. Lett. 74, 964 (1996); Phys. Rev. B 56, 15589 (1997).
- [8] M. Schabel et al., Phys. Rev. B 55, 2796 (1997); Phys. Rev. B 57, 6090 (1997); Phys. Rev. B 57, 6107 (1997).
- [9] Inductively coupled plasma analysis is widely used to to determine cation ratios. For example, see A. Longmore et al., Phys. Rev. B 53, 9382 (1996).
- [10] J. T. Marhert et al., MRS Bull., 41, 37 (1989).
- [11] B. O. Wells et al., Phys. Rev. Lett. 74, 964 (1995); J. J. M. Pothuizen et al., Phys. Rev. Lett. 78, 717 (1997); C. Kim et al., Phys. Rev. Lett. 80, 4245 (1998).
- [12] Recently, the unoccupied part of the FR state has been observed by x-ray absorption spectroscopy. [M. Merz et al., Phys. Rev. B 55, 9160 (1997).]
- [13] J. Solyom, Adv. Phys. 28, 201 (1979); V. Meden and K. Schnhammer, Phys. Rev. B 46, 15753 (1992); J. Voit, Phys. Rev. B 47, 6740 (1993); K. Penc et al., Phys. Rev. Lett. 77, 1390 (1996).
- [14] S. Maekawa, T. Thoyama, and S. Yunoki, Physica C 263, 61 (1996) and unpublished results.
- [15] P. A. Lee, T. M. Rice, and P. W. Anderson, Phys. Rev. Lett. 31, 462 (1973); B. Dardel et al., Phys. Rev. Lett. 67, 3144 (1991).
- [16] B. Grvin et al., Phys. Rev. Lett. 80, 2405 (1998).
- [17] J. Voit, in Proceedings of the Ninth International Conference on Recent Progress in Many-Body Theories, edited by D. Neilson, (World Scientific, 1998).