[
Charge ordering and chemical potential shift in La2-xSrxNiO4 studied by photoemission spectroscopy
Abstract
We have studied the chemical potential shift in La2-xSrxNiO4 and the charge ordering transition in La1.67Sr0.33NiO4 by photoemission spectroscopy. The result shows a large ( 1 eV/hole) downward shift of the chemical potential with hole doping in the high-doping regime ( 0.33) while the shift is suppressed in the low-doping regime ( 0.33). This suppression is attributed to a segregation of doped holes on a microscopic scale when the hole concentration is lower than . In the sample, the photoemission intensity at the chemical potential vanishes below the charge ordering transition temperature 240 K.
pacs:
PACS numbers: 79.60.Bm, 71.28.+d, 71.30.+h, 75.50.Ee]
Recently charge ordering phenomena in transition-metal oxides have attracted considerable interest, particularly due to the possible relationship between charge stripes and high-temperature superconductivity in the cuprates or giant magnetoresistance in the manganites. Charge ordering in a stripe form in the nickelates La2-xSrxNiO4 has been well established experimentally [2] and theoretically [3] while it is more controversial in the cuprates, e.g., La2-x-yNdySrxCuO4 with . [4] In La2-xSrxCuO4, charge stripes, if exist, are dynamical, half-filled with holes and run along the Cu-O bond directions, whereas in La2-xSrxNiO4 they are static, filled with holes, and run along the diagonal Ni-Ni directions. In order to characterize the behaviors of the stripe fluctuations in the cuprates and to elucidate their relationship to the superconductivity, it is important to study the well characterized case of the nickelates in more detail. It has been established that the charge ordering in the diagonal stripe form in La2-xSrxNiO4 is most stable at . [2, 5, 6, 7] For this composition, neutron scattering studies have shown that charge ordering occurs below 240 K and antiferromagnetic ordering occurs below 190 K :[6] Electrical resistivity shows a steep increase below .[5]
In this paper, we report on a photoemission study of the chemical potential shift in La2-xSrxNiO4 as a function of hole concentration and the temperature dependence of photoemission spectra across the phase transitions for . The shift of the electron chemical potential as a function of electron density is related to the charge compressibility or the charge susceptibility through or and can be measured through the shifts of spectral features in photoemission spectra since binding energies in the photoemission spectra are experimentally referenced to the chemical potential , namely, the Fermi level. The chemical potential shift has been studied for La2-xSrxCuO4 (LSCO) and found to be suppressed in the underdoped region .[8] The suppressed chemical potential shift, or equivalently the enhanced charge compressibility, in spite of the reduced density of states at the chemical potential as measured by the electronic specific heat, [10] has been interpreted as due to the opening of a pseudogap or to a microscopic phase separation.[8] Indeed, such a pseudogap opening has been confirmed by a subsequent angle-resolved photoemission study of LSCO.[9]
Single crystals of La2-xSrxNiO4+y/2 (LSNO) were prepared by the floating zone method. Hole concentration except for the 0 sample was determined by iodimetric titration with an accuracy of 0.01. The chemical compositions thus determined are tabulated in Table I. X-ray photoemission spectroscopy (XPS) measurements were performed using a spectrometer equipped with a Mg source ( 1253.6 eV) and a PHI double-pass cylindrical-mirror analyzer. The energy resolution including the x-ray source and the analyzer was 1.0 eV but we could determine the shifts of core levels to an accuracy of 50 meV as in the case of LSCO.[8] Binding energies were calibrated using Au evaporated on the samples. All the XPS spectra were taken at liquid-nitrogen temperature ( 77 K). High-resolution ultraviolet photoemission spectroscopy (UPS) measurements were carried out using a He I resonance line ( 21.2 eV) and VSW and Omicron 125-EA hemispherical analyzers. The He I spectra have been corrected for the He I∗ satellite. In order to determine the Fermi level () and to estimate the instrumental resolution, Au was evaporated on each sample. The energy resolution was estimated to be 25-30 meV. The sample surfaces were repeatedly scraped in situ with a diamond file to obtain clean surfaces. The cleanliness of the surfaces was checked by lack of contamination/degradation-related features on the higher binding-energy side of the O 1 peak in the XPS spectra or that at and eV in the UPS spectra.
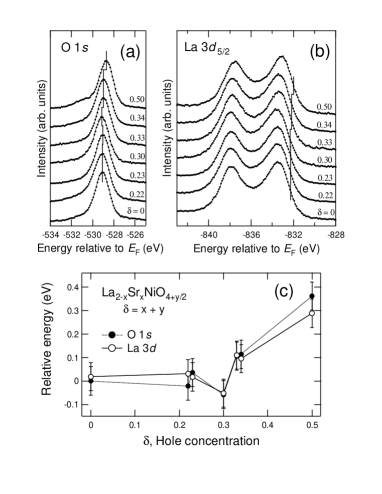
Figure 1 shows the XPS spectra of the O and La core levels taken at liquid-nitrogen temperature. The vertical lines indicate the estimated positions of the core levels. As for the La peak, the shift was estimated from the position at half peak height on the lower-binding-energy side of the peak because the effect of surface degradation appears on the higher-binding-energy side. Estimated shifts of the O and La spectra are plotted in Fig. 1(c). Now, we can assume that the shifts of the O and La core levels are largely due to the shift of the chemical potential as in the case of LSCO[8] for the following reasons. First, the identical shifts of the O and La spectra with indicate that the effect of changes in the Madelung potential caused by the La Sr2+ substitution can be neglected. This is because the changes in the Madelung potential would cause shifts the core levels of the O2- anion and the La3+ cation in the opposite directions if this effect were significant. Second, changes in the number of electrons of the O and La atoms with hole concentration, which may cause shifts of the La and O core levels, can also be neglected. Unfortunately, it was not possible to measure the shift of the Ni core level with sufficient accuracy because the Ni peak was overlaid by the La peak and the Ni peak was too broad.
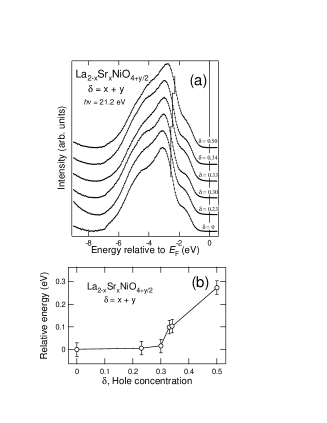
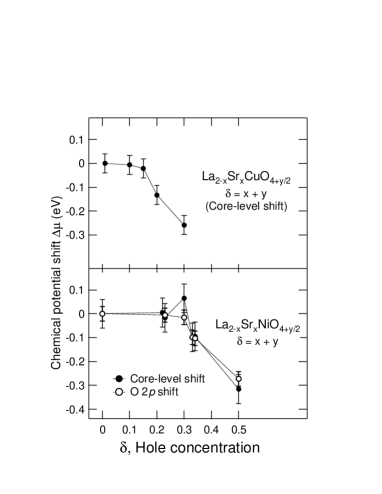
The valence-band spectra of LSNO with various hole concentrations were also measured using UPS as shown in Fig. 2(a) and the spectral shift was deduced in the same way. All the spectra were taken at 150 K except for , whose spectrum was measured at 230 K to avoid charging effect. These spectra have been normalized to the peak height at eV. The shift was estimated from the non-bonding O peak at eV because its electronic state should be insensitive to the hole concentration compared to the final states at eV. In order to avoid the effect of surface degradation, which appear at eV, the shift of the O peak was estimated from the position at 3/4 peak height on the lower-binding-energy side of the peak as indicated by vertical lines in Fig. 2(a). Figure 2(b) shows the shift of the O peak thus evaluated. The shift of the non-bonding O peak should represents the chemical potential shift in the same way as that of the O peak. Indeed, deduced from the shift of the O levels and that deduced from the average shift of the O and La levels agree with each other as shown in Fig. 3(a), where , , and are changes in the binding energies of the O , O , and La levels, respectively.
The sign of is consistent with the downward shift as expected for hole doping. However, the suppression of the shift for cannot be explained within a rigid-band picture because the chemical potential in an insulator would shift rapidly with hole doping in the rigid-band picture. Therefore, this non-rigid-band behavior implies remarkable correlation effects in LSNO. Such a suppression of has also been found in LSCO as shown in Fig. 3(b),[8] where shows a large ( 1.5 eV/hole) downward shift with hole doping in the overdoped ( 0.15) region and a small ( 0.2 eV/hole) shift in the underdoped ( 0.15) region. In LSNO, shows a large ( 1.5 eV/hole) downward shift for 0.33 and a small ( 0.2 eV/hole) shift for 0.33. The low-doping region of 0.33 in the nickelates is thus analogous to the underdoped region of 0.15 in the cuprates. Since LSCO is considered to show dynamical stripe fluctuations according to the inelastic neutron scattering studies,[11] it is likely that the pinning of below the critical hole concentration is a common phenomenon for stripe formation. The following scenario may be considered as a common mechanism for the pinning of . Charge ordering in a stripe form is a kind of “phase separation” into a hole-rich region and a hole-poor region on a microscopic length scale. The hole chemical potential (where is the electron chemical potential) is the energy required to add one hole to the system. In general, increased holes concentration increases the average hole-hole repulsion per hole and hence increases if the hole distribution is spatially uniform. Therefore, the absence of change in with hole doping suggests that there is no increase in the average hole-hole repulsion with increasing hole concentration. This can be made possible for a system in which holes are segregated, e.g., in a stripe form. For there is large downward shift of with hole doping, indicating an increase in the hole-hole repulsion between the overdoped holes. Therefore, it is considered that the repulsive interaction between hole stripes becomes significant for , where the stable stripe ordering cannot survive. It is interesting to note that the shift of for LSCO and LSNO in the overdoped region is the same in magnitude in spite of their quite different electronic properties, i.e., metallic versus insulating.
A small but finite jump of eV from 0.30 to 0.33 appears to exist, according to Fig. 3. This jump may be explained by the gap opening in the 0.33 material as observed by the optical conductivity measurements:[12] If the gap remains stable for a finite range of hole concentration around due to the high stability of the stripe, in going from to , should show a jump equal to the magnitude of gap. The jump of 0.1 eV is smaller than the gap value of 0.26 eV estimated from the optical spectra.[12] The discrepancy can be explained by the different experimental methods because the optical measurements probe the direct (momentum-conserving) gap whereas the chemical potential shift probes the minimum gap (which may be indirect).
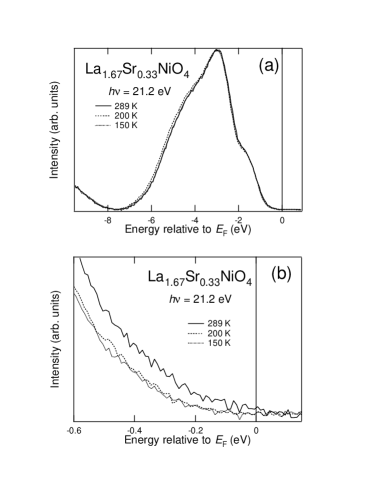
Figure 4 shows valence-band spectra of La1.67Sr0.33NiO4 taken at 150, 200, and 289 K in order to study spectral changes above and below the charge-ordering temperature = 240 K. Here, the background has been subtracted assuming the secondary-electron cascade process[13] and the spectra have been normalized to the peak height at eV. It should be noted that the following interpretation of the spectra is almost independent of the normalization procedure.
Each spectrum near in Fig. 4(b) shows no Fermi edge, which is consistent with the insulating behavior below room temperature.[5] The intensity near clearly changes between above (289 K) and below (150 and 200 K) although there are no significant changes in the wide range spectra shown in Fig. 4(a). It should be noted that the feature at eV is significantly broadened above . This broadening is much stronger than that expected ¿from the temperature broadening between 289 and 200 K and seems to reflect the order-to-disorder transition of charge carriers at . The decrease of the intensity at in going from 289 to 200 K would be due to the gap opening at caused by the charge ordering as observed in the optical conductivity.[12] On the other hand, there is little change in the intensity between 150 and 200 K, indicating that the spectral intensity is not much affected by the spin ordering across (= 190 K). These results are consistent with the electrical resistivity,[12] which shows a large change between 200 and 289 K and little changes between 150 and 200 K.
In conclusion, we have observed that the chemical potential in La2-xSrxNiO4 shows a large ( 1 eV/hole) downward shift with hole concentration in the high doping regime ( 0.33) while it shows no appreciable shift in the low doping regime ( 0.33). We have explained this observation as due to a segregation of doped holes on a microscopic length scale when the hole concentration is lower than , where the stable charge stripes are formed. In La1.67Sr0.33NiO4, the photoemission spectra exhibit subtle changes across the charge ordering transition temperature 240 K: the intensity at vanishes below , consistent with the transport and optical properties.
The authors would like to thank Dr. Y. Aiura for useful advise in designing the sample holder. MS is indebted to H. Hayashi for collaboration in the initial stage of this work. This work was supported by a Special Coordination Fund from the Science and Technology of Japan and Agency and the New Energy and Industrial Development Organization (NEDO).
REFERENCES
- [1] To whom correspondence should be sent.
- [2] J. M. Tranquada, D. J. Buttrey and V. Sachan, Phys. Rev. B 54, 12318 (1996).
- [3] J. Zaanen and P. B. Littlewood, Phys. Rev. B 50, 7222 (1994); J. Zaanen and A. M. Ole, Ann. Physik 5, 224 (1996)
- [4] J. M. Tranquada, B. J. Sternlieb, J. D. Axe, Y. Nakamura, and S. Uchida, Nature 375, 561 (1995); J. M. Tranquada, J. D. Axe, N. Ichikawa, A. R. Moodenbaugh, Y. Nakamura, S. Uchida, Phys. Rev. Lett., 338 (1997).
- [5] S-W. Cheong, H. Y. Hwang, C. H. Chen, B. Batlogg, L. W. Rupp, Jr., and S. A. Carter, Phys. Rev. B 49, 7088 (1994).
- [6] S. H. Lee and S-W. Cheong, Phys. Rev. Lett. 79, 2514 (1997).
- [7] H. Yoshizawa, T. Kakeshita, R. Kajimoto, T. Tanabe, and Y. Tokura, submitted to Phys. Rev. Lett.
- [8] A. Ino, T. Mizokawa, A. Fujimori, K. Tamasaku, H. Eisaki, S. Uchida, T. Kimura, T. Sasagawa and K. Kishio, Phys. Rev. Lett. 79, 2101 (1997).
- [9] A. Ino, T. Mizokawa, K. Kobayashi, A. Fujimori, T. Sasagawa, T. Kimura, K. Kishio, K. Tamasaku, H. Eisaki, and S. Uchida, Phys. Rev. Lett. 81, 2124 (1998).
- [10] M. Oda, K. Hoya, R. Kubota, C. Manabe, N. Momono, T. Nakano, and M. Ido, Physica C 281, 135 (1997).
- [11] K. Yamada, C. H. Lee, K. Kurahashi, J. Wada, S. Wakimoto, S. Ueki, H. Kimura, Y. Endoh, S. Hosoya, G. Shirane, R. J. Birgeneau, M. Greven, M. A. Kastner and Y. J. Kim, Phys. Rev. B 57, 6165 (1998).
- [12] T. Katsufuji, T. Tanabe, T. Ishikawa, Y. Fukuda, T. Arima and Y. Tokura, Phys. Rev. B 54, 14230 (1996).
- [13] Xiaomei Li and V. E. Henrich, J. Electron Spectrosc. Relat. Phenom. 63, 253 (1993).
| 0 | 0.22 | 0.23 | 0.30 | 0.33 | 0.34 | 0.50 | |
|---|---|---|---|---|---|---|---|
| 0 | 0.10 | 0.20 | 0.30 | 0.33 | 0.36 | 0.50 | |
| 0 | 0.12 | 0.03 | 0.00 | 0.00 | -0.02 | 0.00 |