Glass transitions and dynamics in thin polymer films:
dielectric relaxation of thin films of polystyrene
Abstract
The glass transition temperature and the temperature corresponding to the peak in the dielectric loss due to the -process have been simultaneously determined as functions of film thickness through dielectric measurements for polystyrene thin films supported on glass substrate. The dielectric loss peaks have also been investigated as functions of frequency for a given temperature. A decrease in was observed with decreasing film thickness, while was found to remain almost constant for and to decrease drastically with decreasing for . Here, is a critical thickness dependent on molecular weight. The relaxation time of the -process, which was measured as the frequency at which the dielectric loss realizes its peak value at a given temperature, was found to have a dependence similar to that of . The relaxation function for the -process was obtained by using the observed frequency dependence of the peak profile of the dielectric loss. The exponent , which was obtained from the relaxation functions, decreases as thickness decreases. This suggests that the distribution of relaxation times for the -process broadens with decreasing thickness. The thickness dependence of is directly related to the distribution of relaxation times for the -process, not to the relaxation time itself. The value of the thermal expansion coefficient normal to the film surface was found to increase with decreasing film thickness below , but to decrease with decreasing film thickness above . These experimental results are discussed in the context of a three-layer model in which within thin films there are three layers with different mobilities and glass transition temperatures.
pacs:
PACS numbers: 64.70.Pf, 68.60.-p, 77.22.GmI Introduction
Recently, glass transitions in amorphous materials have been investigated by many researchers. However, the mechanism involved in glass transitions is not yet fully understood [2, 3, 4]. Understanding the behavior of the characteristic length scale of the dynamics of supercooled liquids near the glass transition is the most important problem to be solved in such studies. In Adam and Gibbs’ theory, it is assumed that there is a domain in which collective particle motion can occur and its size grows as the temperature is lowered. This domain is called the cooperatively rearranging region (CRR) [5]. In connection with the CRR, recent molecular dynamics simulations have revealed the existence of significant large-scale heterogeneity in particle displacements, so-called dynamical heterogeneity in supercooled liquids [6, 7, 8, 9]. As the temperature decreases toward , the dynamical heterogeneity grows. Experimental studies using multi-dimensional NMR [10], dielectric hole burning [11] and photobleaching [12] have produced evidence of dynamical heterogeneity. These topics concerning heterogeneity are closely related to the length scale of dynamics near glass transitions.
Glass transitions in finite systems confined to nanopores [13, 14, 15] and thin films [16, 17, 18, 19, 20, 21, 22, 23] have recently attracted much attention, because such systems can be regarded as model systems for studying the length scale of glass transitions. In such systems, deviation from bulk properties is expected to appear if the system size is comparable to the characteristic length scale. In particular, and the thermal expansion coefficient of thin films have been measured using several experimental techniques, including ellipsometry [16, 17], positron annihilation lifetime spectroscopy (PALS) [18], Brillouin light scattering [19, 20], and X-ray reflectivity [21]. For the first time, Keddie et al. investigated and the thermal expansion coefficient of thin polymer films supported on substrate. For polystyrene films on hydrogen-passivated Si, was found to decrease with decreasing film thickness for 40nm [16]. The value of below was found to increase with decreasing approaching the value characterizing liquid states. It was suggested that this decrease in is caused by the presence of a liquid-like layer at the polymer-air interface in this case; in the case of freely standing polystyrene films, decreases much more rapidly with decreasing film thickness [19]. These results suggest that the interaction between polymers and the substrate competes with surface effects. This competition leads to a more gradual decrease of in the former case. For a strong attractive interaction between polymers and the substrate, an increase in with decreasing was observed [17].
Positron annihilation lifetime measurements reveal that the observed values of supported PS films are similar to those obtained by Keddie et al. However, the thermal expansion coefficient obtained by PALS is independent of below , while it decreases with decreasing thickness above . It was proposed that there is a dead layer near the interface between polymers and the substrate in addition to a liquid-like layer at the polymer-air interface. In the case of thin polymer films supported on substrate, the glass transition temperature and thermal properties strongly depend on the competetion between interfacial and surface effects. There are still controversial experimental results for such systems.
The dynamics related to the glass transition in thin films have been investigated using several methods [24, 25, 26]. Second harmonic generation reveals that the distribution of relaxation times broadens with decreasing film thickness, while the average relaxation time of the -process remains constant for supported films of a random copolymer [24]. Ultrasonic measurements [25] have shown that the temperature at which the ultrasonic absorption exhibits a maximum for a given frequency has a dependence similar to that of obtained by ellipsometric measurements for thin polystyrene films supported on substrate. In the case of freely standing films of polystyrne, photon correlation spectroscopy [25] studies indicate that the relaxation behavior of the -process in thin films is similar to that of bulk samples of polystyrene, except for the reduction of the -relaxtion time. Atomic force microscopy studies [26] have revealed the existence of a mobile layer near the free surface of films of polystyrene. Because there are only a few experimental observations on the dynamics of thin polymer films, it is not yet clear whether properties of the -process change together with as the film thickness decreases or whether the obtained results depend on the methods used for measurements or on the details of the individual samples.
Dielectric measurement is one of the most powerful expermental tools to investigate the dynamics of the -process in amorphous materials. Recently we applied this method to the determination of the glass transition temperature through measurements of the thermal expansion coefficient [27]. Bauer et al. also used this method and further extended it to thermal expansion spectroscopy [28, 29]. By virture of dielectric measurements, it is possible to simultaneously measure the glass transition temperatures and determine the relaxation behavior of the -process of a single sample even for thin films.
In a previous paper [27], we reported that for thin polystyrene films supported on glass substrate can be determined from the temperature change of the electric capacitance during heating and cooling processes and that the dynamics of the -process can be determined from the dielectric loss of the films. We were able to obtain the distinct thickness dependences of and in which the dielectric loss exhibits a peak value for a fixed frequency due to the -process. In this paper, the results obtained through dielectric measurements are described in detail, and the dynamics of the -process are investigated by measurements of the frequecncy dispersion of the dielectirc loss for the purpose of clarifying the relation involving the thickness dependence of , the thermal expasion coefficients, and the dynamics of the -process. Based on the results of simultaneous measurements, we discuss the relationship between and the dynamics of the -process of thin polymer films. A possible explanation of our experimental results for and the dynamics of the -process is given in terms of a three-layer model. This paper consists of five sections. In Sec.II, experimental details and principles regarding our determination of and the thermal expansion coefficient using electric capacitance measurements are given. The experimental results for the thermal expansion coefficient and obtained from our measurements are given in Sec.III. A three-layer model, which can account for the observed thickness dependences of and , is also introduced there. In Sec.IV the dynamics of the -process of thin films are investigated in reference to the peak profile in the dielectirc loss due to the -process in the frequency domain. In Sec.V overall discussion and a summary of this paper are given.
II Experimental details
A Sample preparation and measurement procedures
Four different atactic polystyrenes (a-PS) were used. These were purchased from Scientific Polymer Products, Inc. (=2.8105), the Aldrich Co., Ltd. (= 1.8106, =1.03), and Polymer Source, Inc. (= 3.6104, =1.06 and = 3.6103, =1.06). Thin films of a-PS with various thicknesses from 6 nm to 489 nm were prepared on an Al-deposited slide glass using a spin-coat method from a toluene solution of a-PS. The thickness was controlled by changing the concentration of the solution. After annealing at 70∘C in the vacuum system for several days to remove solvents, Al was vacuum-deposited again to serve as an upper electrode. Heating cycles in which the temperature was changed between room temperature and 110∘C () were applied prior to the dielectric measurements to relax the as-spun films and obtain reproducible results. ‘Bulk’ films of a-PS (each with 100m) were made by oil-pressing samples melted at about 200∘C for a few minutes, and gold was vacuum-deposited onto both sides of the films to serve as electrodes. Dielectric measurements were done using an LCR meter (HP4284A) in the frequency range from 20 Hz to 1MHz during heating (cooling) processes in which the temperature was changed at a rate of 2K/min. For dielectric measurements of very thin films, the resistance of the electrodes cannot be neglected. This leads to an extra loss peak on the high frequency side, which results from the fact that system is equivalent to a series circuit of a capacitor and resistor, where the capacitance is that of the sample and the resistance is that of the electrodes [30]. The peak shape in the frequency domain can be fitted well by a simple Debye-type equation. Data obtained in the frequency domain, therefore, can be accurately corrected by subtracting the ‘C-R peak’ and assuming the validity of the Debeye equation. Data corrected in this manner were used for further analysis in this paper.
B Relation involving the electric capacitance, thickness and thermal expansion coefficients
In this section, we give the relation between the temperature change of the electric capacitance and thermal expansion coefficient. Similar discussion was also given by Bauer et al. [28]. In our measurements, film thickness was evaluated from the capacitance at room temperature of as-prepared films by using the formula for the capacitance of a flat-plate condenser, =, where is the permittivity of a-PS, is the permittivity of the vacuum, is the area of the electrode (=8.0mm2), and is the thickness of the films. In general, the geometrical capacitance is given by
| (1) |
and the permittivity is expressed by
| (2) |
where is the permittivity in the high-frequency limit, is the linear thermal expansion coefficient parallel to the film surface, is the linear thermal expansion coefficient normal to the film surface, , and is a standard temperature. The second term on the right-hand side of Eq.(2) is related to the frequency dispersion of the dielectric loss due to the -process, the -process, and so on.
If we here assume that the films are constrained along the substrate surface, and are given by
| (3) |
where is Poisson’s ratio and is the bulk linear coefficient of thermal expansion [21]. It should be noted that this case corresponds to that of ‘constant area conditions’ in Ref. [28].
In the temperature range where the effect of the dielectric dispersion, , the second term in the expression for , can be neglected, we obtain
| (4) |
where
| (5) | |||||
| (6) | |||||
| (7) |
Here , is the number density of the j-th atom at , and is the polarizability of the j-th atom. The Clausius-Mossotti relation, , where , has been used.
In the case of a-PS, the dielectric constant of bulk samples is 2.8 at room temperature [31]. If we assume that =2.8, then and is nearly equal to 1. Using Eqs.(1), (3) and (4), we obtain the temperature coefficient of the capacitance as follows:
| (8) | |||||
| (9) | |||||
| (10) |
We thus see that the temperature coefficient of is proportional to . It is therefore expected that the temperature coefficient changes at . In the literature [32] we find =0.325 and =0.57/K for , and =0.5 and =1.7/K for . Hence, for bulk samples of a-PS, it can be expected that
| (13) |
III Glass transition temperature of thin films
A Glass transition temperature and thermal expansion coefficients
Figure 1 displays the temperature dependence of the capacitance, normalized
with respect to the value at 303K during the heating processes.
In Fig.1(a) we can see that the values at thickness 91 nm
for different frequencies fall along a single line
and decrease with increasing temperature for the temperature range
from room temperature to approximately 370K.
At higher temperature the normalized capacitance decreases with increasing
temperature more steeply than at lower
temperature. In this range, the values for different frequencies can no longer be
fitted by a single line. Here, they are dispersed due to the appearance of the
-process. For the temperature range shown in the
figure, however, it is apparent that the effect of the dispersion is
quite weak above 10kHz. Therefore, for such frequencies the temperature
at which the slope of changes discontinuously can be determined
unambiguously as the crossover temperature between the
line characterizing the lower temperature side and that
characterizing the higher
temperature side. This crossover temperature
can be regarded as , because the thermal expansion
coefficient changes
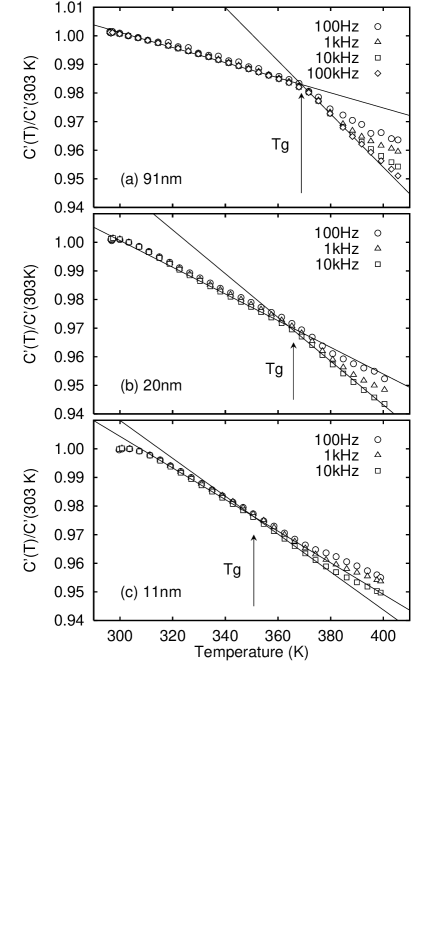 FIG. 1.: Temperature dependence of the capacitance normalized with
respect to the
values at 303K during the heating process for various frequencies
from 100Hz to 10kHz
and three different thicknesses:
((a) =nm and
=1.8106; (b) =nm and =
2.8105; (c) =nm and =1.8106).
The solid lines were obtained by fitting the data for 10kHz to a linear
function below and above . The arrows
indicate the values of .
through the crossover temperature, as can be
expected from the discussion in Sec.II.
As decreases, also decreases, as shown in Figs.1(b) and (c).
FIG. 1.: Temperature dependence of the capacitance normalized with
respect to the
values at 303K during the heating process for various frequencies
from 100Hz to 10kHz
and three different thicknesses:
((a) =nm and
=1.8106; (b) =nm and =
2.8105; (c) =nm and =1.8106).
The solid lines were obtained by fitting the data for 10kHz to a linear
function below and above . The arrows
indicate the values of .
through the crossover temperature, as can be
expected from the discussion in Sec.II.
As decreases, also decreases, as shown in Figs.1(b) and (c).
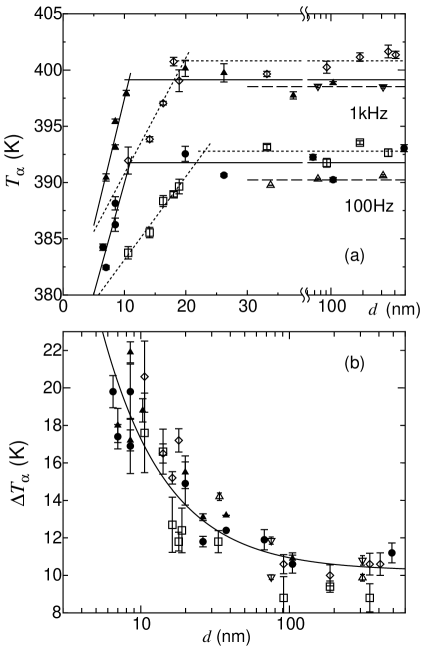
Figure 2 displays the dependence of for a-PS films with four different molecular weights. In each case, the values of for the various values of were determined as the crossover temperatures at which the temperature coefficient of the capacitance at 10 kHz changes during heating process. For thick films, the values of are almost equal to those for bulk PS. When the films are thinner than about 100 nm, however, a decrease in is observed. The value of for films of 6 nm thickness is lower by about 30K than that of films of 489 nm thickness for a-PS films with = 2.8105. The dependence of on can be expressed as
| (14) |
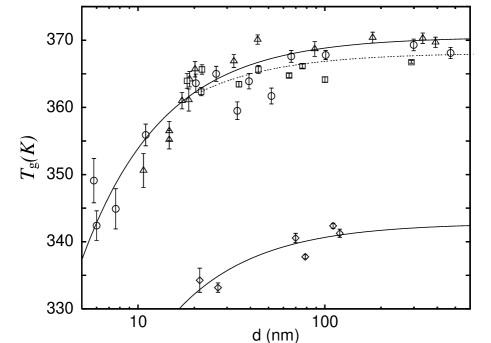
| (nm) | (K) | |
|---|---|---|
| 1.8106, 2.8105 | 0.450.06 | 370.50.9 |
| 3.6104 | 0.330.05 | 367.80.5 |
| 3.6103 | 0.620.12 | 342.81.1 |
where is the measured glass transition temperature for a film of thickness . The values of the parameters resulting in the best fit are listed in Table I.
The asymptotic value has a distinct molecular weight dependence. For bulk samples of a-PS, the variation in with molecular weight is described well by the empirical equation
| (15) |
where is the degree of polymerization, =373 K and C=1.1103 [34]. Using Eq.(15), we obtain the values of as follows: = 373 K for =1.8106 and 2.8105, 370 K for =3.6104, and 341 K for =3.6103. Therefore, it is found that the -dependence of for the bulk samples can be reproduced quite well by the present measurements.
As shown in Table I, the length scale related to the thickness dependence of ranges from 0.3-0.6nm. Taking into account the scatter in , however, there is no distinct molecular weight dependence of . This length scale is of the same order as that of the statistical segment of polystyrene (0.68nm) [33]. These experimental results for and suggest that the thickness dependence of is almost independent of the molecular weight of a-PS after rescaling with respect to of bulk samples. This seems to be consistent with the fact that the length scale is not related to chain lengths but rather to segment lengths.
If our data are fitted by the function proposed by Keddie et al., , the observed data for =1.8106 and 2.8105 can also be fitted to this equation, and the parameter values resulting in the best fit are as follows: nm and . The revised value of obtained by Keddie and Jones is [35]. This suggests that Keddie’s equation can be replaced by Eq.(14) (1). The values obtained in our measurements also agree well with those obtained by Forrest et al. [20]. Thus, it can be concluded that of thin films has been accurately determined by measurements of the electric capacitance. With the present method it has been confirmed that the apparent obtained in our measurements decreases with decreasing film thickness.
Since no general theory for the effect on the glass transition of finite size has yet been presented, Eq.(14) is just an experimental findings at the present stage. As discussed later, in the context of the three-layer model we regard the glass transition temperature described by Eq.(14) as that associated with the -process (in this case, segmental motions of polymer chains) in the bulk-like layer between the dead layer and the liquid-like one. The observed decrease in may be attributed to the distribution of the relaxation times of the -process, which comes from the existence of boundary between liquid-like layer and bulk-like layer, and also between bulk-like layer and dead layer.
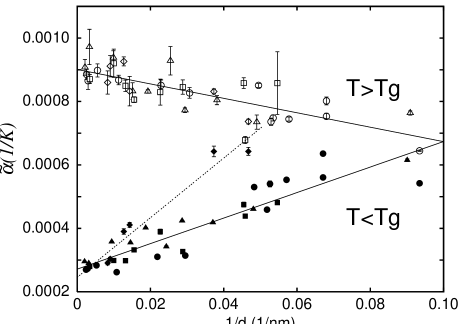
Here, it should be noted that the temperature coefficient of electric capacitance also changes with film thickness, as shown in Fig.1. To clarify the dependence of , Fig.3 displays as a function of the inverse of the film thickness for thin films. It is found that increases with decreasing thickness below , while it decreases with decreasing film thickness above . In both cases, the thickness dependence of can be expressed as a linear function of the inverse of film thickness. This observed dependence of seems to be independent of the molecular weight within experimental accuracy, except for the case with =3.6103 below . The values of for bulk samples can be obtained by taking to zero as follows: =9.010-4 K-1 for and 2.810-4 K-1 for . These values agree well with those predicted by Eq.(13) in Sec.II, and hence the temperature coefficient of the electric capacitance observed in the present measurements can be regarded as the linear thermal expansion coefficient normal to the substrate multiplied by a factor of 2, as shown in Eq.(8). This dependence of and can be attributed to the existence of some layers with different chain mobilities within thin polymer films supported on substrate, as discussed in the next section.
B Three-layer model
In order to explain the observed thickness dependence of , we introduce a three-layer model, in which it is assumed that a thin polymer film on substrate consists of three layers with different molecular mobilities [18]. Near the interface between the glass substrate and polymers there is a dead layer which has almost no mobility. On the other hand, near the free surface there is a liquid-like layer which has higher mobility. Here, we assume that the thicknesses of the two layers are (dead layer) and (liquid-like layer). Between these two layers there is a bulk-like layer which has the same mobility as that of the bulk samples. In this model, below the apparent the observed linear thermal expansion coefficient normal to the surface of the substrate is given by
| (16) |
and above by
| (17) |
where () is the linear thermal expansion coefficient of the bulk glassy (liquid) state. Therefore, this simplified model can reproduce the observed thickness dependence of (=2) both below and above . By fitting the observed results given in Fig.3 to Eqs. (16) and (17), the thicknesses of dead and liquid-like layers are obtained: =nm and =nm. Keddie et al. estimated the thickness of a liquid-like layer near the free surface to be (8.00.8)nm. DeMaggio et al. obtained the thickness of the dead layer between polymer films and substrate to be (5.00.5)nm and also proposed the existence of a mobile surface layer with thickness 2 nm. The values of and observed in the present dielectric measurements are found to be consistent with those obtained by other experimental techniques: PALS and ellipsometry. Therefore, we conclude that the three layer model can successfully be applied in our case.
The values of and for the lowest molecular weight sample (=3.6103) are =(3.71.0)nm and =(15.20.9)nm. These values are clearly different from those for other molecular weights. This difference may be due to the entanglement effect, because the critical molecular weight at the entanglement limit is 1.3104 for a-PS [36]. In the present measurements no obvious molecular weight dependence was observed within experimental accuracy except for =3.6103. However, it is plausible that the values of and are functions of the molecular weight. More precise measurements will be required to detect such molecular weight dependence.
Thin polymer films with both substrate and upper electrodes of Al for
dielectric measurements were used in the present measurements. Due to
the presence of these electrodes, for our thin films there
was no real free surface existing in the air-polymer interface.
The samples discussed presently were capped supported films, according to the
terminology given in Ref.[20]. However, the values of
observed in the present measurements
agree with those obtained by ellipsometry for uncapped films.
It has also been reported that there is no obvious differences between
the results obtained for uncapped and capped supported
films [20].
These experimental results support the conclusion that there is no appreciable
difference in for capped and uncapped supported thin
films; i.e.,
the upper electrode of our samples can be assumed to have no effect on the
thermal properties of the polymer films, in particular the thermal
expansivity along the direction normal to the substrate.
Recent DSC measurements have revealed the existence of a surface mobile layer
of PS spheres dispersed in Al2O3 powders [37].
According to the discussion given by Mayes [38], the glass transition
temperature of a (surface) layer can be depressed only if the end concentration
of the layer is higher than that of bulk samples. The existence of
a true
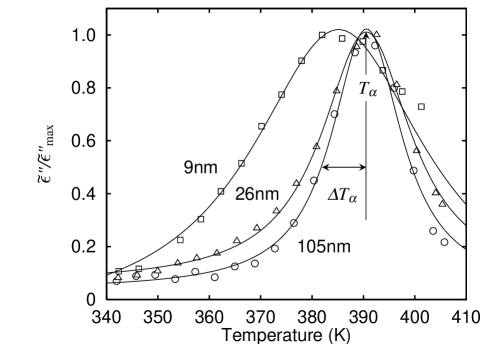 FIG. 4.: Reduced dielectric loss as a function of temperature
for various film thicknesses (=2.8105 and =100Hz).
The symbol corresponds to nm,
to nm, and to nm. The curves were
obtained by fitting the data to
the equation .
free surface is not a necessary condition for the decrease of
and the existence of a liquid-like layer.
FIG. 4.: Reduced dielectric loss as a function of temperature
for various film thicknesses (=2.8105 and =100Hz).
The symbol corresponds to nm,
to nm, and to nm. The curves were
obtained by fitting the data to
the equation .
free surface is not a necessary condition for the decrease of
and the existence of a liquid-like layer.
Recent measurements of the mass density of a-PS thin films supported on Si using neutron reflectivity show that the average mass density within films is near the bulk value regardless of film thickness [39]. Sound velocities in thin freely standing PS films measured by Brillouin light scattering are reported to be the same for all films with various film thicknesses. This also suggests that the average mass density of thin films is the same as that of bulk samples [40]. In the presently considered layer model it is assumed that there are thin liquid-like and dead layers in addition to the layer with bulk properties. Because the liquid-like layer has a lower mass density and the dead layer has a higher mass density than the bulk layer, it is not unreasonable to assume that the average mass density of these thin films is the same as that of bulk samples. In the case of freely standing films, because there is no dead layer, the average mass density is expected to become lower for very thin films than that of bulk sample. However, the observed value of the average mass density does not change with film thickness. The simple layer model may no longer be valid for freely standing films, and it may be the case that another physical factor must be taken into account.
It should also be noted here that picosecond acoustic techniques reveal an increase in the longitudinal sound velocity for thin films of poly(methyl methacrylate) and PS [41, 42]. This suggests a change in the average mass density for thin films from that of bulk samples. This result disagrees with that obtained in Ref.[39, 40].
IV Dynamics of the -process of thin films
In this section, results concerning dielectric loss during the heating process are given to allow for discussion how the dynamics of the -process change with decreasing as a result of decreasing thickness. First, the temperature dependence of the dielectric loss with a fixed frequency is investigated to directly compare the thickness dependence of with that of the dynamics of the -process. Second, the results for the dielectric loss in the frequency domain under an isothermal condition are given to confirm the results obtained with fixed frequency and to allow for discussion of the relaxation behavior due to the -process in thin polymer films.
| (Hz) | (K) | (nm) | (102nm) | |
|---|---|---|---|---|
| 2.8105 | 100 | 391.80.5 | 10.91.1 | 2.00.7 |
| 1000 | 398.90.4 | 10.30.7 | 1.60.5 | |
| 1.8106 | 100 | 392.80.3 | 23.10.9 | 5.30.6 |
| 1000 | 400.80.4 | 19.70.8 | 3.90.5 |
A Dielectric loss with fixed frequency
Figure 4 shows the reduced dielectric loss as a function of temperature at 100Hz in a-PS samples of thickness 9nm, 26nm and 105nm with =2.8105. Here, the reduced dielectric loss is defined by , where is the imaginary part of the complex capacitance, is a standard temperature (in this case, is room temperature), and is the peak value of due to the -process. Above the dielectric loss for a given frequency displays an anomalous increase with temperature due to the -process, and it possesses a maximum at the temperature . The value of and the width of the -peak, , also depend on , as shown in Fig.4. Here, is defined as the temperature difference between and the lower temperature at which is half its peak value. As shown in Fig.5(b), the width begins to increase at about 100 nm and continues to increase monotonically with decreasing . The dependence of can be expressed as
| (18) |
where =6.90.8 nm and =10.30.4 K. Comparing the -dependence of with that of (Fig.2), we find that the decrease of is directly correlated with the broadening of the -peak as = , where =, =, and is a constant (4.810-26.510-2). In other words, it can be concluded that the broadening of the distribution of relaxation times for the -process is closely correlated to the decrease of .
Contrastingly, Fig.5(a) shows that remains almost constant as is decreased, down to the critical thickness , at which point it begins to decrease linearly with decreasing . Therefore, is given as follows:
| (21) |
where and are constants. The functional form of with respect to is independent of , because Eq.(21) can well reproduce experimental values of for two different molecular weights =2.8105 and 1.8106. The parameters and show a distinct molecular weight dependence as shown in Table II. The and dependences of are quite different from those of and found in the present and previous measurements on supported PS films [16, 20]. They are similar to those of for freely standing films of a-PS [19].
The values of listed in Table II are =11 nm for =2.8105 and =2023 nm for =1.8106. These values seem to be related to the radius of gyration of the bulk polymer coil (=0.028 (nm) [18]): =15 nm for =2.8105 and 38 nm for =1.8106. Furthermore, if we assume that and can be scaled by the functional form of and , where is the molecular weight of polymers, the values of and can be estimated as follows: =0.380.10 and = 0.51 0.08. These values are nearly equal or similar to the exponent of radius of gyration for Gaussian chains (). In the molten state, polymer chains can be regarded as Gaussian chains. This result suggests that the length scale such as the radius of gyration of the bulk polymer may control the drastic change of near and below . In other words, the deformation of random coils of polymer chains confined in thin films may cause the observed decrease in with decreasing film thickness. As discussed later, one of the possible origin of this deformation is the competition between the liquid-like layer and the dead layer. The investigation of dependence of for various samples will reveal the detailed mechanism of drastic decrease in with decreasing .
Here, it should be noted that the length scale included in the expression of as a function of is much larger than in : . This can be explained in the following way. It is assumed that the shape of the loss peak due to the -process in the plot of vs. can be expressed by the same function of and for any film thickness and that can be regarded as the temperature at which dielectric loss begins to increase due to the -process. From this assumption, the following relation can be obtained:
| (22) |
where is a constant. Taking into account that for , , and substituting Eqs.(14) and (18) into Eq.(22), we obtain the relations and . Hence, the value of is expressed by
| (23) |
Using Eq.(23) with the observed values of and we obtain for =100Hz and 12 for =1kHz. Although the errors in prevent us from obtaining the frequency dependence of , the values of evaluated using the above assumption agree well with those found in the present measurements.
Recently, Forrest et al. obtained -relaxation
data with a characteristic time scale
210-4s using a quartz crystal
microbalance technique applied to supported PS films covered with SiC
particles [25].
It was reported that the small dissipation peak , which
corresponds to in this paper, exhibits the same dependence
as when the values of are shifted by 20K.
The dependence of found from their measurements
seems to be different from that found from the present measurements.
The values of used for comparison with
were observed by ellipsometry for PS films supported on a
hydrogen-passivated Si substrate with a free surface [35].
Hence, the comparison between and in
Ref.[25] was carried out for samples with different molecular weight
and of different geometries (with and without a free surface) by using
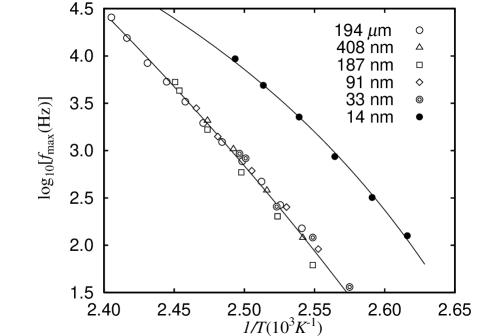 FIG. 7.: Peak frequency of dielectric loss due to the -process
as a function of the inverse of temperature for thin films
of a-PS with various film thicknesses (=1.8106).
Solid curves were obtained by fitting the data to the VFT equation,
, where , , and are
constants.
different experimental techniques, while a direct comparison was
carried out in our study by using simultaneous
measurements of and for the same sample.
The results obtained in Ref.[25] may have been affected by a small
difference in experimental conditions for the two different measurements of
and . Furthermore, plotted
in the inset of Fig.2 of Ref.[25] can also be fitted by
the equation proposed for in this paper
(See Eq.(21)), and the critical thickness
is found to be 35 nm.
FIG. 7.: Peak frequency of dielectric loss due to the -process
as a function of the inverse of temperature for thin films
of a-PS with various film thicknesses (=1.8106).
Solid curves were obtained by fitting the data to the VFT equation,
, where , , and are
constants.
different experimental techniques, while a direct comparison was
carried out in our study by using simultaneous
measurements of and for the same sample.
The results obtained in Ref.[25] may have been affected by a small
difference in experimental conditions for the two different measurements of
and . Furthermore, plotted
in the inset of Fig.2 of Ref.[25] can also be fitted by
the equation proposed for in this paper
(See Eq.(21)), and the critical thickness
is found to be 35 nm.
B Dielectric relaxation behavior of thin films
Here, we give the results for the imaginary part of the complex capacitance
(dielectric loss) as a function of the frequency to facilitate
discussion of the
dynamics of thin films of a-PS with various film thicknesses between 14 nm
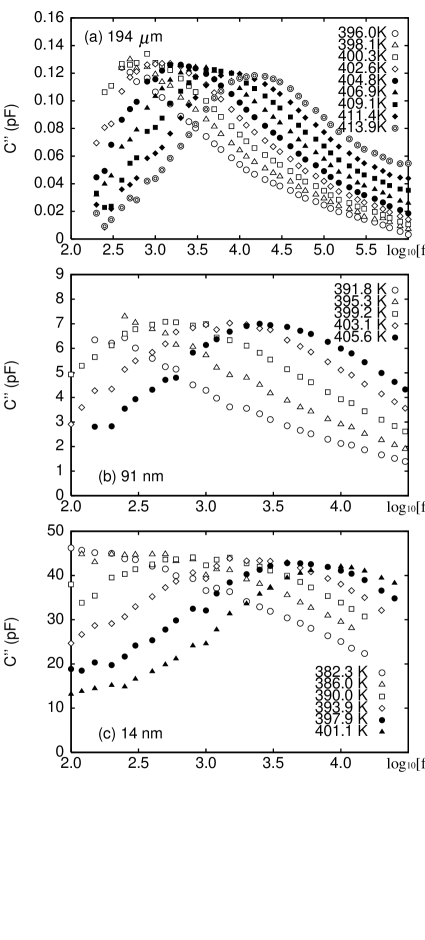
and 194 m. Figure 6 displays the dielectric loss vs. frequency at various
temperatures above for a-PS (=1.8106)
with film thicknesses of (a) 194 m (bulk sample), (b) 91 nm
and (c) 14 nm. The peak
in Fig.6 corresponds to that due to the -process.
It it found that the relaxation behavior of the -process changes
with temperature and thickness. The
peak frequency shifts to the higher frequency side as the temperature
increases. In Fig.7 the peak frequency , which corresponds to
the inverse of the relaxation time of the -process,
is plotted as a function of the inverse temperature.
It is found that the values of for the films with
thickness from 33 nm to
194 m fall on the same curve, which can be described by the
Vogel-Fulcher-Tammann (VFT) equation.
Here it should be noted that the values of
for the films with thickness of 33 nm and 91 nm are
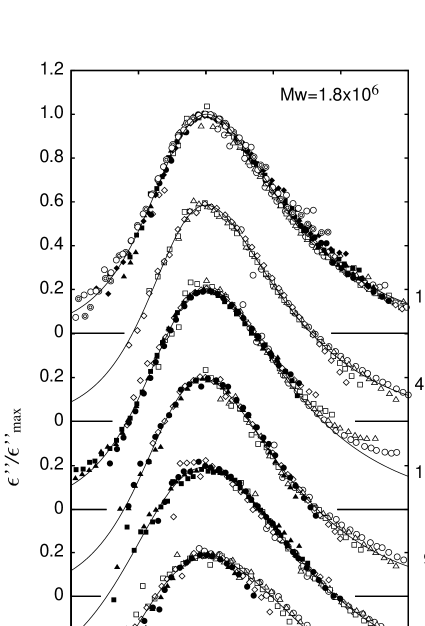 FIG. 8.: Dependence of the normalized dielectric loss on the logarithm
of the normalized frequency (=1.8106). The two
axes are normalized with respect to the peak position due to
the -process, corresponding to and .
The numbers given in the right margin are the film thicknesses.
The solid curves for each film with various thicknesses were obtained
by fitting the data to the HN equation. The parameter values resulting
in the best fit are given
in Table II. For =194 m, 91 nm and 14 nm, the symbols
are the same as in Fig.6. For =408 nm, the symbol corresponds
to 393.5K, to 397.5K, to 401.3K, and to
404.3K. For =187 nm, the symbol corresponds to 388.5K,
to 392.4K, to 396.3K, to 400.4K,
to 404.3K, to 407.6K, and
to 408.1K. For =33 nm, the symbol corresponds to 380.5K,
to 384.5K, to 388.4K, to 392.4K,
to 396.4K, to 399.9K, and
to 400.6K.
smaller
than those of thicker films, although
remains constant. As the thickness decreases further,
down to 14nm, becomes much shorter than that for
thicker films. It follows from this result that the relaxation time
of the -process
remains constant down to a critical thickness, below which
it begins to decrease.
This result
FIG. 8.: Dependence of the normalized dielectric loss on the logarithm
of the normalized frequency (=1.8106). The two
axes are normalized with respect to the peak position due to
the -process, corresponding to and .
The numbers given in the right margin are the film thicknesses.
The solid curves for each film with various thicknesses were obtained
by fitting the data to the HN equation. The parameter values resulting
in the best fit are given
in Table II. For =194 m, 91 nm and 14 nm, the symbols
are the same as in Fig.6. For =408 nm, the symbol corresponds
to 393.5K, to 397.5K, to 401.3K, and to
404.3K. For =187 nm, the symbol corresponds to 388.5K,
to 392.4K, to 396.3K, to 400.4K,
to 404.3K, to 407.6K, and
to 408.1K. For =33 nm, the symbol corresponds to 380.5K,
to 384.5K, to 388.4K, to 392.4K,
to 396.4K, to 399.9K, and
to 400.6K.
smaller
than those of thicker films, although
remains constant. As the thickness decreases further,
down to 14nm, becomes much shorter than that for
thicker films. It follows from this result that the relaxation time
of the -process
remains constant down to a critical thickness, below which
it begins to decrease.
This result
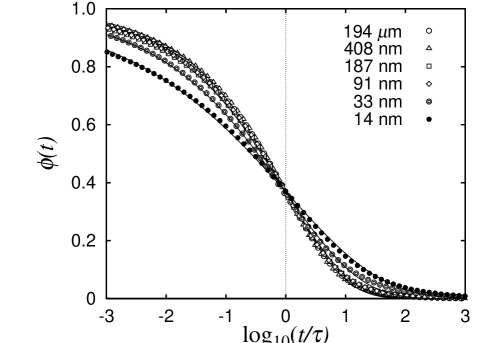 FIG. 9.: The relaxation function as a function of the logarithm
of the reduced time for a-PS thin films
with various thicknesses.
The relaxation functions plotted by the 6 different symbols were calculated
using Eq.(24) and Eq.(25) with
the best-fit parameters
and listed in Table II for each thickness. The solid
curves were obtained by fitting the relaxation functions to the KWW
equation.
TABLE III.: The values of ,
and resulting in the best fit for
thin films of a-PS with =1.8106.
(nm)
194103
0.220.01
0.460.01
0.4190.012
408
0.220.01
0.480.02
0.4350.017
187
0.250.01
0.460.03
0.3990.021
91
0.250.01
0.470.01
0.4060.014
33
0.380.01
0.510.02
0.3440.017
14
0.400.02
0.370.03
0.2710.019
is consistent with that extracted from the
experimental observations of dielectric loss with fixed frequency
discussed in Sec.IV.A.
FIG. 9.: The relaxation function as a function of the logarithm
of the reduced time for a-PS thin films
with various thicknesses.
The relaxation functions plotted by the 6 different symbols were calculated
using Eq.(24) and Eq.(25) with
the best-fit parameters
and listed in Table II for each thickness. The solid
curves were obtained by fitting the relaxation functions to the KWW
equation.
TABLE III.: The values of ,
and resulting in the best fit for
thin films of a-PS with =1.8106.
(nm)
194103
0.220.01
0.460.01
0.4190.012
408
0.220.01
0.480.02
0.4350.017
187
0.250.01
0.460.03
0.3990.021
91
0.250.01
0.470.01
0.4060.014
33
0.380.01
0.510.02
0.3440.017
14
0.400.02
0.370.03
0.2710.019
is consistent with that extracted from the
experimental observations of dielectric loss with fixed frequency
discussed in Sec.IV.A.
In order to discuss the relaxation behavior of the -process, the profiles in Fig.6 are replotted by scaling them with respect to peak positions and peak heights. Figure 8 shows that profiles of dielectric loss vs. frequency can be reduced in this way to a single master curve over the temperature range above described in the figure captions. It it clearly found that peak profiles become broader as the film thickness decreases. The master curve for each film with different thickness can be fitted by using the Havriliak-Negami equation [43],
| (24) |
where is the dielectric strength, is angular
frequency (= ), is the apparent relaxation time,
and and are shape
parameters. The values of and
resulting in the best fit
are given in Table III. The
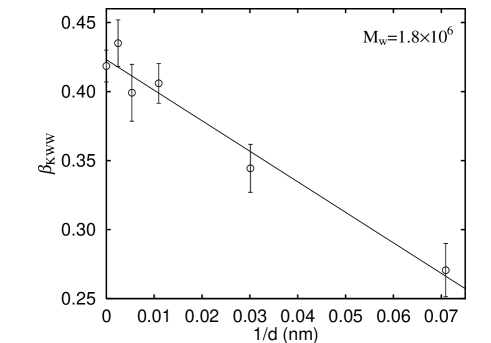 FIG. 10.: The KWW exponent as a function of the
inverse of the thickness (=1.8106).
The values were obtained by fitting
the relaxation function to the KWW equation.
The solid line was plotted using Eq.(27).
solid curves given in Fig.8 are calculated
using the HN equation.
FIG. 10.: The KWW exponent as a function of the
inverse of the thickness (=1.8106).
The values were obtained by fitting
the relaxation function to the KWW equation.
The solid line was plotted using Eq.(27).
solid curves given in Fig.8 are calculated
using the HN equation.
Here, the data in the frequency domain are converted into those in time domain. Using the equation
| (25) |
the relaxation function can be calculated via the HN equation with the best-fit parameters for thin films of various thicknesses, as shown in Fig.9. The shape of the relaxation function changes with film thickness. As seen in Fig.9, the relaxation function thus obtained can be fitted quite well by the Kahlrausch-Williams-Watts (KWW) equation
| (26) |
for any thickness. It is also found that the relaxation behavior becomes slower as the film thickness decreases.
Figure 10 displays the exponent as a function of the inverse of the film thickness. It it found that decreases from 0.42 to 0.27 as the thickness changes from 194 m to 14 nm. The functional form of with respect to the inverse of the thickness is found to be linear:
| (27) |
where =0.4230.006 and
=(5.20.4) nm.
The value of is a measure of the distribution
of relaxation times of the -process; ,
the distribution becomes broader as becomes smaller.
Therefore, as the thickness decreases, the distribution of the relaxation
times becomes broader according to Eq.(27).
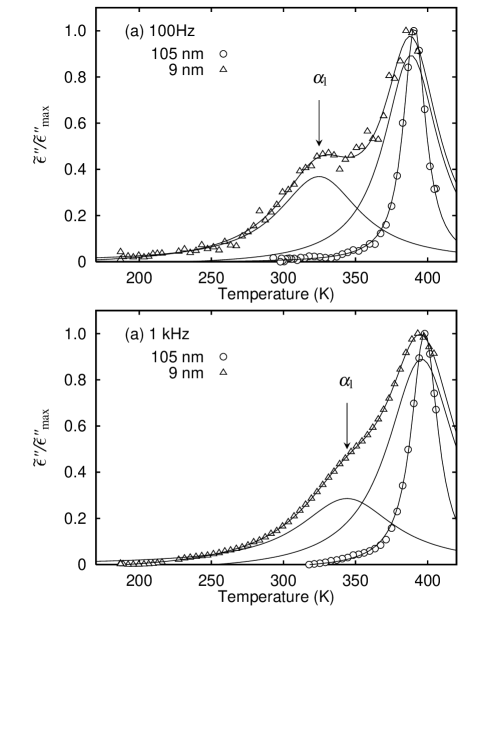 FIG. 11.: Reduced dielectric loss as a function of temperature during
the cooling process for a-PS with film thicknesses of 105 nm and 9 nm
(=2.8105): (a) =100Hz and (b) =1kHz.
The solid curves for the -process were obtained by
fitting the data to the equation .
The characteristic length scale obtained in this analysis of
is consistent with the value obtained for
.
Furthermore, the relative change of
measured with respect to that of the bulk sample,
=,
is directly related to the relative change of as follows:
FIG. 11.: Reduced dielectric loss as a function of temperature during
the cooling process for a-PS with film thicknesses of 105 nm and 9 nm
(=2.8105): (a) =100Hz and (b) =1kHz.
The solid curves for the -process were obtained by
fitting the data to the equation .
The characteristic length scale obtained in this analysis of
is consistent with the value obtained for
.
Furthermore, the relative change of
measured with respect to that of the bulk sample,
=,
is directly related to the relative change of as follows:
| (28) |
The values of for freely standing films of a-PS have been evaluated using photon correlation spectroscopy and found to be indistinguishable from those of bulk PS [25]. On the other hand, a decrease in has been observed for a copolymer thin film supported on quartz [24], as found in the present measurements on PS supported on a glass substrate. We thus conclude that there is a large difference in the dynamics of freely standing films and supported thin films. In the case of thin films supported on substrate, it is easily understood that the existence of the substrate may cause a broadening of the distribution of -relaxation times, because the dynamics of polymer chains should depend on the distance from the substrate near the boundary.
Although only the results for the dielectric loss in thin films of a-PS with =1.8106 are given in IV.B, the results obtained for thin films with =2.8105 are consistent with these.
V Discussion and Summary
In the case of thin polymer films supported on substrate, not only the surface effects but also the interactions between the substrate and films strongly affect the dynamics and the glass transition of the thin films. We introduced a three-layer model in order to explain such surface and interfacial effects in Sec.III.B, following Ref.[18]. In this model it is assumed that within a thin film there are a liquid-like layer and a dead layer in addition to a bulk-like layer.
According to this model, two different -processes should exist corresponding to the liquid-like layer and bulk-like layer. (If the -process exists in the dead layer, it should exist only far above of the bulk sample, , beyond the experimentally accessible temperature range.) We now are performing dielectric measurements to investigate the dynamical properties of a-PS thin films over a wider temperature range. Although the measurements are still in progress, direct evidence for the existence of different processes in thin films of a-PS is displayed in Fig.11. Figure 11 shows the normalized dielectric loss as a function of temperature for a-PS thin films with thicknesses of 105 nm and 9 nm and =2.8105. In this case, the standard temperature is set to 180 K. For films with =105 nm and 9 nm there the -process exists around 390 K for =100Hz, as discussed in Sec.IV, while for films with =9 nm there another -process exists at lower temperature. We refer to the latter as the -process (see arrows in the figure). This peak in the dielectric loss due to the -process shifts to the higher temperature side as the frequency of the applied electric field changes from 100Hz to 1kHz. This suggests that the dynamical behavior of the peak is similar to that of the -process. Since within the model the thickness of the liquid-like layer is assumed to be constant (independent of the thickness ) the contribution of the liquid-like layer should become more appreciable as the thickness decreases. Therefore, it is reasonable to attribute the loss peak for the -process to the liquid-like layer. In other words, the existence of the -process can be regarded as experimental evidence of the existence of a liquid-like layer within a thin film.
Since the -process and the -process can be attributed to the segmental motion of polymer chains in the bulk-like layer and liquid-like layer (surface layer), respectively, we can expect that the characteristic time of the -process is smaller than that of the -process at a given temperature, because polymer chains involved in the -process has a higher mobility than those in the -process of bulk-like layer. At higher temperatures the segmental motions of the surface layer is expected to become less different from those of the bulk-like layer. Therefore, should be smaller than at a given frequency and the difference between and should become smaller with increasing frequency. Here, is the temperature at which the dielectric loss possesses a maximum due to the -process at a given frequency. Because the chain end concentration in the surface layer is higher than that in the bulk-like layer, can be expected to have a stronger molecular-weight dependence than does.
If there are liquid-like and dead layers in addition to a bulk-like layer, it is plausible that there are boundary layers between the bulk-like layer and the dead layer and between the bulk-like layer and the liquid-like layer. The existence of such boundary layers causes the broadening of the distribution of the -relaxation time of the bulk-like layer, and this broadening is enhanced as the thickness decreases. Because can be regarded as the temperature at which the anomalous increase in begins, decreases as the distribution of broadens; , increases or decreases.
Since the liquid-like and dead layers cause the distribution of to broaden toward the shorter time side and the longer time side, respectively, the relaxation time can remain constant as long as the two contributions cancel each other. In the present measurements, we measured the peak frequencies in the dielectric loss due to the -process, which are equal to the inverse of , and it is found that at a given temperature is almost independent of the thickness down to the critical thickness .
Below the critical thickness, there is no -process with dynamical properties observed in the bulk sample. In this case, the dynamical properties of the thin film are determined by the competition between the liquid-like layer and the dead layer within the thin film. The values of can no longer remain constant, but it decreases or increases, depending on whether contributions from the liquid-like layer are stronger or weaker than those from the dead layer. In the present case, and decrease drastically for . This behavior can be accounted for by assuming that contributions from the liquid-like layer are much stronger than those from the dead layer.
Here, it should be noted that the observed value of is larger than the sum of thickness of the liquid-like layer and the dead layer, : =1123 nm, while nm. From this result it follows that for =, the bulk-like layer still exists, but the relaxation time for the -process of the bulk-like layer is different from that of the bulk sample. This suggests the possibility that at the thickness of the bulk-like layer () is comparable to the characteristic length scale of the -process. Therefore, the value of can be estimated as 113 nm, if there is assumed to exist any characteristic length scale of the -process at all. Because depends on the molecular weight of a-PS, may also depend on the molecular weight. However, more precise measurements of and showing whether these values depend on the molecular weight are necessary to elucidate the molecular weight dependence of .
In this paper, four different length scales, , , and , were extracted from the dielectric measurements. From the above discussion, is expected to be related to the characteristic length scale for the -process of bulk samples, while the values of , and are believed to be related to the heterogeneous structure of the mobility within thin films or surface and interfacial effects. According to the model of Adam and Gibbs, the size of the CRR increases as the temperature approaches . Near the glass transition temperature, the characteristic time of the -process is larger than 103 sec, and only the slow modes contribute appreciably to the dielectric loss. Hence, a more prominent -dependence of the -process can be expected when the dielectric measurements are performed for frequencies much smaller than those adopted in the present work. We plan to make such measurements in the future.
In this paper, we made dielectric measurement on capped thin films of atactic polystyrene supported on an Al deposited glass substrate. The results can be summarized as follows:
-
1.
The glass transition temperature of thin films of a-PS has been determined using the temperature change in the electric capacitance. The observed is consistent with the results obtained by other methods. A decrease in with decreasing thickness has been confirmed.
-
2.
The thermal expansion coefficient normal to the film surface increases with decreasing thickness below the apparent , while it decreases with decreasing thickness above . The thickness dependence of can be described by a linear function of the inverse of the thickness.
-
3.
The dependence of is directly correlated to that of the width of the peak due to the -process in the temperature domain and also to the distribution of relaxation times of the -process.
-
4.
The temperature at which dielectric loss is maximal due to the -process in the temperature domain and the -relaxation time obtained by the frequency dependence of the dielectric loss remain constant down to the critical thickness , while below they decreases drastically with decreasing thickness. The values of have a molecular weight dependence and are related to the radius of gyration of polymer chains.
VI Acknowledgments
This work was partly supported by a Grant-in-Aid from the Ministry of Education, Science, Sports and Culture of Japan.
REFERENCES
-
[1]
To whom correspondence should be addressed.
Electronic address: fukao@phys.h.kyoto-u.ac.jp - [2] “Proceedings of the 3rd International Discussion Meeting on Relaxations in Complex Systems”, J. Non-Cryst. Solids. 235-237 (1998).
- [3] “Proceeding of Second Workshop on Non-equilibrium Phenomena in Supercooled Fluids, Glasses and Amorphous Materials ”, J. Phys. Condens. Matter, 11(1999)
- [4] M.D. Ediger, C.A. Angell, and S.R. Nagel, J. Phys. Chem. 100, 13201 (1996), and the references cited therein.
- [5] G. Adam and J.H. Gibbs, J. Chem. Phys. 43, 139 (1965).
- [6] T. Muranaka and Y. Hiwatari, Phys. Rev. E51, R2735, (1995).
- [7] D.N. Perera and P. Harrowell, Phys. Rev. E54, 1652 (1996).
- [8] R. Yamamoto and A. Onuki, J. Phys. Soc. Jpn., 66, 2545 (1997), Phys. Rev. E58, 3515 (1998).
- [9] W. Kob, C. Donan, S.J. Plimton, P.H. Poole, and S.C. Glotzer, Phys. Rev. Lett. 79, 2827 (1997).
- [10] K. Schmidt-Rohr and H.W. Spiess, Phys. Rev. Lett. 66, 3020 (1991).
- [11] B. Schiener, R. Böhmer, A. Loidl, and R.V. Chamberlin, Science, 274, 752, (1996).
- [12] M.T. Cicerone and M.D. Ediger, J. Chem. Phys. 103, 5684 (1995).
- [13] J. Schüller, Yu. B. Mel’nichenko, R. Richert, and E.W. Fischer, Phys. Rev. Lett. 73, 2224 (1994).
- [14] M. Arndt, R. Stannarius, H. Groothues, E. Hempel, and F. Kremer, Phys. Rev. Lett. 79, 2077 (1997).
- [15] G. Barut, P. Pissis, R. Pelster, and G. Nimtz, Phys. Rev. Lett. 80, 3543 (1998); R. Pelster, Phys. Rev. B59, 9214 (1999).
- [16] J.L. Keddie, R.A.L. Jones, and R.A. Cory, Europhys. Lett., 27, 59 (1994).
- [17] J.L. Keddie and R.A.L. Jones, Faraday Discuss. 98, 219 (1994).
- [18] G.B. DeMaggio, W.E. Frieze, D.W. Gidley, Ming Zhu, H.A. Hristov, and A.F. Yee, Phys. Rev. Lett. 78, 1524 (1997).
- [19] J.A. Forrest, K. Dalnoki-Veress, J.R. Stevens, and J.R. Dutcher, Phys. Rev. Lett. 77, 2002 (1996).
- [20] J.A. Forrest, K. Dalnoki-Veress, and J.R. Dutcher, Phys. Rev. E56, 5705 (1997).
- [21] W.E. Wallace, J.H. van Zanten, and W.L. Wu, Phys. Rev. E52, R3329 (1995).
- [22] B. Jerome and J. Commandeur, Nature, 386, 589 (1997).
- [23] B. Jerome, J. Phys.: Condens. Matter, 11, A189 (1999).
- [24] D.B. Hall, J.C. Hooker, and J.M. Torkelson, Macromolecules, 30, 667 (1997).
- [25] J.A. Forrest, C. Svanberg, K. Revesz, M. Rodahl, L.M. Torell, and B. Kasemo, Phys. Rev. E58, R1226 (1998).
- [26] T. Kajiyama, K. Tanaka, and A. Takahara, Polymer, 39, 4665 (1998).
- [27] K. Fukao and Y. Miyamoto, Europhys. Lett., 46, 649 (1999).
- [28] C. Bauer, R. Böhmer, S. Moreno-Flores, R. Richert, H. Sillescu, D. Neher, Phys. Rev. E, submitted.
- [29] C. Bauer, R. Richert, R. Böhmer, J. Non-Cryst. Solids, submitted.
- [30] G. Blum, F. Kremer, T. Jaworek, and G. Wegner, Adv. Mater. 7, 1017 (1995).
- [31] O. Yano and Y. Wada, J. Polym. Sci.: Part A-2, 9, 669 (1971).
- [32] Polymer Handbook, 3rd ed., edited by J. Brandrup and E.H. Immergut (John Wiley, New York, 1989).
- [33] D.G.H. Ballard, G.D. Wignall, J. Schelten, J. Eur. Polym. J. 9, 965 (1973).
- [34] T.G. Fox, P.J. Flory, J. Appl. Phys. 21, 581 (1950).
- [35] J.L. Keddie, R.A.L. Jones, Israel J. Chem. 35, 21 (1995).
- [36] Physical Properties of Polymers Handbook, edited by J.E. Mark, pp.337 (AIP Press, New York, 1996).
- [37] Zhang Xiaomin, S. Tasaka, M. Kondo, and N. Inagaki, Polym. Preprints, Jpn. 48, E470 (1999).
- [38] A.M. Mayes, Macromolecules, 27, 3114 (1994).
- [39] W.E. Wallace, N.C. Beck Tan, W.L. Wu, and S. Satija, J. Chem. Phys. 108, 3798 (1998).
- [40] J.A. Forrest, K. Dalnoki-Veress, and J.R. Dutcher, Phys. Rev. E58, 6109, (1998).
- [41] Y.-C. Lee, K.C. Bretz, F.W. Wise, and W. Sachse, Appl. Phys. Lett. 69, 1692 (1996).
- [42] K.C. Bretz, Y.-C. Lee, F.W. Wise, and W. Sachse, Bull. Am. Phys. Soc. 42, 648 (1997).
- [43] S. Havriliak and S. Negami, Polymer 8, 161 (1967).