Ivory Tower Universities and Competitive Business Firms
Abstract
There is nowadays considerable interest on ways to quantify the dynamics of research activities, in part due to recent changes in research and development (R&D) funding[1, 2, 3, 4, 5, 6, 7, 8, 9]. Here, we seek to quantify and analyze university research activities, and compare their growth dynamics with those of business firms[10, 11, 12, 13, 14]. Specifically, we analyze five distinct databases, the largest of which is a National Science Foundation database of the R&D expenditures for science and engineering of 719 United States (US) universities for the 17-year period 1979–1995. We find that the distribution of growth rates displays a “universal” form that does not depend on the size of the university or on the measure of size used, and that the width of this distribution decays with size as a power law. Our findings are quantitatively similar to those independently uncovered for business firms[10, 11, 12, 13, 14], and consistent with the hypothesis that the growth dynamics of complex organizations may be governed by universal mechanisms.
In the study of physical systems, the scaling properties of fluctuations in the output of a system often yield information regarding the underlying processes responsible for the observed macroscopic behaviour[15, 16]. Here, we analyze the fluctuations in the growth rates of university research activities, using five different measures of research activity. The first measure of the size of a university’s research activities that we consider is R&D expenditures. The rationale for using R&D expenditures as a measure of research activity is that research is an expensive activity that the university finances with external support.
We first analyze a database containing the annual R&D expenditures for science and engineering of 719 US universities[17] for the 17-year period 1979–1995 ( 12,000 data points). The expenditures are broken down by school and department. The annual growth rate of R&D expenditures is, by definition, , where and are the R&D expenditures of a given university in the years and respectively. We expect that the statistical properties of the growth rate depend on , since it is natural that the fluctuations in will decrease with . Therefore, we partition the universities into groups according to the size of their R&D expenditures (Fig. 1a). Figure 1b suggests that the conditional probability density, , has the same functional form, with different widths, for all .
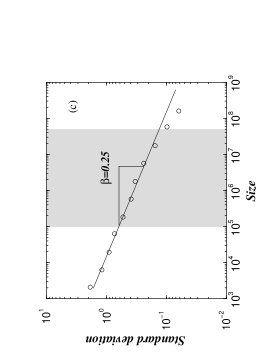
We next calculate the width of the distribution of growth rates as a function of . Figure 1c shows that scales as a power law
| (1) |
with . In Fig. 1d, we collapse the scaled conditional probability distributions onto a single curve.
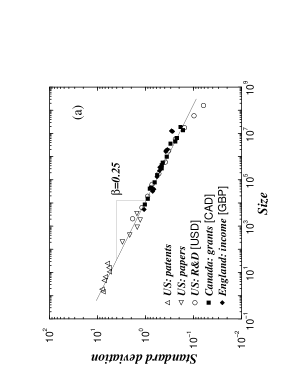
To test if these results for the dynamics of R&D expenditures are valid for other measures of research activity, we next analyze another measure of a university’s research activities, the number of papers published each year[18, 19, 20]. We analyze data for the 17-year period 1981–1997 from the US University Science Indicators [21], which records the number of papers published by the top 112 US universities ( 1,900 data points). We find that the analog of Fig. 1 holds. Particularly striking is the fact that the same exponent value, , is found (Fig. 2a) and that the same functional form of is displayed (Fig. 2b).
Next, we consider as a measure of size the number of patents issued to a university[22]. We “manually” retrieve from the webpages of the US Patent and Trademark Office’s database[23] the number of patents issued to each of 106 universities each year of the 22-year period 1976–1997 ( 2,300 data points). We confirm that the analog of Fig. 1 holds, with the same exponent value, (Fig. 2a), and the same functional form of , Fig. 2b.
To test if our findings hold for different academic systems, we analyze two databases on research funding of English[24] and Canadian[25] universities. The same quantitative behavior is found for the distribution of growth rates and for the scaling of , with the same exponent value (Fig. 2a) and the same functional form of , Fig. 2b. Thus, the analysis of all five databases confirms that the same quantitative results hold across different measures of research activity and academic systems.
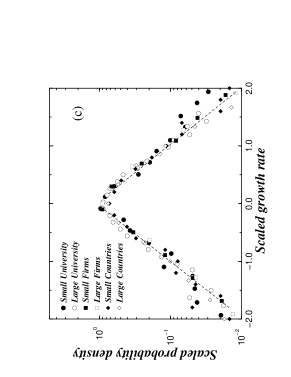
We next address the question of how to interpret our empirical results. We start with the observation that research is an expensive activity, and that the university must “offer” its research to external sources such as governmental agencies and business firms. Thus, an increase in R&D expenditures at university and a decrease at university implies that the funders of research increasingly choose their research from university as opposed to university [1]. This qualitative picture parallels the competition among different business firms, so it is natural to enquire if there is quantitative support for this analogy between university research and business activities. To quantitively test this analogy, we note that the results of Fig. 1 are remarkably similar to the results found for firms[13, 14] and countries[26, 27, 28]. We plot in Fig. 2c the scaled conditional probabilities for countries, firms and universities, and find that the distributions for the different organizations fall onto a single curve.
There is, however, one difference: For firms and countries, we find , while for universities, . We can understand this difference using a model for organization growth[29]. In the model, each organization —university, firm, or country— is made up of units. The model assumes these units grow through an independent, Gaussian-distributed, random multiplicative process with variance . Units are absorbed when they become smaller than a “minimum size”, which is a function of the activity they perform. Units can also give rise to new units if they grow by more than the minimum size for a new unit to form. The model predicts , where is the width of the distribution of minimum sizes for the units[29]. For firms, the range of typical sizes is very broad —from small software and accounting firms to large oil and automobile firms— suggesting a large value of . On the other hand, for universities, the range of typical sizes is much narrower, suggesting a small value of and implying a larger value of than for business firms. This is indeed what we observe empirically.
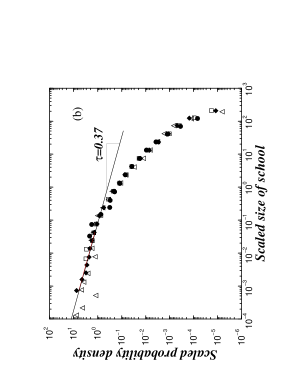
Business firms are comprised of divisions and universities are made up of schools or colleges, so it is natural to consider the internal structure of these complex organizations[30]. We next quantify how the internal structure of a university depends on its size by calculating the conditional probability density to find a school of size in a university of size (Fig. 3a). The model predicts that obeys the scaling form[29]
| (2) |
where for , and decays as a stretched exponential for . We find (Fig. 3b), and (Fig. 3c). We test the scaling hypothesis (2) by plotting the scaled variables versus . Figure 3b shows that all curves collapse onto a single curve, which is the scaling function .
Equation (2) implies that the typical number of schools with research activities in a university of size scales as , while the typical size of these schools scales as . Hence, we can calculate how depends on ,
| (3) |
In order to determine , we first find the dependence of on . Figure 3d shows that with . Substituting into (3) and remembering that the typical size of the schools is , we obtain , which leads to the testable exponent relation
| (4) |
For and , Eq. (4) predicts , in surprising agreement with our empirical estimate of from the five distinct databases analyzed (Fig. 2a).
Our results are consistent with the possibility that the statistical properties of university research activities are surprisingly similar for different measures of research activity and for distinct academic systems. Moreover, our findings for university research resemble those independently found for business firms[10, 11, 12, 13, 14] and countries[26, 27, 28]. One possible explanation is that peer review, together with government oversight, may lead to an outcome similar to that induced by market forces, where the analog of peer-review quality control may be consumer evaluation, and the analog of government oversight may be product regulation.
REFERENCES
- [1] Moed, H.F., Luwel, M., Houben, J.A., Van Den Berghe, H., & Spruyt, E., Funding and research performance. Nature 392, 119 (1997).
- [2] Miflin, B., Institutes top UK science league table. Nature 390, 12 (1997).
- [3] Buffetaut, E., No independence for French researchers. Nature 392, 542 (1998).
- [4] Anderson, C., Job security - Tenure, under fire once again, still holds strong. Science 265, 1923 (1994).
- [5] Holden C., Tenure turmoil sparks reforms. Science 276, 24-26 (1997).
- [6] Halpern, J.J., & Velleman P.F., Tenure tracking. Science 276, 1321 (1997).
- [7] Geissman, J.W., et al., Tenure tracking. Science 276, 1320–1321 (1997).
- [8] Gazzaniga, M.S., Editorial: How to change the university. Science 282, 237 (1998).
- [9] Cooper, W.E., Restructuring the university. Science 282, 1047 (1998).
- [10] Gibrat, R., Les Inégalités Economiques (Sirey, Paris, 1931).
- [11] Ijiri, Y. & Simon, H. A., Skew Distributions and the Sizes of Business Firms (North Holland, Amsterdam, 1977).
- [12] Sutton, J., Gibrat’s legacy. J. Econ. Lit. 35, 40–59 (1997).
- [13] Stanley, M.H.R., Amaral, L.A.N. , Buldyrev, S.V., Havlin, S., Leschhorn, H., Maass, P., Salinger, M.A., and Stanley, H.E., Scaling behaviour in the growth of companies. Nature 379, 804–806 (1996).
- [14] Takayasu H. & Okuyama K., Country dependence on company size distributions and a numerical model based on competition and cooperation. Fractals 6, 67–79 (1998).
- [15] Vicsek, T. Fractal Growth Phenomena, 2nd ed. (World Scientific, Singapore, 1992).
- [16] Bunde, A. & Havlin, S. Fractals and Disordered Systems (Springer-Verlag, Berlin, 1991).
- [17] National Science Foundation, Division of Science Resources Studies, Academic Research and Development Expenditures (NSF, Arlington, VA, 1998).
- [18] Braun, T. & Schubert, A., Indicators of research output in the sciences for 5 central European countries, Scientometrics 36, 145–165 (1996).
- [19] Lewison, G., New bibliometric techniques for the evaluation of medical schools, Scientometrics 41, 5–16 (1998).
- [20] Schwarz, A. W., Schwarz, S., & Tijssen, R. J. W., Research and research impact of a technical university — A bibliometric study, Scientometrics 41, 371–388 (1998).
- [21] United States University Science Indicators on Diskette, 1981–1997 (Institute for Scientific Information, Philadelphia, PA,1998).
- [22] Narin, F., Patents as indicators for the evaluation of industrial research output, Scientometrics 34, 489–496 (1995).
- [23] United States Patent and Trademarks Office Databases 1976–1997 [http://www.uspto.gov].
- [24] Higher Education Funding Council for England, The 1996 Research Assessment Exercise (HEFCE, Bristol, 1996).
- [25] Natural Sciences and Engineering Research Council of Canada, NSERC Grant Database for 1991–1998 (NSERC, Ottawa, 1999).
- [26] Summers, R. & Heston, A. The Penn World Tables (Mark 5): An expanded set of international comparisons, 1950-1988 Quarterly J. Economics 106, 327–368 (1991).
- [27] Durlauf, S. N. On the convergence and divergence of growth rates. The Economic J. 106, 1016–1018 (1996).
- [28] Lee, Y. Amaral, L.A.N., Canning, D., Meyer, M., and Stanley, H.E. , Universal features in the growth dynamics of complex organizations. Phys. Lev. Lett. 81, 3275–3278 (1998).
- [29] Amaral, L.A.N., Buldyrev, S.V., Havlin, S., Salinger, M.A., and Stanley, H.E., Power law scaling for a system of interacting units with complex internal structure. Phys. Lev. Lett. 80, 1385–1388 (1998).
- [30] Jovanovic, B., The diversification of production. Brookings Pap. Econ. Ac.: Microeconomics (1), 197–247 (1993).
ACKNOWLEDGEMENTS: We are indebted to the referees of this manuscript for helpful suggestions which motivated additional analysis of four databases reported here and the possible practical implications discussed. We thank M. Barthélemy, S.V. Buldyrev, D. Canning, X. Gabaix, S. Havlin, P.Ch. Ivanov, H. Kallabis, Y. Lee, and B. Roehner for stimulating discussions. We also thank N. Bayers, E. Garfield, and especially R.E. Hudson for help with obtaining the ISI database. We thank NSF, and LANA thanks FCT/Portugal for financial support.