Spectroscopy, Interactions, and Level Splittings in Au Nano-particles.
Abstract
We have measured the electronic energy spectra of nm-scale Au particles using a new tunneling spectroscopy configuration. The particle diameters ranged from 5nm to 9nm, and at low energies the spectrum is discrete, as expected by the electron-in-a-box model. The density of tunneling resonances increases rapidly with energy, and at higher energies the resonances overlap forming broad resonances. Near the Thouless energy, the broad resonances merge into a continuum. The tunneling resonances display Zeeman splitting in a magnetic field. Surprisingly, the -factors () of energy levels in Au nano-particles are much smaller than the g-factor (2.1) in bulk gold.
pacs:
73.23.-b,73.23.Hk,73.50.-hIn nanoscale metallic particles, the electronic energy levels are quantized due to spatial confinement. Prior to the present work, this effect has been studied only by Ralph et al. [1], in small grains of Al. In this paper, we report tunneling data on energy spectra in Au nanoparticles, measured with a new tunneling configuration. We first show data which qualitatively confirm the results of Ralph et al. on the Al excitation spectra, but in Au particles. Next, we confirm the role of the Thouless energy in the spectra of metallic particles. We also present new results showing Zeeman splitting of energy levels analogous to the Zeeman effect in Al particles, but with g-factors much smaller than two.
To be able to resolve the discrete energy levels in Au at 100 mK, the particle radius has to be less than approximately 10 nm. Fig. 1-a explains the steps in our sample fabrication process. The first step is electron beam lithography. Using a PMMA bilayer resist technique, we define a resist bridge placed 200 nm above the Si wafer; this bridge acts as a mask. In step 2, we evaporate a 15 nm thick film of Al, along the direction indicated by the arrow. Then we oxidize the surface of the film in 50 mtorr of oxygen for 90 sec. In step 3, we deposit a 1 nm thick film of Au, along the same direction as in step 2. At this stage of film formation, Au forms isolated particles, with a typical center-to-center spacing of 12 nm and a typical base diameter of 6 nm.[2] Next we rotate the sample by 90∘. In step 4, we deposit the top electrode, along the direction indicated by the arrow. The top electrode is a bilayer, which has a 3 nm thick layer of Al2O3 at the bottom, and a 15 nm thick film of pure Al on top. The deposition angle is chosen so that the overlap between the bottom and the top electrode is approximately 20 nm. Typically, we grow many electrode pairs simultaneously, and vary the overlap from 0 to 30 nm. Fig. 1-b is a schematic of the sample at a much larger magnification, showing that the particle is well screened by the electrodes. Because the oxide between the two electrodes is thick, current between the leads flows only through the particle(s), due to the exponential dependence of tunnel current on barrier thickness.
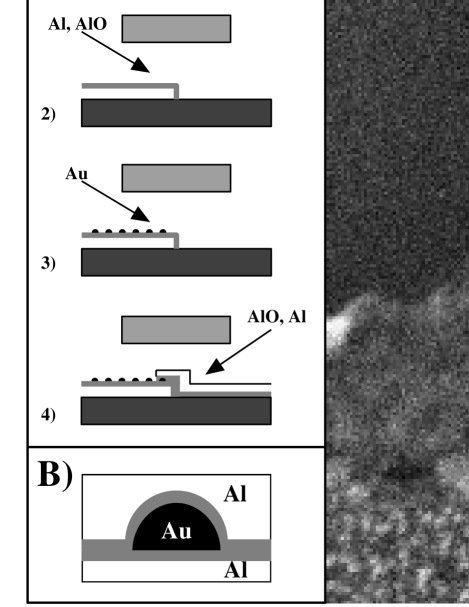
Fig. 1-c is an SEM image of a typical device. Au nanoparticles are visible on the top aluminum electrode and on the lower electrode far from the overlap region. In this work, we present data on particles with base diameter less than 10 nm, where their shape is roughly hemispherical. The area of the electrode overlap is such that in most cases, 0-3 particles are covered by the overlap. From the data, we can determine whether the tunneling current flows via only one particle, as explained in the next two paragraphs. The yield of single-particle samples is about 30%.
Fig. 2-a displays the I-V curve in sample 1 at 4.2 K. At this temperature, the energy levels are not resolved, and at first sight, the I-V curve is piece-wise linear. The electron transport at 4.2K is well described by the theory of single charge tunneling and the Coulomb staircase for tunneling via a single particle.[3] The junction capacitances and , and the background charge can be determined from the points where the I-V curve changes slope. From the theory[3], we can also estimate the junction resistances from the data. A summary of the parameters for this and two other samples are shown in Table 1. The capacitance per unit area in our junctions is .[4] We estimate the particle base diameter and volume by assuming that the total capacitance of the hemispherical particle is equal to .
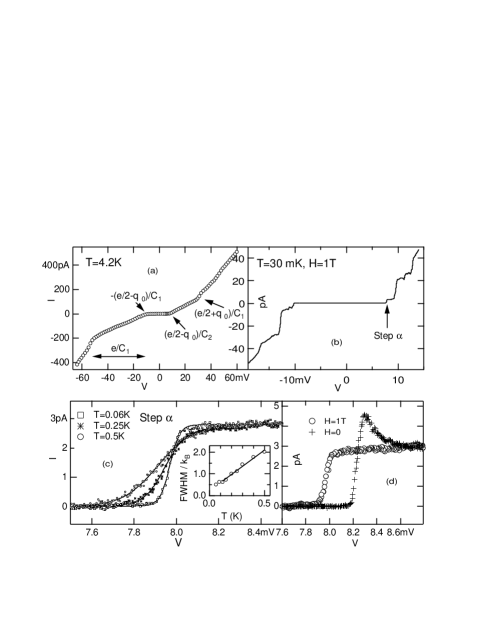
We apply a number of consistency checks to our measurements to ensure that we are measuring a single particle. These consistency checks were introduced and explained in the work by Ralph et al[1]. Fig. 2-b presents the I-V curve of the sample at 30 mK refrigerator temperature on an expanded scale. At low voltages, current increases in discrete steps. Fig. 2-c shows step in detail at three different refrigerator temperatures. The curves between the points are fits to the Fermi distribution. The strong temperature dependence of the line-shape demonstrates that tunneling is via a discrete quantum level in the particle. After correcting for the capacitive division of voltage, the full-width-half-maximum (FWHM) of the peak is linear with the refrigerator temperature, as shown in Fig. 2-c, with the slope of , which is close to the expected slope of . At very low refrigerator temperatures, FWHM is temperature independent, and the base electron temperature is 70 mK. A magnetic field of 1T is applied to supress superconductivity in the leads.
In Fig. 2-d we show the line-shape of the level when the Al leads are superconducting and when the superconductivity is suppressed with a field of 1T applied parallel to the film plane. In zero field, the line-shape traces the BCS density of states in the aluminum leads. The shift of the level which occurs when the leads change from superconducting to normal is proportional to the BCS gap in Al, and it depends on the ratio of the capacitances between the particle and the two leads. The shifts of the levels which we observe when Al is driven normal (not shown) indicate that all the levels have the same capacitances to the leads, as expected if all resonances occur in a single grain.
Fig. 3 shows the excitation spectra () in three samples, in a field of 1T to suppress the superconducting gap in the leads. Peaks occur at the energy levels of the particle. For each of the samples, the corrective factor between voltage and particle energy is shown in the figure. In sample 2, not all the levels correspond to the same number of electrons on the particle.[5]
In the single-electron model, energy levels near the Fermi energy should be distributed with only small fluctuations between the successive level spacings (spectral rigidity). The spectra shown in Fig. 3 are very different from such single-electron excitation spectra. At low energies, spectroscopic peaks are sharp and well separated. As the excitation energy is increased, the density of tunneling resonances increases, and the peaks have a tendency to cluster. Eventually, we can not resolve individual energy levels anymore; however we can still resolve envelopes (broad resonances) of many overlaping tunneling resonances. The broad resonances increase in width as the energy increases, and finally, broad resonances merge forming a continuum in the tunneling density of electronic states.
The increase in the density of tunneling resonances with energy seen in Fig. 3 can be explained by electron-electron interactions. In the non-equilibrium model due to Agam et al.[6], the same single electron state can occur with different excited configurations of the other electrons in the particle. The theory of Altshuler et al.[7] describes the delocalization (in Fock space) of a quasiparticle by the creation of electron-hole pairs. This leads to an increase in the density of discrete levels with increasing energy and to the existence of quasiparticles with finite lifetime above a certain energy. The highest energy at which the quasiparticles can be resolved is predicted to be the Thouless energy.[8]
The idea that the Thouless energy sets the limit of the observability of the discrete energy spectrum in an interacting electron system has been first experimentally studied by Sivan et al.[8], on a disordered semiconducting quantum dot. In that work, the authors’ data analysis shows that there has to be a finite energy above which the energy levels in a quantum dot can not be resolved. In our particles, unlike semiconducting quantum dots, the charging energy is so much larger than the level spacing that we can, for the first time, access and display the entire progression, out to the high energy horizon, all within the first step of Coulomb blockade.
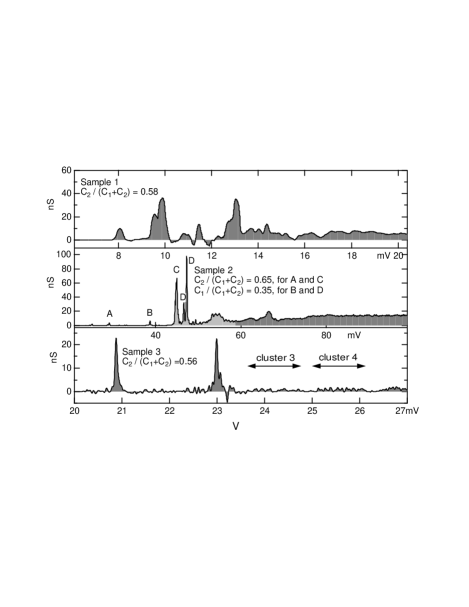
Because the density of observed peaks increases rapidly with energy, we rely on spectral rigidity and estimate the single-electron level spacing as the distance between the two lowest energy peaks. The agreement between the measured level spacing and the calculated one (from the grain volume inferred from the capacitance) is within a factor of 2, as shown in Table 1. We note that in sample 3, the distance between the low energy clusters is approximately the single-electron level spacing, consistent with the theories of electron-electron interactions.
If we assume that the electronic motion in the particle is ballistic, and that the surface scattering is diffusive, then the mean-free path of an electron confined in the particle is approximately . To diffuse through the entire particle volume however, an electron should scatter from the particle surface about three times. Thus, we estimate the electronic traversal time as (essentially, the factor of 3 is the number of dimensions). The Thouless energy is given approximately as = 37meV, 75meV and 40meV, for samples 1, 2, and 3, respectively. It can be seen from samples 1 and 2 that these estimates of the Thouless energy are consistent within a factor of 2 of the bias voltage at which the spectra become independent of energy.
Note that the agreement between the theory and our data is better if we compare the bias voltage with the Thouless energy, i. e., if we do not correct the Thouless energy with capacitive division prefactors. Our explanation is that the highly excited states predicted by the Agam model can initiate the formation of electron-hole pairs. The maximum number of a particle’s excited states which can form when electrons exit the particle, is given by the bias voltage divided by the level spacing. This number is 10, 12, and 20 for samples 1, 2, and 3, respectively.[9] Thus, the role of large bias voltage (due to large charging energy) is to reduce the range of energies where the levels can be resolved. If , so that there is little Coulomb blockade, we would expect to see many more resolved levels, as found by Ralph et al. in gated aluminum particles.
We have measured the evolution of the spectrum with applied magnetic field. In a metallic particle, every orbital state has a 2-fold spin degeneracy. Let be the number of electrons on the particle after an electron has tunneled onto (or off) the particle. If is even, the total spin in the ground state is zero in the simplest model of weakly interacting electrons, and the first tunneling resonance shifts but does not split with magnetic field. If is odd, there is an unpaired spin, and all the levels split with magnetic field. (Because the particle is small, the effect of the field on electronic orbits is negligible.)
Zeeman splittings in agreement with this simple model have been measured in Al nanoparticless[1] and some carbon nanotube ropes[10]. However, in ferromagnetic particles, and, surprisingly, also in large semiconducting quantum dots and some carbon nanotubes, the expected spin degeneracy is not observed experimentally.[11] In this work, we do measure Zeeman splitting in Au nanoparticles, confirming that spin degeneracy is commonly observed in simple metals, as expected, even though it is not observed in some other systems.
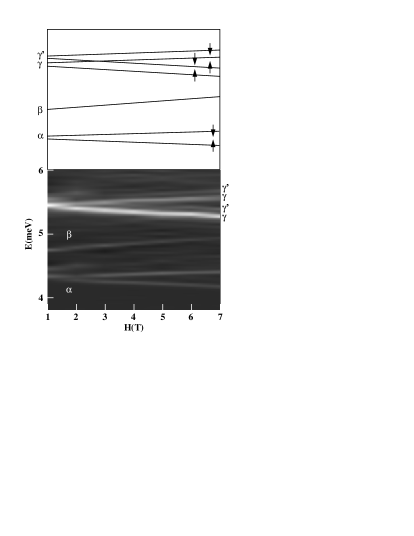
Fig. 4 is the gray-scale image of the magnetic field dependence of the energy spectrum in sample 1, at negative bias voltage, where the particle is further away from equilibrium than for positive bias. The low energy levels split with magnetic field, and the splitting is linear with field. Because the lowest level splits into two, we conclude that the number of electrons is odd. From the data, we obtain that the g-factor in this resonance is . Sample 3 has similar splittings, with a -value of 0.44. In sample 2, the lowest two peaks do not split implying that the number of electrons on the particle is even. The splitting of the higher energy peaks in sample 2 could not be resolved.
A -factor of in Au nanoparticle eigenenergies is much smaller than the g-factor of determined by electron spin resonance measurements in bulk Au.[12] We explain the weak Zeeman splitting of Au nanoparticle eigenenergies by the strong spin-orbit (s-o) interaction in Au. The explanation is corroborated by the work by Salinas et al.[13], where eigenenergies of superconducting Al nanoparticles doped with 4% of Au had g-factors in range 0.5-0.8, instead of 2, which is the g-factor in pure Al. The effect of s-o interaction on the single-electron eigenstates[14] is to mix up-spin and down-spin polarizations, which leads to reduced g-factors.
The discrepancy between the g-factors determined by spin resonance experiments in bulk Au[12] and the g-factors of obtained here by tunneling spectroscopy implies that for a high-Z element such as Au, these two techniques measure two different quantities, which can not be directly compared. Further theoretical study is needed to explain this discrepancy and derive the g-factors in Au nanoparticles. We speculate that the nanoparticle geometry (very large surface to volume ratio) plays an essential role in g-factors reduction, pressumably because the spin-flip scattering in Au nano-particles occurs at the particle surface.
Note that in Fig. 4, resonance does not split with magnetic field, and resonances and split with magnetic field and cross; the analysis of these effects is beyond the scope of the present paper.[15]
In conclusion, we have performed spectroscopy of discrete energy levels in Au nanoparticles, with a new tunneling configuration. Data for some of our samples include the entire spectrum starting from single electron levels at low energy, progressing to a regime where only broad resonances (composed of many discrete levels) can be resolved, and ending in a continuum. We have observed Zeeman splitting under applied magnetic field and found very small -factors, much smaller than the g-factors in bulk Au.
The authors wish to thank Bertrand Halperin, Yuval Oreg, Piet Brouwer, Dan Ralph, Steve Shepard and Sarah Pohlen for useful discussions. This work has been supported in part by NSF grants DMR-97-01487, DMR-94-00396, PHY-98-71810, and ONR grant N00014-96-0108.
REFERENCES
- [1] D. C. Ralph et al., Phys. Rev. Lett. 74, 3241 (1995); C. T. Black et al., Phys. Rev. Lett. 76, 688, (1996); D.C. Ralph et al., Phys. Rev. Lett. 78, 4087-90 (1997).
- [2] D. Davidović and M. Tinkham, Appl. Phys. Lett. 73, 3959 (1998).
- [3] D. V. Averin and K. K. Likharev, in Mesoscopic Phenomena in Solids edited by B. L. Altshuler, P. A. Lee, and R. A. Webb (Elsevier, Amsterdam 1991) p. 169.
- [4] J.G. Lu, J.M. Hergenrother, and M. Tinkham, Phys. Rev. B57, 4591-4598 (1998)
- [5] We distinguish between the two sequences by measuring the normal-superconducting peak shifts, and by comparing the FWHM of the peaks as a function of temperature, both of which depend on the capacitance ratio. Peaks A and C in sample 2 arise from an electron tunneling onto the particle then tunneling off, whereas for peaks B and D, the tunneling occurs in the opposite order. In samples 1 and 3, the low energy peaks correspond to the same charge state of the particle.
- [6] O. Agam, N. S. Wingreen, B. L. Altshuler, D. C. Ralph, and M. Tinkham, Phys. Rev. Lett. 78, 1956 (1997).
- [7] B. L. Altshuler, Y. Gefen, A. Kamenev, and L. S. Levitov, Phys. Rev. Lett. 78, 2803 (1997).
- [8] U. Sivan et al., Europhys. Lett., 25, 605 (1994).
- [9] In a steady state, about 1/2 of the particle excitation energy is transferred to the drain electrode.
- [10] David H. Cobden et al., Phys. Rev. Lett. 681 (1998).
- [11] D. R. Stewart et al., Science 278, 1784 (1998); S. Gueron et al., in cond-matt/9904248 ; S. J. Tans et al., Nature 394, 761 (1998).
- [12] P. Monod P. and A. Janossy, J. Low Temp. Phys., 26, 311 (1977).
- [13] D. G. Salinas et al., in cond-mat/9904158.
- [14] W. P. Halperin, Rev. Mod. Phys. 58, 533 (1986).
- [15] To be published.
| Sample | aF | aF | ] | [meV] | [meV] | Parity | ||||
| 1 | 4 | 5.5 | 0.15 | 7.9 | 9 | 0.65 | 1 | 37 | ODD | 0.28 |
| 2 | 0.9 | 1.67 | 0.066 | 2 | 4.7 | 4.6 | 7 | 75 | EVEN | - |
| 3 | 1.9 | 2.4 | 1.25 | 2.5 | 6 | 2.1 | 1.2 | 40 | ODD | 0.45 |