Structure and Rheology of the Defect-gel States of Pure and Particle-dispersed Lyotropic Lamellar Phases
Abstract
We present important new results from light-microscopy and rheometry on a moderately concentrated lyotropic smectic, with and without particulate additives. Shear-treatment aligns the phase rapidly, except for a striking network of oily-streak defects, which anneals out much more slowly. If spherical particles several microns in diameter are dispersed in the lamellar medium, part of the defect network persists under shear-treatment, its nodes anchored on the particles. The sample as prepared has substantial storage and loss moduli, both of which decrease steadily under shear-treatment. Adding particles enhances the moduli and retards their decay under shear. The data for the frequency-dependent storage modulus after various durations of shear-treatment can be scaled to collapse onto a single curve. The elasticity and dissipation in these samples thus arises mainly from the defect network, not directly from the smectic elasticity and hydrodynamics.
pacs:
PACS no.: 61.30Jf, 61.30Eb, 83.70I Introduction and Results
Many useful materials arising in the domain of chemical engineering are liquid-crystalline, frequently lamellar. They are generally processed under conditions of shear flow, and often structured by the addition of particles [1] . The complex dynamic modulus of these materials as a function of the angular frequency (=2) presents many puzzles. For example, the lamellar Lα phase, although in principle a one-dimensional stack of two-dimensional fluid layers and hence incapable, in the ideal, perfectly ordered state, of sustaining a static shear stress, generally displays [2] in practice a modest storage modulus at small . In addition, it has an anomalously large low-frequency loss modulus . Since many soft solids, lamellar or otherwise, share these features[3], it is clear that rheometry alone cannot discriminate between various models for these materials.
Since the observed rheometric properties of lamellar phases (for some recent studies see [4, 5, 6]) are presumably a consequence of topological defects and textures, one must first correlate the rheometry to direct visual observations. One could then hope to build a theory in two stages, by explaining first how the defects produce the rheology, and second why flow or sample preparation produces the defects to begin with. A major motivation for the present study, in particular, is the observation [1] of a large enhancement of the shear modulus of Lβ gels upon the addition of a very small concentration of particles. Accordingly, this paper reports parallel studies of the viscoelastic properties and defect structure of the lamellar phase, and the effect thereon of shear-treatment and particulate additives. Our main results are as follows:
-
Pure lamellar phase without shear-treatment: The Lα samples have Pa and Pa at rad/sec. Both and depend only weakly on , with nearly flat. Between crossed polars, the system appears dense with defects.
-
Shear-treatment without added particles: If the system is subjected to steady shear at a low rate ( 1 to 50 s-1) for a specified duration , the small-amplitude frequency-dependent moduli measured after switching off the steady shear depend strongly on both and . In general, the moduli thus measured decrease with increasing for fixed , but appear roughly to level off at a value which is an increasing function of . The reported here seem to depend weakly on the shear history. Observations between crossed polars show that the shear-treated samples consist of macroscopically well-oriented lamellae parallel to the applied velocity, and normal to the velocity gradient, threaded by a rather beautiful network of oily-streak defects [7, 8] (see section III A for background on these defects), as seen recently in cholesterics [9]. It is thus clear that the dominant contribution to the rheology comes from this defect network in an otherwise well-oriented phase [9], not from a polydomain averaging of the smectic elasticity, as suggested by [10].
-
Effect of particulate additives: Suspending micron size particles had a dramatic effect on the structure and rheology. Prior to shear treatment both and are appreciably larger. Under shear-treatment, the oily-streak network survives much longer, with the spheres located at its nodes, and the measured and persist longer. This picture of a particle-stabilised defect network is consistent with the observations of [9] on colloid-doped cholesterics. It is worth adding that careful observations under the polarising microscope reveal unambiguously that the alignment at the particle surface is homeotropic.
The relevance of our work to that of Shouche et al.[1] should be emphasised here. It was conjectured in [1] that the enhancement of elasticity when particles are added to an Lβ gel arose from interparticle bridges formed by surfactant molecules. Our study suggests strongly that oily-streak defects, not surfactant molecules, form the bridges, and we are now turning our attention to Lβ phases to see if this is so.
The remainder of this paper is organised as follows. In section II we specify the samples used and describe our experimental setup. In section III we present in detail our visual observations of the defect structure and its evolution under shear, with and without added particles. The steady-shear and small-amplitude rheometry of these systems are discussed in Section IV. We close in section V with a tentative interpretation and analysis of our results.
II Experimental
A Sample and sample preparation
The lamellar (Lα) sample is a commercially available (Galaxy) anionic surfactant, sodium dodecyl ether sulphate or SLES (73.2 wt.%) in water with a substantial but unspecified concentration of ionic impurities. For some of the experiments we have diluted this sample with distilled water and homogenized the mixture in the oven at 70∘C for a few hours. We have dispersed 9.550.44 m polystyrene + 30% polybutylmethacrylate (initially suspended in water, Bangs Lab) spheres at nominal volume fractions of 0.5 % in the Lα sample. The mixtures were made by manually mixing in the particles with a glass rod or spatula. The samples were centrifuged briefly to remove air bubbles.
B Imaging setup
Our experimental studies of the flow properties of particle laden lyotropic smectic liquid crystals are in two parts. While the rheometry is carried out in a commercial rheometer (details below), the visualisation of the defect structure under flow is done in a custom-built flow cell. The design is based on one available in the literature [11], and was executed by Holmarc Instruments.

Two horizontal glass plates (Borosilicate, BK7) lying parallel to the plane form the walls of the channel, and the sample is sheared between these plates, providing a linear (plane Couette) flow with velocity along and gradient along . The stationary lower glass plate is fixed to a metallic plate mounted on two micrometer screws, which are used to ensure that the lower glass plate is parallel to the upper plate. The upper plate is attached to the moving arm of a translation stage, and the vertical () separation between the plates adjusted using a micrometer (least count = 10m) fixed to the moving arm of the stage. The moving arm is mechanically linked to a linear stepper motor via a lead screw (Holmarc Instruments), allowing a minimum step size 0.005 mm. The motor is controlled by a computer using an ISA interface card (Semica Data Systems). This translation stage is mounted on the microscope stage as shown in Fig. 1.
The sample is viewed through crossed polars using a Nikon Optiphot2-Pol polarising microscope fitted with a CCD camera (Sony TK-S300) whose output goes simultaneously to a video recorder and a computer for image analysis (NI IMAQ 1408 image grabbing card). The line of sight is in the direction of the velocity gradient. Note that a sample aligned homeotropically, i.e., with layers parallel to the plates, should appear dark through crossed polars.
The glass slides were cleaned thoroughly before the sample was loaded and were not pretreated for any preferential alignment. The rheooptic experiments were conducted at room temperature (25–28∘C).
Our rheometric studies have been carried out on a Rheolyst AR1000N (TA Instruments) stress contolled rheometer. For all the experiments quoted in this paper we have used a 4 cm parallel plate geometry and the temperature was maintained at 25 ∘C.
III Defect structure of the lamellar phase, and its evolution under shear
A Defect network of the lamellar phase without particles
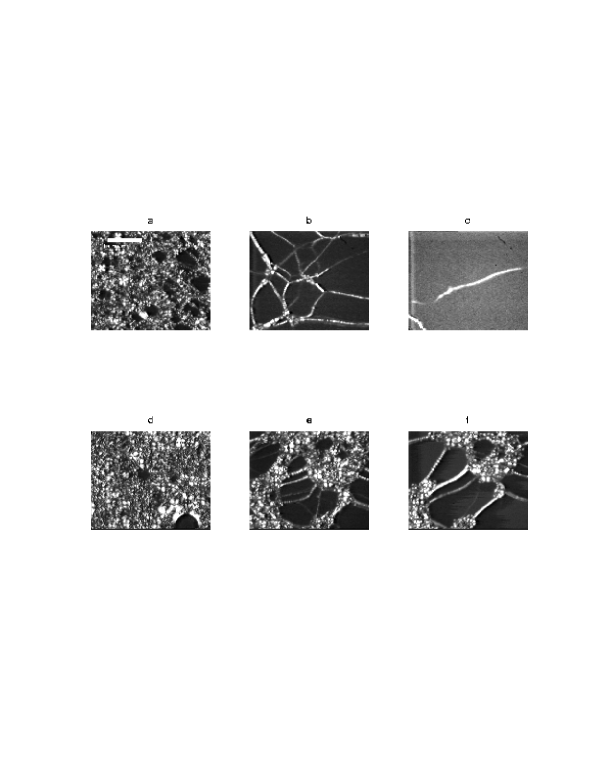
The sample when loaded presents a bright appearance because it is full of defects. The texture is that of a typical lyotropic lamellar liquid crystal. We then subject it to large-amplitude oscillatory shear of frequency 0.1 Hz and end-to-end amplitude 1 mm. The sample thickness is 100m for the case we are reporting in this paper, with a triangle-wave strain, so that in each phase of its motion there is a constant shear-rate s-1. The structure observed between crossed polars evolves steadily from its initial highly defect-ridden state, Fig. 2(a), to one with large dark (and hence homeotropic) regions, with a striking, sparse, sample-spanning network of linear oily-streak [7] defects (Fig. 2b), and finally to an almost totally homeotropically oriented lamellar state with a weak background of defects (Fig. 2c). That the defects span the sample is clear from the video because different portions of a typical defect line move at different speeds under shear, indicating that they are at different depths. This network structure is very similar in appearance to that seen in [9], and the behaviours of the two systems are broadly alike.
We remind the reader that oily streaks [8] are formed in lamellar phases upon the close approach of a pair of parallel dislocation lines with Burgers vectors with magnitude and and opposite sign. Instead of annihilating partly to yield a simple dislocation with Burgers vector of magnitude , they display a complex internal structure, whose nature depends on material properties such as the splay and saddle-splay rigidity moduli of the lamellae. Oily streaks have been discussed in detail in [12] and [7], and the latter paper provides an explanation of the variety of inner structures observed in these defects. The two main possibilities considered are: (i) the dislocation lines retain a core structure consisting of a pair of disclination lines, with modulations runing along their length, and (ii) they nucleate an array of focal conic domains if the saddle-splay modulus favours large negative Gaussian curvature. Our system shows focal domains, and we will therefore use the model of [7] to estimate the line energy of the streaks in section V.
The following important differences between our experiments and those of [9] on cholesteric liquid crystals remain to be understood: (i) The defect network in our study, unlike that in [9], shows no sign of coarsening in the absence of shear treatment. Indeed, we observe no spontaneous annealing of the initially defect-ridden structure unless sheared. Possibly the much larger ratio of sample thickness to layer spacing in our study is responsible for this difference; the absence of surface treatment of our plates could also play a role. (ii) Our network under shear evolves mainly by the thinning and eventual disappearance of lines; we almost never ***Our video footage contains one possible candidate for a detachment-and-retraction event. observe the detachment and retraction events reported in [9]. It remains unclear whether detachment events are taking place at scales unresolved by our imaging, but thinning is clearly an important component of the process. (iii) The terminal defect density is higher if the imposed shear-rate is higher. (iv) The defect line segments are not as straight as those in [9] appear to be, and flex rather than rotate rigidly when sheared. This could have implications for the elasticity of the network. (v) As the sample is continuously sheared, regions which had initially become homeotropic display the onset of a square grid like defect structure. A similar type of shear induced defect structure has been seen by Larson et al.[5] in a thermotropic liquid crystal. This is due to disruption of the monodomains in the form of undulation instabilities [13]. Lastly, we do not see, over the range of shear rate examined, the multilamellar vesicles (“onions” [4]) found in shear studies of more dilute lamellar phases.

B The effect of suspended particles on the defect network
The effect of a small concentration (nominally 0.5 %) of polystyrene + 30% polybutylmethacrylate spheres of diameter 9.55 m on the behaviour of the defect network was quite dramatic. Note first that the initial configuration shows a clearly homeotropic anchoring of the lamellar phase onto the particles. This can be seen explicitly, by noting the colour variation as a function of angle around the particle (colour pictures will be sent by the authors upon request, and may be viewed at http://144.16.75.130/lcrheol/) when it is viewed with a (530 nm) plate inserted with its vibration directions at 45∘ with respect to the extinction position of the crossed polarisers, and using the colour charts provided in standard books on polarising microscopy, e.g. [14]. Before the application of shear, the particles appear to be well dispersed in the sample.
If we shear at 2 s-1 as in the undoped case an oily streak network appears. Now we find that the network after 140 seconds (Fig. 2e), is much denser than in Fig. 2(b) with particles aggregated at its nodes. After 350 seconds of shearing the network is still substantially present (Fig. 2f), suggesting that the particles are stabilising it against dissolution. As the sample is being sheared there is a tendency for the particles to aggregate and at much longer times, 900 s, the defect structure anneals out leaving an almost perfectly aligned sample in particle-free regions. Similar behaviour was observed for a system doped with 19m silica particles. The detailed mechanism for the decay of the network is unclear, as remarked above, and so therefore is the reason for its stabilisation. We will, however, offer some speculations on this subject below.
IV Viscoelastic properties of the sheared lamellar phase, and the effect thereon of particulate additives
A Shear-treatment and rheometry without particles
Our aim is to correlate the visualisation studies of section III with the mechanical properties of the lamellar phase. Accordingly, we try to reproduce as far as possible the shear-treatment conditions of section III and study its effects on the rheometry. The rheometry was carried out in a parallel-plate geometry†††While this geometry has a nonuniform shear rate, we prefer it to the (viscometric) cone-and-plate geometry because the wedge-shaped cross-section of the latter generates a tilt grain boundary. In addition, there is the danger of particles getting stuck in the narrow gap near the cone center. with a gap of 100m and plate diameter 4 cm. , the shear-rate of shear-treatment referred to in all our rheometric studies, is defined at the outer rim of the parallel-plate geometry.
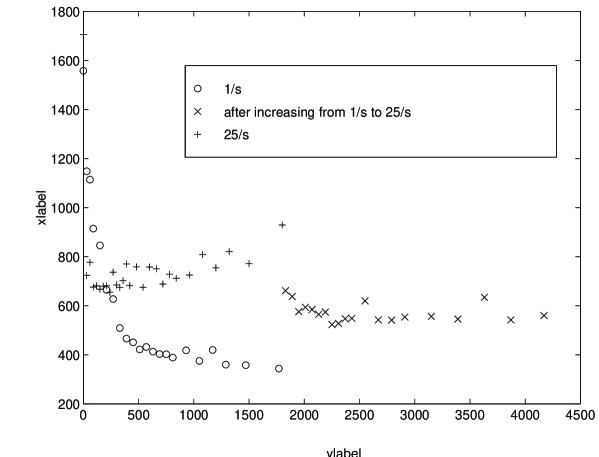
In the absence of added particles, we subject the lamellar-phase samples to steady shear for a time , stop and measure the small-amplitude‡‡‡strain amplitude of 5 10-3; data for smaller amplitudes were too noisy dynamic moduli over a wide frequency range, resume shearing, and repeat this procedure for a total shearing time of upto an hour and a half. In some cases, we sheared at 1 s-1 for half an hour before increasing the shear-rate to 25 s-1, measuring dynamic moduli as before. (While we observed variation of up to 10% in the dynamic modulii between samples, the qualitative features and trends remained unchanged.) The results of this procedure, summarised in Figs. 3 to 9, are as follows: (i) The samples initially had , of about 1500 Pa and 400 Pa respectively at rad/sec. At any given shear-rate (ranging from 1 to 50 s-1), the values of and at fixed show a general tendency to decrease with time, settling down to a steady-state value at long times, as seen in Figs. 3 and 4.
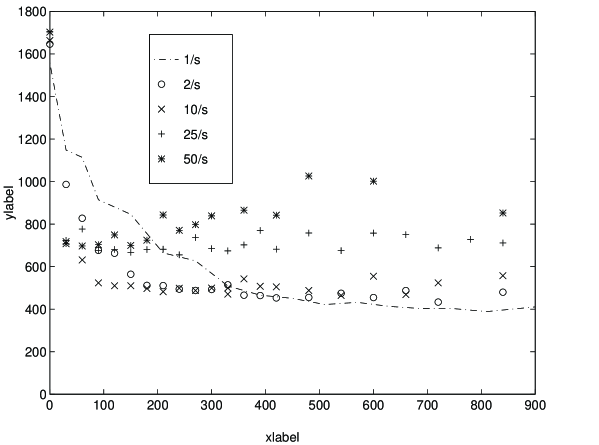
The decrease is not monotone, nor is the steady state truly steady; there are slow oscillations or even a tendency for the moduli to increase at long times. We suspect the origin of the oscillations is in the small sample thickness (m), or in irregularities introduced by flow startup. The long-time increase may be a result of the working-in of defects by shear. As mentioned in section III, the video clips do show the formation of a grid-like pattern in the initially homeotropic region as the sample is being sheared. This may contribute to the long-time increase in the moduli.
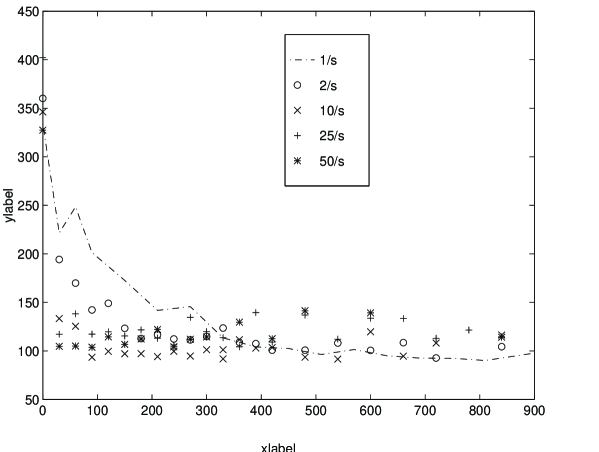
(ii) The lower the imposed shear-rate, the lower the steady-state values of and (at the reference frequency of 2 rad/s). (iii) The overall shapes of the rheometric spectra and (Figs. 5 and 6) remain invariant under shear-treatment, although the magnitudes of the moduli, as well as the frequency locations of specific features depend on the duration and shear-rate of the shear-treatment. The spectrum has roughly a form at large and is rather flat at small , suggesting the presence of a very large intrinsic time scale in the system [15]. The origin of this long time scale, as in many soft and ill-characterised solids, remains unclear [10, 3, 16]. A similar variation in the frequency response of under shear treatment has been observed in block copolymers by Riise et al. [17].
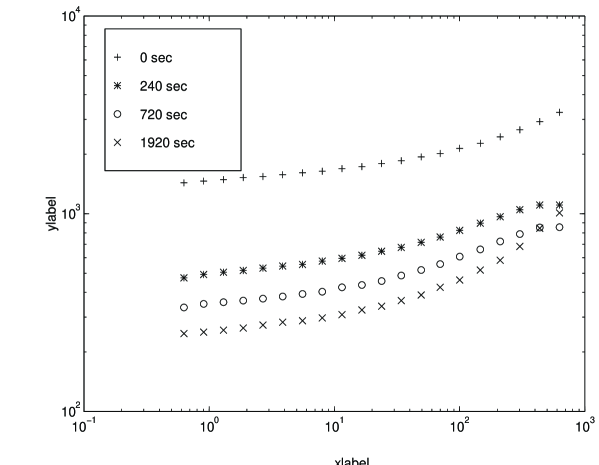
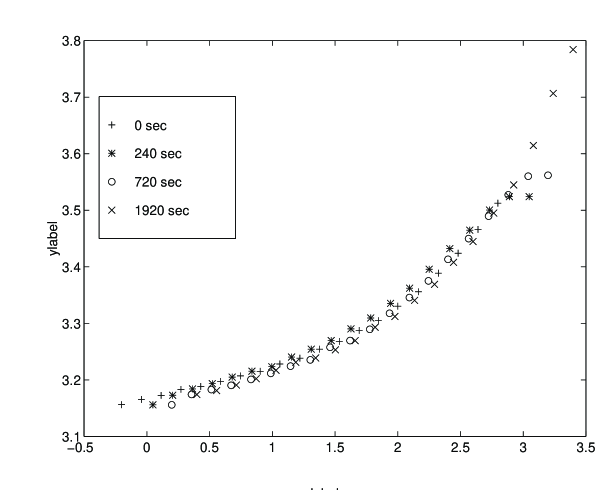
(iv) The curves for different durations of shear-treatment can be made to collapse onto the (no shear-treatment) curve (Fig. 7) if log() is plotted against log(), where and are, respectively, a reference modulus and a characteristic frequency that shift. We find that both and decrease monotonically (Fig. 8) as increases. This is pleasingly consistent with the idea of an elasticity arising from a coarsening defect network (see the discussion in section V). We emphasize that the functions and are unique only upto arbitrary multiplicative factors, as the data collapse can be achieved if the and for no shear-treatment are multiplied by the same respective factors. For reasons we do not understand, however, the data on do not show a satisfactory collapse.

(v) After shearing at 1 s-1 for about 30 minutes, reaching a quasisteady of about 400 Pa, the shear-rate was increased abruptly to 25 s-1. It can be seen from Fig. 9 that picks up rapidly, showing a tendency to climb back to the value that it would have had if sheared directly at 25 s-1. Thus, shear on the one hand reduces an initially high modulus, but is equally capable of increasing an initially low modulus. Despite some apparent history-dependence, we speculate that shear-treatment imposed for a long enough time does produce a structure with a well-defined dynamic-modulus spectrum depending only on the value of the shear-rate. We propose to study the rheological response to small oscillations about the steady flow, not by stopping the flow, which inevitably introduces artifacts. Linear response about steady flow is the true measure of the properties of the nonequilibrium steady state we are studying, namely the sheared lamellar phase.
To compare the rheometry with the light microscopy we have measured the transmitted light intensity as a function of shear time (Fig. 10). Since homeotropically aligned regions appear dark, this measures the density of defects. As seen in the figure, the decay of the transmitted intensity is in clear qualitative agreement with the decrease in the storage modulus under similar conditions of shear treatment (m , s-1), supporting the conjecture that the elasticity arises primarily from the defect network. A similar correlation has been noted by Larson et al.[5] in thermotropics.

B Rheometry with particles
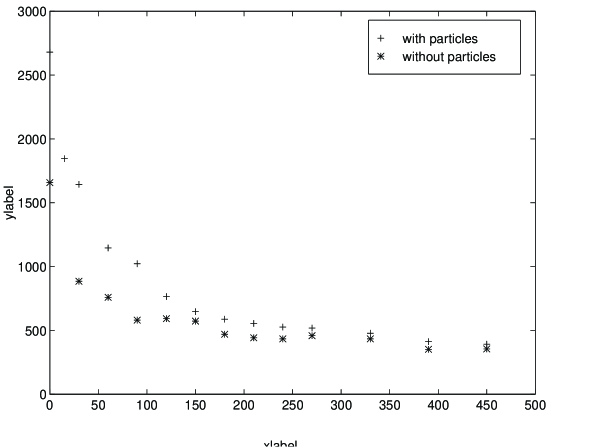
The effect of particulate additives on the viscoelastic properties was studied by adding monodisperse polystyrene + 30% polybutylmethacrylate spheres (9.55 0.44 m diameter, 0.5 % volume fraction ) to the lamellar phase sample. The storage modulus is consistently higher in the presence of particles (Fig. 11) but approaches that of a particle-free sample at the longest times ( 10 min). A similar trend is observed for (Fig. 12), although the data has more scatter. As mentioned in section III, the particles tend to coagulate at very long times, and the anchoring of the defect network is lost; this too is in keeping with the ultimate decrease of the moduli to those of the particle-free sample. The variation in the dynamic modulii between samples was greater in the presence of particles than without, roughly 20%, though part of it could be attributed to the difficulty in maintaining a constant particle concentration in all samples, but all the trends were reproducible.
V Summary and analysis
Our video microscopy studies have shown that sheared lyotropic lamellar phases display a striking defect network structure made up of oily streaks. These defects anneal away slowly under shear treatment, by a route which appears to be the thinning and disappearance of lines. The addition of a small concentration of suspended particulate impurities greatly retards the decay of this defect network. Previous studies of particulate additives in a lyotropic gel system showed a large increase in the rigidity modulus [1]. It was conjectured there that surfactant molecules adsorb on the particles, resulting in direct interparticle bridges and stress transmission. The oily streak network we observe is a far more likely candidate for such a stress-transmitting structure.
We present a rough theoretical estimate of the rigidity of the network. As in [9]. we argue that a network of oily-streak lines with mesh size and tension should have a shear modulus . The value of depends on the internal structure of the oily streaks. Our images of the oily-streak network (Fig. 2a, for example, or other images not presented in the paper) clearly show the presence of focal domain arrays. We thus estimate the line tension using the model of [7] rather than the striated dislocation line pairs of [12], and find reasonable agreement with our measurements. In the focal domain model [7], there are two contributions to the line energy: a mean-curvature energy piece logarithmic in the width of the streak, and a major contribution from layer compressions in a narrow region interpolating between the domains and the bulk undistorted layering. The curvature term turns out to be negligibly small here, and we shall ignore it. For an isolated oily streak in a sample of thickness , the compression energy is found [7] to be of the form
| (1) |
times a geometrical factor of order unity. Here is the layer compression modulus at constant chemical potential of surfactant, and and are respectively the eccentricity and major axis of the ellipses constituting the domains. In a network of oily streaks, as distinct from an individual streak, we expect this dependence on the thickness to be screened at the scale of the mesh size , i.e., should be replaced by in (1). Our observations suggest to , to m, and m, giving an energy per unit length to and hence a contribution to the shear modulus which scales with but is much smaller in magnitude than the layer compression modulus: to . For Pa, this gives to Pa, which is in the right range. The fifth power in (1) does of course make this estimate rather sensitive to the precise values of the parameters involved.
While the modulus of an initially defect-ridden state decreases substantially with shear-treatment, the data for the frequency-dependent storage modulus after different amounts of shear-treatment can be scaled onto a single curve, Fig. 7. This data collapse can be rationalised as follows: At each stage of the shear-treatment, the network has a mesh size , a characteristic inverse timescale (the relaxation rate of structures at the scale ), and a characteristic modulus (the shear modulus of an elementary cell of the network). It is natural to assume that decreases as increases, since a coarser mesh should relax more slowly, and that , where is the line tension. This suggests a frequency-dependent shear modulus , which should account for the data collapse provided either does not evolve under coarsening or else evolves in a manner determined entirely by . The scaling is thus quite easily understood in the focal domains model [7], in which is independent of the thickness of the lines for a coarse network (see our estimates in the previous paragraph)§§§In the dislocation model [12, 7], however, depends on the Burgers-vector content of the line, i.e., on its thickness, and will thus decrease as increases, since our oily streaks appear to thin under shear treatment. We do not consider this case here since our images show the focal domains of [7]..
Although the shear modulus of an initially highly rigid (and therefore presumably very defect-ridden) state decreases gradually with time as the state is sheared steadily, an initially low-modulus state (produced by shear-treatment at low rates) becomes more rigid upon shearing at a high rate. This tells us that the observed steady-state defect structure is the result of a competition between the working-in and the working-out of defects by shear. We conjecture that there is a unique structural and rheological state associated with a given shear-rate rather than a given shear-history. The data does show some history-dependence, but we suspect that this is a transient. Indeed, it would be most appropriate to study the properties of the sheared lamellar phase not by stopping the flow but rather by treating it as a nonequilibrium steady state, and measuring its linear rheological response to a small oscillatory component superposed on the steady shear. We are currently pursuing such studies.
Acknowledgement
We thank Prof A. K. Sood for extensive access to imaging facilities, and R. Adhikari for useful discussions. Partial funding for this project, including a Project Associateship for GB, came from Unilever Research India.
REFERENCES
- [1] V. Shouche, D. K. Chokappa, V. M. Naik, and D. V. Khakhar, J. Rheol., 38:1871, 1994.
- [2] R. G. Larson et al., Rheol. Acta, 32:245, 1993.
- [3] D.M.A. Buzza, C.-Y.D. Lu, and M.E. Cates, J. Physique II, 5:37, 1995.
- [4] O. Diat, D. Roux, and F. Nallet, J. Phys. II, 3:1427, 1993.
- [5] R. G. Larson and P. T. Mather, Theoretical challenges in the Dynamics of Complex Fluids, Nato ASI Series E v. 339, Kluwer, 1997.
- [6] C. Meyer, S. Asnacios, C. Bourgaux, and M. Kléman, Proc. XVII Int. Liq. Crys. Conf., to appear.
- [7] P. Boltenhagen, O. Lavrentovich, and M. Kléman, J. Phys. II, 1:1233, 1991.
- [8] M. Kléman, Points, Lines, and Walls in Anisotropic Fluids and Ordered Media. Wiley, Chichester, 1983.
- [9] M. Zapotocky, L. Ramos, P. Poulin, D.A. Weitz, and T.C. Lubensky, Science, 283:209, 1999.
- [10] K. Kawasaki and A. Onuki, Phys. Rev. A, 42:3664, 1990.
- [11] R. G. Larson and D. W. Mead, Liquid Crystals, 12(5):751, 1992.
- [12] M.B. Schneider and W.W. Webb, J. Physique, 45:273, 1984.
- [13] P. Oswald and S. I. Ben-Abraham, J. Physique, 43:1193, 1982.
- [14] N.H. Hartshorne and A. Stuart, Crystals and the Polarising Microscope. Edward Arnold Press Ltd. London, 1970.
- [15] H. A. Barnes, J. F. Sutton, and K. Walters, An Introduction to Rheology. Elsevier, 1993.
- [16] A.J. Liu, S. Ramaswamy, H. Gang, T. Mason, and D.A. Weitz, Phys. Rev. Lett., 76:3017, 1996.
- [17] B. L. Riise, H. Glenn, H. Frederickson, R. G. Larson, and G. S. Pearson, Macromolecules, 28:7653, 1995.