Charge stripes seen with x-rays in
Abstract
Superstructure reflections due to the ordering of holes into stripes in have been studied with high energy x-ray diffraction. These reflections have been observed clearly for the first time in a sample which is superconducting at low temperatures ( K). The stripe peaks vanish above 62(5) K whereas the magnetic signal of the stripe ordering which has been seen with neutrons before is already suppressed at K. Our results confirm that the ordering of spins and holes is driven by the charges as it is found in the case of La1.6-xNd0.4SrxCuO4 at the doping level of .
PACS 61.10.Nz;74.72.Dn
I Introduction
The ordering of holes and spins into stripes in the CuO2-planes of Nd-doped La2-xSrxCuO4 (LSCO) has attracted much attention, because charge separation and antiferromagnetic spin fluctuations are believed to be important for understanding the mechanism of high temperature superconductivity. The idea of pinned stripes in the low temperature tetragonal (LTT) phase of Nd-doped LSCO or La2-xBaxCuO4 [1, 2] provides an explanation for the anomaly observed at , where superconductivity is destroyed, or at least strongly suppressed [3, 4, 5, 6]. The tilting of the oxygen octahedra along the and directions (i.e., parallel to Cu–O bonds) in the LTT phase introduces a pinning potential for horizontal and vertical stripes, whereas in the low temperature orthorhombic (LTO) phase it is absent due to the rotation of the tilting axis into the direction.
In a single crystal of La1.48Nd0.4Sr0.12CuO4, neutron diffraction allowed the observation of both magnetic and charge-ordering superstructure reflections [1]. Consistent with the idea of pinning by the LTT lattice modulation, static stripe ordering within the CuO2 planes appears at the transition temperature from the LTO to the LTT phase, which is . From the positions of the superlattice peaks and the nominal hole concentration it follows that stripes of holes are approximately half-filled, and act as antiphase domain walls with respect to the antiferromagnetically ordered Cu spins. Thus, a Sr doping level of yields a spacing between stripes of , where is the lattice constant. High energy x-ray studies have been succesful in confirming the results for the charge stripe ordering in an sample [7].
It is still an open question as to whether charge stripes are limited to hole concentrations near in Nd-doped LSCO or whether they influence the physics of cuprate superconductivity in general, but there is accumulating evidence for the latter. Inelastic neutron scattering experiments indicate the possibility of moving, fluctuating stripes in LSCO [8, 9] and even in YBCO [10, 11]. Local charge ordering in La2-xSrxCuO4 with is suggested by a recent nuclear quadrupole resonance (NQR) study [12]. It is interesting to imagine that dynamic stripe correlations might be necessary for superconductivity [13], whereas pinning the stripes leads to a strongly reduced critical temperature , but the experimental evidence for such a scenario is still incomplete. So far the Nd-doped LSCO system offers a unique opportunity to study pinned stripe patterns in diffraction experiments, giving information about the nature of charge and spin ordering.
The superstructure reflections due to the ordering of holes are shifted by in - or -direction relative to fundamental reflections, whereas the magnetic peaks are located around the antiferromagnetic peak position , shifted by also in - or -direction. In neutron scattering experiments, the splitting has been observed to increase slightly as the Sr content increases from 0.12 to 0.15 and 0.20, implying a decrease in the average stripe spacing; however, it has only been practical to study the superstructure reflections due to the antiferromagnetic ordering [14]. It is now imperative to directly characterize the charge order at Sr concentrations away from .
In this work we present x-ray studies with 120 keV photons on . Our results are in complete agreement with the stripe model and complementary to the experimental evidence of antiferromagnetic stripe ordering in this sample [14]. As observed in the case [1], the superstructure reflections due to the ordering of the holes sets in at a higher temperature compared to the magnetic signal, indicating that the transition into the stripe phase is driven by the charge separation [15].
II Experiment
The experiments have been performed on the triple-axis diffractometer designed for the use of keV photons at the high-field wiggler beamline BW5 at HASYLAB, Hamburg [16]. X-ray diffraction in this energy range has proven to be very successful in studying charge ordering in cuprates, nickelates and manganates [7, 17, 18]. As in neutron scattering experiments, the large penetration depth ( mm) allows one to probe the bulk of the sample, enabling a direct comparison of x-ray and neutron diffraction data. In contrast to former experiments on [7], the Si/TaSi2 monochromator and analyzer crystals have been replaced by the new Si1-xGex gradient crystal material. These crystals show very high reflectivity values of 96% (not corrected for absorption) and variable widths of the rocking curves depending on the Ge content [19, 20]. By use of this new material, the scattered intensity at the stripe peak positions in Nd doped LSCO is about four times higher compared to the results obtained previously with the utilization of crystals as monochromator and analyzer [21]. Figure 1 shows a comparison of a superstructure reflection measured with the and Si1-xGex gradient crystals. The count rate collected with the gradient crystals is nearly two times higher, and a slightly better signal to background ratio could be reached by reducing the beam spot on the sample, i.e. by probing only the center of the crystal. The lower curve has been measured with the crystals, illuminating a two times larger sample volume.
In this experiment 120 keV photons have been employed, with a monochromatic beam intensity of photons/. The resolution (FWHM) at a (2,0,0) reflection of was 0.020 Å-1 in the longitudinal and 0.0014 Å-1 in the transverse direction, the latter being limited by the sample mosaicity. At smaller diffraction angles the longitudinal resolution improves because the diffraction geometry becomes less dispersive, e.g. the FWHM of the (1,1,0) reflection is 0.011 Å-1. A closed-cycle cryostat has been utilised and temperatures between 9 K and 300 K could be reached at the sample position. The studied crystal ( mm3) is a piece of a cylindrical rod that was grown by the travelling-solvent floating-zone method.
III Results
Previous hard x-ray diffraction experiments on a crystal have shown that the stripe peaks are displaced not only within the plane, but also in the direction [7]. Due to the better resolution in reciprocal space compared to neutron scattering experiments it has been possible to find a modulated intensity of the stripe peaks along the -direction with maxima at , indicating a correlation of the charge stripes in next-nearest-neighbor layers along the -axis. The highest scattering intensities for the stripe peaks are expected at the positions and . Figure 2 clarifies the positions of the stripe peaks in reciprocal space relative to the CuO2 planes. We have used the tetragonal unit cell with Å, Å.
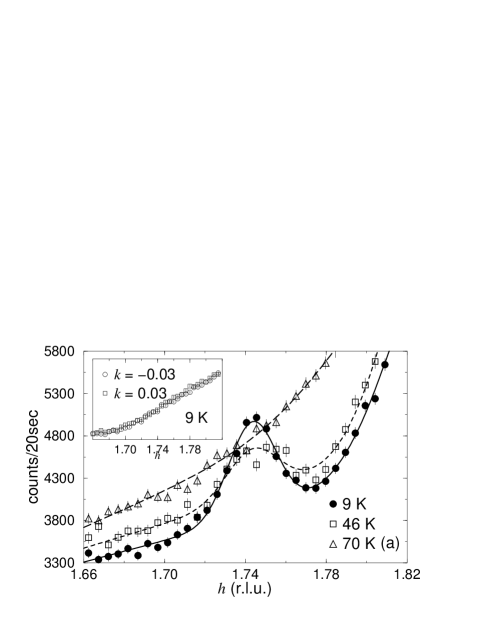
Longitudinal scans along are shown in Fig. 3. As anticipated, small superstructure reflections are observed at with . The peaks that are present at K have disappeared after raising the temperature to 70 K. The signal to background ratio is for the reflection and at the position. In both scans the background rises due to the vicinity of the (2,0,0) reflection. At this fundamental Bragg reflection the count rate in the peak maximum is about times larger than in the stripe peaks.
The curves through the data points in Fig. 3 are least-squares fits. In both (a) and (b) the charge-order peaks are modelled with a Gaussian. The background in (a) is approximated by the tail of a second Gaussian centered near plus a linear contribution, while only a linear background is used in (b). Usually, the tail of a fundamental reflection is Lorentzian shaped, but nevertheless it is possible that locally other functions are a better approximation to a non-linear background, since the shape of the background is related to the sample quality. The studied crystal with Sr and Nd as dopants on the La-site certainly incorporates defects and strain which are responsible for the rather high background, which is photons per second at the superlattice positions.
In the inset of Fig. 3(a), two more low-temperature longitudinal scans, slightly shifted in the -direction, are displayed. The absence of any peaks in these scans indicates that the peak found at is narrow in . This conclusion is confirmed by the 9 K transverse scan shown in Fig. 4. The background in the transverse scans is linear, and a fit of the stripe peak with a Lorentzian is slightly more successful than utilizing a Gaussian. From the present data, it is difficult to determine the true peak shape, given the small signal-to-background ratio.
Figure 5(a) shows the temperature variation of the amplitudes of the and scans at the position. With rising temperature the amplitudes decrease rather linearly; the peak vanishes at 62(5) K, which is K below the structural transition from the LTT into the LTO phase. The intensity of the (3,0,0) reflection, also shown in Fig. 5(a), is a measure of this transition because it only occurs in the LTT phase. From the longitudinal and transverse scans a FWHM of 0.028(5) r.l.u. can be inferred, resulting in a correlation length of 43(8) Å. The change of the peak widths with temperature can be seen in Fig. 5(b). Up to K it is rather constant, but above this temperature the width of the peak in - and -directions increases considerably. Note that the increasing width as well as the vanishing peak intensity are not directly connected to the structural transition from the LTT into the LTO phase, but occur at a remarkably lower temperature.
IV Discussion
Our x-ray results provide direct evidence for charge-stripe order in . Such charge order had previously been inferred from the magnetic order observed by neutron scattering [14]. This is an important result, because high-field magnetization [22] and muon-spin-rotation (SR) [23] studies have indicated that bulk superconductivity also exists in this sample. Another conclusion of the SR study is that static magnetic order is present throughout essentially the entire sample volume. Thus, it appears that stripe order and superconductivity coexist intimately at .
Compared to the composition, both the charge ordering temperature and the superstructure peak intensities are reduced. The superlattice intensities [normalized to the (200) peak] are roughly 30% weaker in relative to . A similar reduction in magnetic ordering temperature and intensity have been observed previously. At both Sr concentrations, charge ordering appears at a higher temperature than magnetic order.
Within the error bars the correlation length of the stripe order in the sample is the same as in the sample, and in both samples the correlation length of the stripes is constant over a large temperature range. In contrast to this finding, it is important to note that neutron scattering and muon-spin rotation experiments revealed that the spins are only quasi-static, with a decreasing correlation length, in the temperature range above 30 K in the sample [23, 24]. This continuous loss of correlation is only observed in the magnetic signal, whereas the correlation length for the charge order shows a decrease only very close to the disordering temperature. The temperature range in which a residual signal with an increased width is observed can be interpreted with fluctuating stripes, since the detected signal in our x-ray diffraction experiment is a sum of elastic and inelastic contributions.
One might conclude that fluctuations of stripes set in if the pinning potential in the LTT phase is destroyed at the structural transition from LTT to LTO, as observed in the x = 0.12 sample, or if rising temperature competes with a pinning potential via thermal activation. In the sample with , the second possibility holds, since the suppression of the stripe ordering is not connected to the structural transition. The pinning potential is smaller in the sample than in the sample because the tilting angle of the oxygen octahedra is reduced with increasing Sr content in Nd doped LSCO [5].
On the other hand, the idea that the LTT structure is required for charge-stripe order is challenged by the interpretation of the Cu NQR results in LSCO by Hunt et al. [12]. That work suggests that static stripes can occur even within the LTO phase, and that the ordering temperature continues to increase as decreases below 0.12. As an initial test of this picture, we intend to study charge order in a Nd-doped crystal with in the near future.
To summarize, we have been successful in validating the existence of stripe
order in
, a sample which is superconducting
below K. Charge-order peaks due to stripe ordering have been observed
at , , and at
. The value of
0.256(1) is in very good agreement with neutron scattering results for the
magnetic peaks. This is a further step in establishing the picture
of static stripes in Nd doped LSCO.
The intensity of the stripe signal decreases almost linearly with
rising temperature and vanishes at 62(5) K, K below the structural
transition from the LTT to the LTO phase.
The formation of the stripe pattern in
is less pronounced than in
.
Acknowledgements:
Work at Brookhaven is supported by
Contract No. DE-AC02-98CH10886, Division of Materials Sciences, U.S.
Department of Energy.
REFERENCES
- [1] J. M. Tranquada, B. J. Sternlieb, J. D. Axe, Y. Nakamura, S. Uchida, Nature 375, 561 (1995); J. M. Tranquada, J. D. Axe, N. Ichikawa, Y. Nakamura, S. Uchida, and B. Nachumi, Phys. Rev. B 54, 7489 (1996).
- [2] J. D. Axe, A. H. Moudden, D. Hohlwein, D. E. Cox, K. M. Mohanty, A. R. Moodenbaugh, and Y. Xu, Phys. Rev. Lett. 62, 2751 (1989).
- [3] A. R. Moodenbaugh, Y. Xu, M. Suenaga, T. J. Folkerts, and R. N. Shelton, Phys. Rev. B 38, 4596 (1988).
- [4] M. K. Crawford, R. L. Harlow, E. M. McCarron, W. E. Farneth, J. D. Axe, H. Chou, and Q. Huang, Phys. Rev. B 44 7749 (1991).
- [5] B. Büchner, M. Breuer, A. Freimuth, and A. P. Kampf, Phys. Rev. Lett. 73, 1841 (1994).
- [6] A. R. Moodenbaugh, L. H. Lewis, and S. Soman, Physica C 290, 98 (1997).
- [7] M. v. Zimmermann, A. Vigliante, T. Niemöller, N. Ichikawa, T. Frello, J. Madsen, P. Wochner, S. Uchida, N. H. Andersen, J. M. Tranquada, D. Gibbs, J. R. Schneider, Europhys. Lett. 41, 629 (1998).
- [8] S-W. Cheong, G. Aeppli, T. E. Mason, H. Mook, S. M. Hayden, P. C. Canfield, Z. Fisk, K. N. Clausen, and J. L. Martinez, Phys. Rev. Lett. 67, 1791 (1991).
- [9] K. Yamada, C. H. Lee, K. Kurahashi, J. Wada, S. Wakimoto, S. Ueki, H. Kimura, Y. Endoh, S. Hosoya, G. Shirane, R. J. Birgenau, M. Greven, M. A. Kastner, Y. J. Kim, Phys. Rev. B 57, 6165 (1998).
- [10] P. Dai, H. A. Mook, F. Doǧan, Phys. Rev. Lett. 80, 1738 (1998).
- [11] H. A. Mook, P. Dai, S. M. Hayden, G. Aeppli, T. G. Perring, and F. Doğan, Nature 395, 580 (1998).
- [12] A. W. Hunt, P. M. Singer, K. R. Thurber, T. Imai, cond-mat/9902348.
- [13] V. J. Emery, S. A. Kivelson, and O. Zachar, Phys. Rev. B 56, 6120 (1997).
- [14] J. M. Tranquada, J. D. Axe, N. Ichikawa, A. R. Moodenbaugh, Y. Nakamura, S. Uchida, Phys. Rev. Lett. 78, 338 (1997).
- [15] O. Zachar, S. A. Kivelson, and V. J. Emery, Phys. Rev. B 57, 1422 (1998).
- [16] R. Bouchard, D. Hupfeld, T. Lippmann, J. Neuefeind, H.-B. Neumann, H. Poulsen, U. Rütt, T. Schmidt, J.R. Schneider, J. Süßenbach, M. v. Zimmermann, J. Synchrotron Rad. 5, 90 (1998).
- [17] A. Vigliante, M. v. Zimmermann, J. R. Schneider, T. Frello, N. H. Andersen, J. Madsen, D. J. Buttrey, D. Gibbs, J. M. Tranquada, Phys. Rev. B 56, 8248 (1997).
- [18] T. Niemöller, M. v. Zimmermann, S. Uhlenbruck, O. Friedt, B. Büchner, T. Frello, N. H. Andersen, P. Berthet, L. Pinsard, A. M. De Léon-Guevara, A. Revcolevschi, J. R. Schneider, European Phys. J. B, 8, 5 (1999).
- [19] S. Keitel, C. C. Retsch, T. Niemöller, J. R. Schneider, N. V. Abrosimov, S. N. Rossolenko, H. Riemann, Nucl. Inst. M. A 414, 427 (1998).
- [20] S. Keitel, C. Malgrange, T. Niemöller, J. R. Schneider, submitted to Acta. Cryst. A.
- [21] S. Keitel, T. Lippmann, HASYLAB Annual Report 1998, 46 (1999).
- [22] J. E. Ostenson, B. Bud’ko, M. Breitwisch, D. K. Finnemore, N. Ichikawa, and S. Uchida, Phys. Rev. B 56, 2820 (1997).
- [23] B. Nachumi, Y. Fudamoto, A. Keren, K. M. Kojima, M. Larkin, G. M. Luke, J. Merrin, O. Tchernyshyov, Y. J. Uemura, N. Ichikawa, M. Goto, H. Takagi, S. Uchida, M. K. Crawford, E. M. McCarron, D. E. MacLaughlin, R. H. Heffner, Phys. Rev. B 58, 8760 (1998).
- [24] J. M. Tranquada, N. Ichikawa, S. Uchida, Phys. Rev. B (June 1, 1999).