Depletion forces near curved surfaces
Abstract
Based on density functional theory the influence of curvature on the depletion potential of a single big hard sphere immersed in a fluid of small hard spheres with packing fraction either inside or outside of a hard spherical cavity of radius is calculated. The relevant features of this potential are analyzed as function of and . There is a very slow convergence towards the flat wall limit . Our results allow us to discuss the strength of depletion forces acting near membranes both in normal and lateral directions and to make contact with recent experimental results.
pacs:
82.70.Dd, 61.20.Gy, 68.45.-vMany biological processes are controlled by the interactions of macromolecules with cell membranes. Besides highly specific interactions of steric and chemical nature there are also entropic force fields which are omnipresent but whose actions depend only on gross geometrical features. These so-called depletion forces arise because both the membranes and the macromolecules generate excluded volumes for the small particles forming the solvent. Although these forces have been discussed for biological systems for many years [1], the simultaneous presence of many other forces severely impedes the precise analysis of depletion forces in such systems. Therefore it is highly welcome that dissolved colloidal particles can be tailored such that they resemble closely the effective model of monodispersed hard spheres confined by hard walls [2]. This allows one to study the depletion forces exclusively and to compare them quantitatively with theoretical results. Once a satisfactory level of understanding has been reached for these model systems one can apply with confidence this knowledge to the much more complex biological systems. Moreover, in colloidal suspensions themselves depletion forces can be exploited to organize self-assembled structures [3]. This dedicated use requires a detailed knowledge of the mechanisms of depletion forces, too.
Along these lines in recent years there has been significant progress in understanding the depletion forces between two big spheres and between a single big sphere and a flat wall based on experiments [4, 5, 6, 7, 8, 9], analytic results [10, 11, 12, 13], and simulations [14]. A generic feature of membranes is, however, that they are not flat. The variation of the local curvature leads to a new quality of the depletion forces in that they are no longer directed only normal to the surface, as for a flat wall or a wall with constant curvature, but that there is also a lateral component which promotes transport along the membrane. So far there are no systematic theoretical studies available which accurately predict this important curvature dependence of the depletion forces. Based on the quantitatively reliable density functional theory developed by Rosenfeld [15] we compute the depletion potential for a big sphere of radius either inside or outside of a spherical cavity with radius , filled with a solvent of hard spheres of radius , as function of and of the packing fraction of the small spheres defined as the fraction of the total volume occupied by the small spheres[16]. This enables us to make contact with a recent experiment in which the curvature dependence of depletion forces has been investigated by monitoring colloidal particles enclosed in vesicles [17].
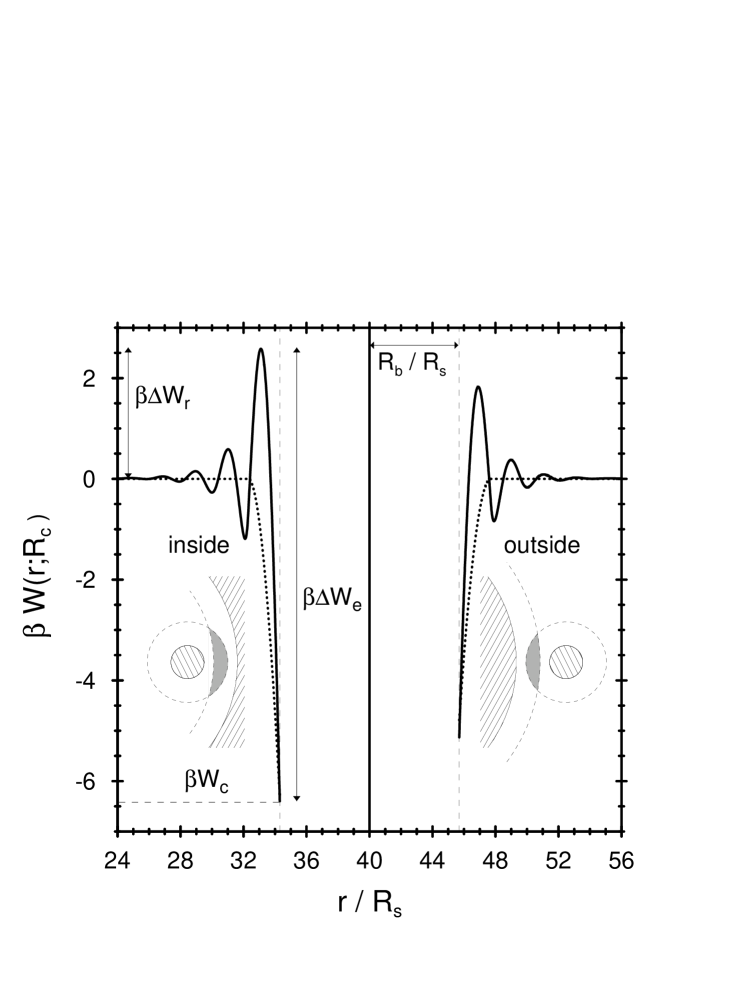
Figure 1 shows our results for the depletion potential in units of inside and outside of a hard spherical cavity centered at . Here is the difference of the grand canonical free energies of the hard sphere solvent in the presence and absence, respectively, of a big hard sphere whose center is fixed at a distance from the center of the cavity. The choice of the parameters corresponds to those of the experiment in Ref. [17]. The solid line denotes the actual depletion potential compared with its so-called Asakura-Oosawa approximation (AOa) [18] (dotted line) which is valid only for such small values of that the solvent can be treated as an ideal gas and which is determined by the overlap of the excluded volumes around the big sphere and the hard wall. The AOa, which has been used to interpret the experimental data in Ref. [17], satisfactorily predicts the value of the depletion potential at contact and its derivation with respect to , but otherwise it fails considerably. Whereas is purely attractive and vanishes for , the actual potential is both attractive and repulsive with the wavelength of the oscillations approximately given by . The correlation effects of the solvent generate the potential barrier (see Fig. 1) which is completely missing within the AOa, and they increase the range of the potential significantly beyond the AOa range of . The presence of this potential barrier has very pronounced repercussions for the diffusion dynamics of the big particle. The time required to overcome a potential barrier is proportional to . Therefore, with , for the big sphere it takes about times longer to reach the wall from the center of the cavity or to escape from the wall as compared with the time estimated from the AOa (see Fig. 1). This difference still awaits experimental confirmation. For larger packing fractions this difference becomes even larger. Thus the value of the depletion potential at contact can be obtained from the ratio of rates of escaping from the wall and reaching it, respectively. Taking into account only the former one, as suggested by the AOa, would be misleading. The overall structure of the depletion potential outside of the cavity is similar to the one inside, but its amplitude is reduced (Fig. 1). This is in line with the trend predicted by the AOa which expresses the fact that the overlap between the excluded volumes around a big sphere and the wall is larger inside the spherical cavity than outside. This geometrical difference between the excluded overlap volume inside and outside of the cavity is schematically drawn as inset in Fig. 1. In the inset the boundaries of the excluded volumes around the big sphere and the cavity wall are indicated by dashed lines and the overlap of excluded volumes is shaded.
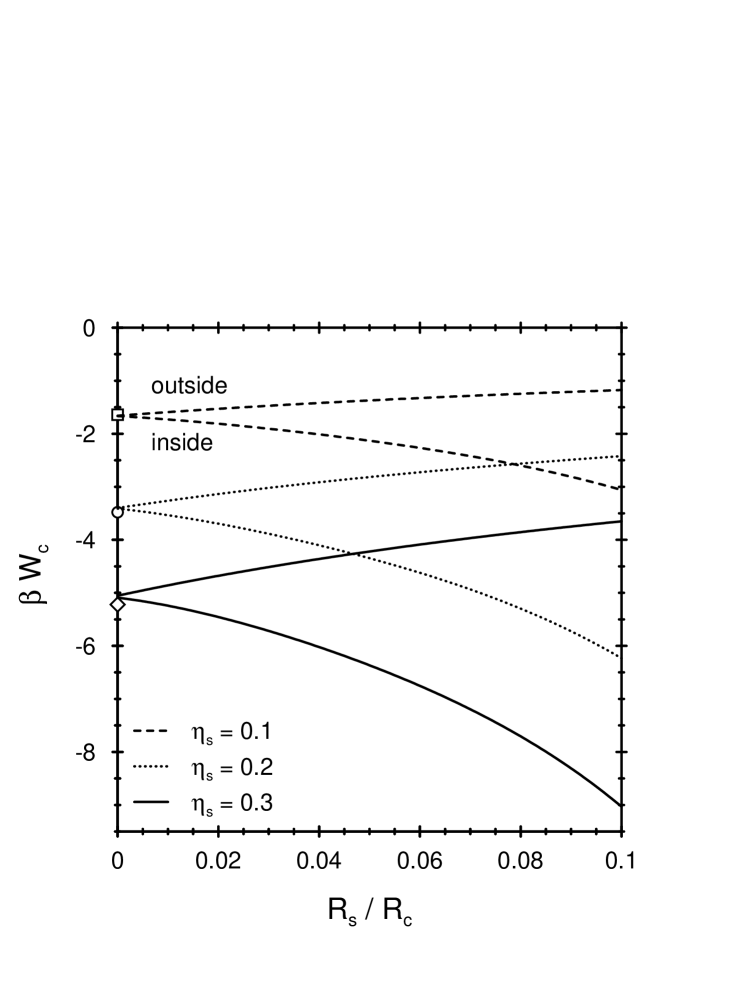
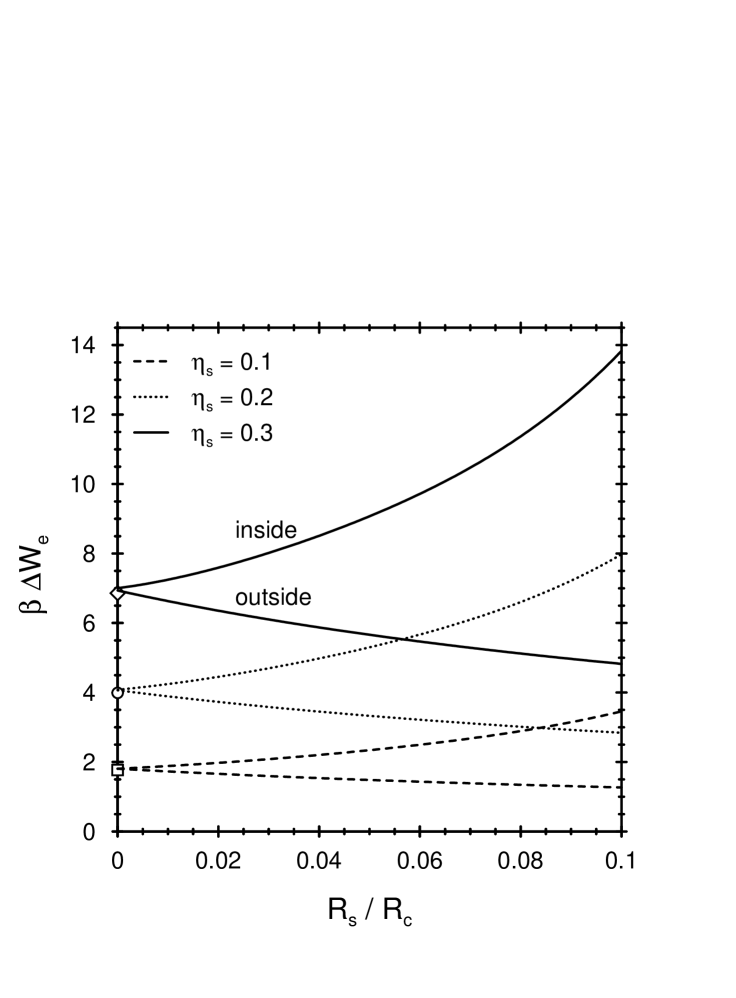
In Figs. 2 and 3 we discuss as function of the packing fraction the relevance of the cavity curvature for the depletion potential relative to the case of a planar wall, i.e., by focusing on the potential at contact and the escape potential barrier , respectively. As expected in the limit both quantities reach a common value for the outside and inside potential. These common values are in very good agreement with simulation data for the planar wall [14]. For all values of the absolute values of the potential parameters inside are lager than outside. They increase stronger than linearly with increasing . For increasing curvature the outside potential becomes weaker whereas the inside potential becomes much stronger; this holds for all values of . The gain of strength of the inside potential upon increasing the cavity curvature is much more pronounced than the corresponding loss of strength on the outside. This difference between the behavior inside and outside widens strongly with increasing . The dependence of the depletion potential on the cavity curvature is surprisingly strong even for large values of . For and the density profile of the solvent without the big sphere near the curved wall differs only slightly from that near a flat wall; its contact value differs by from the corresponding flat one. However, the potential at contact still differs by almost from the corresponding flat value. This amplification of the influence of the curvature can be understood in terms of the geometric considerations of the overlap volumes leading to
| (1) |
with and and for outside and inside, respectively. Within AOa the absolute value of the amplitude of the first curvature correction is the same inside and outside as can be seen from
| (2) |
For , i.e., the curvature dependence of is significantly enhanced.
In a recent experiment [17] Dinsmore et al. used video microscopy to monitor the position of a single big colloid particle with immersed in a solution of small colloids with inside a vesicle. These were charge stabilized colloids which are supposed [17] to resemble closely the model system of hard spheres confined by a hard wall. From the probability of finding the big colloid at the position – the quantity actually measured in the experiment – one can infer the depletion potential according to with in the bulk. Thus the spatial resolution of the experimentally determined reflects that of , which at best was approximately in Ref. [17]. In the experiment the big colloid particle was observed to be most of the time very close to the vesicle wall inside a shell whose width was chosen to be , i.e., even larger than the optimal resolution . Approximating by , where is the minimal distance between and the vesicle wall and the local radius of the wall at this closest point (see below), the experimentally determined depletion potential therefore corresponds to an average of shown in Fig. 1 over all visible oscillations. Within this shell the big colloid was observed to be more often in regions with a small local radius of curvature. This is in qualitative agreement with both the AOa and our present approach. Quantitatively, in Ref. [17] the ratio of the probabilities of finding the big particle within the shell and in the bulk, respectively, was determined. The authors have documented the logarithm of this ration, denoted as
| (3) |
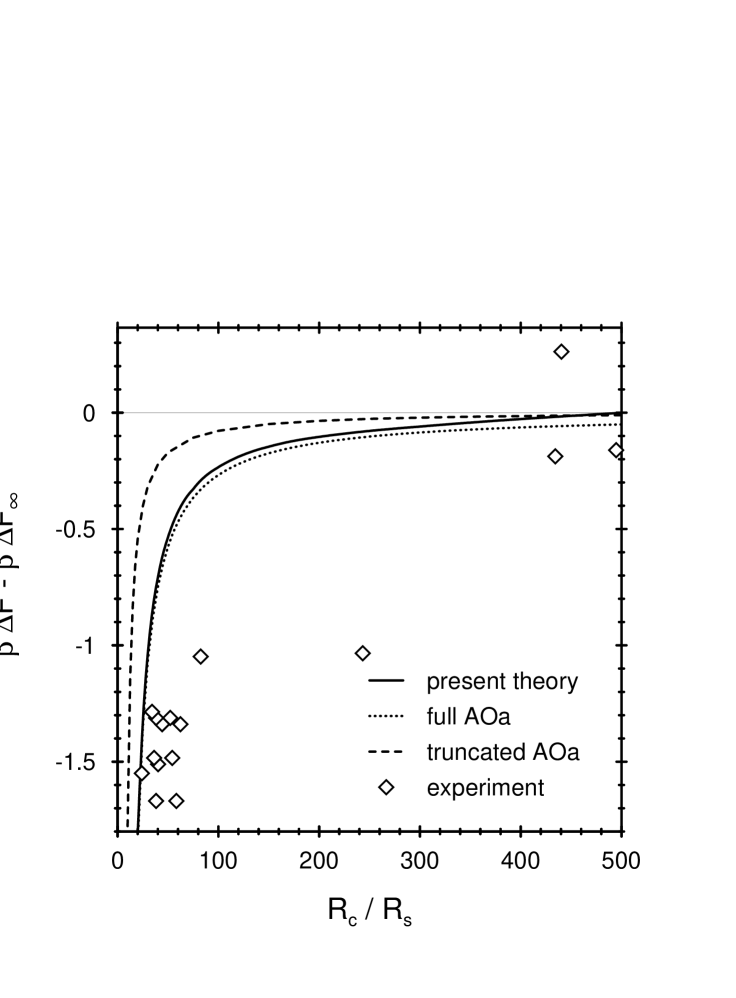
relative to its value near a flat wall, i.e., for ; is the volume of the shell. In Fig. 4 we compare the published data for with our prediction for this quantity based on the actual depletion potential as shown in Fig. 1, with the corresponding prediction if in Eq. (3) and for the full AOa is used, and with the so-called truncated AOa, , i.e., the AOa values for at wall contact, which was used for comparison with theory in Ref. [17]. We find that our theoretical prediction as well as the full AOa are closer to the experimental data than the truncated AOa. Given the high accuracy of our calculation the remaining discrepancy cannot be due to insufficient theoretical knowledge of . The fact that in Ref. [17] only the radius of curvature in plane could be determined, polydispersity of the solvent, and the possible presence of dispersion forces are among the candidates for explaining this discrepancy. The small difference between the full AOa and our theoretical results in Fig. 4 demonstrates that the present spatial resolution cannot discriminate between the rich structure shown in Fig. 1 and its AOa. This emphasizes the need for future experiments with significantly increased spatial resolution.
For a cavity of general shape of its surface relative to a suitable chosen reference plane our results allow us to determine approximately lateral depletion forces. To this end we introduce normal coordinates [19] such that where is the minimal distance of the point from the surface , () are the lateral coordinates of that point on the surface closest to , and is the local surface normal pointing towards . The actual depletion potential , which depends functionally on , can be approximated by . Here we have assumed that the cavity surface varies sufficiently smoothly so that its local two principal radii of curvature can be described by the single radius . Within this approximation the components of the lateral depletion force in the direction of the tangential vector , , is given by
| (4) |
with , and . The factor can be determined from our above results. Its absolute value increases with decreasing radius of curvature. Its sign differs inside and outside of the cavity and changes as function of the normal distance . A big sphere approaching the convex nonspherical wall from inside (outside) is exposed to an oscillating lateral force, which pulls the sphere towards regions of the surface with a small local radius of curvature close to a minimum (maximum) of the depletion potential and pushes it away from these regions close to a maximum (minimum). These oscillations of the lateral force originate from the packing effects of the small spheres. When the big sphere has reached the wall the lateral force pulls it along the surface to that point with the smallest local radius of curvature inside the cavity and pushes it away from this point towards the point with the largest local radius of curvature outside of the cavity, respectively. This can already be understood within the AOa which predicts (see Eq. (1)). Since Eq. (1) provides a very good description of the contact value of the depletion potential, even for high packing fractions, the above expression for its derivative is also quantitatively reliable.
Applying Eq. (4) for an ellipsoidal cavity with semi-axes and and for a big sphere with immersed in a fluid of small spheres with yields at contact a maximal ratio of the lateral force to the normal force of inside and outside of the cavity. Such quantitative predictions for the size of entropic lateral forces along curved confining walls still await tests by simulations and experiments.
REFERENCES
- [1] S.B. Zimmerman and A.P. Minton, Ann. Rev. Biophys. Biomol. Struct. 22, 27 (1993); A.P. Minton, Curr. Opin. Biotechnol. 8, 65 (1997).
- [2] See, e.g., J.C. Crocker and D.G. Grier, Phys. Rev. Lett. 73, 352 (1994).
- [3] A.D. Dinsmore, A.G. Yodh, and D.J. Pine, Nature 383, 239 (1996).
- [4] P.D. Kaplan, J.L. Rouke, A.G. Yodh, and D.J. Pine, Phys. Rev. Lett. 72, 582 (1994).
- [5] P.D. Kaplan, L.P. Faucheux, and A.J. Libchaber, Phys. Rev. Lett. 73, 2793 (1994).
- [6] D.L. Sober and J.Y. Walz, Langmuir 11, 2352 (1995).
- [7] A. Milling and S. Biggs, J. Colloid Sci. 170, 604 (1995).
- [8] Y.N. Ohshima, H. Sakagami, K. Okumoto, A. Tokoyoda, T. Igarashi, K.B. Shintaku, S. Toride, H. Sekino, K. Kabuto, and I. Nishio, Phys. Rev. Lett. 78, 3963 (1997).
- [9] D. Rudhardt, C. Bechinger, and P. Leiderer, Phys. Rev. Lett. 81, 1330 (1998).
- [10] Y. Mao, M.E. Cates, and H.N.W. Lekkerkerker, Physica A 222, 10 (1995).
- [11] T. Biben, P. Bladon, and D. Frenkel, J. Phys.: Condens. Matter 8, 10799 (1996).
- [12] B.Götzelmann, R. Evans, and S. Dietrich, Phys. Rev. E 57, 6785 (1998).
- [13] B. Götzelmann, Ph.D. thesis, Bergische Universität Wuppertal (1998).
- [14] R. Dickman, P. Attard, and V. Simonian, J. Chem. Phys. 107, 205 (1997).
- [15] Y. Rosenfeld, Phys. Rev. Lett. 69, 980 (1989).
- [16] Inside the cavity the chemical potential is adjusted such that its value corresponds to the value for in unbounded space. For small cavities one has to be aware of the difference between the depletion potentials calculated by density functional theory corresponding to a grand canonical ensemble and experimentally determined depletion potentials inside of cavities corresponding to a canonical ensemble. The results in A. González, J.A. White, F.L. Román, S. Velasco, and R. Evans, Phys. Rev. Lett. 79, 2466 (1997) indicate that the difference between the ensembles is only relevant for cavity sizes in the order of a few small sphere radii.
- [17] A.D. Dinsmore, D.T. Wong, P. Nelson, and A.G. Yodh, Phys. Rev. Lett. 80, 409 (1998).
- [18] S. Asakura and F. Oosawa, J. Chem. Phys. 22, 1255 (1954).
- [19] R.K.P. Zia, Nucl. Phys. B 251 [FS 13], 676 (1985).