Low field vortex dynamics over seven time decades in a single crystal for temperatures
Abstract
Using a custom made dc-SQUID magnetometer, we have measured the time relaxation of the remanent magnetization of a single crystal from the fully critical state for temperatures . The measurements cover a time window of seven decades , so that the current density can be studied from values very close to down to values considerably smaller than . From the data we have obtained: (i) the flux creep activation barriers as a function of current density , (ii) the current-voltage characteristics in a typical range of to , and (iii) the critical current density at . Three different regimes of vortex dynamics are observed: For temperatures the activation barrier is logarithmic, no unique functional dependence could be found for the intermediate temperature interval , and finally for the activation barrier follows a power-law behavior with an exponent . From the analysis of the data within the weak collective pinning theory for strongly layered superconductors, it is argued that for temperatures pancake-vortices are pinned individually, while for temperatures pinning involves large collectively pinned vortex bundles. A description of the vortex dynamics in the intermediate temperature interval is given on the basis of a qualitative low field phase diagram of the vortex state in . Within this description a second peak in the magnetization loop should occur for temperatures between and , as it has been observed in several magnetization measurements in the literature.
pacs:
PACS numbers: 74.25.Dw, 74.60.Ge, 74.60.Jg, 74.72.HsI Introduction
High temperature superconductors (HTSC) are characterized by large values of the Ginzburg-Landau parameter , so that most of the phase diagram is dominated by the presence of vortices. Furthermore, the high anisotropy of (Bi2212) has strong implications for the behavior of the flux lattice in the mixed state. When a magnetic field is applied perpendicularly to the -planes, the vortices can be described as two dimensional “pancake-vortices”[2] lying in the superconducting layers. These pancake-vortices interact both through the interlayer Josephson coupling as well as through electromagnetic coupling. Such a layered vortex structure is very sensitive to thermal and quantum fluctuations, especially considering the small coherence length in the direction parallel to the planes. As a consequence, pinning is relatively weak as compared to classical type II superconductors and strong relaxations of the magnetization are observed[3, 4, 5, 6, 7, 8, 9] which deviate from a pure logarithmic time dependence.
Since the discovery of the HTSC[10], the theoretical and experimental work concerning vortices and their dynamics have been strongly intensified. Those investigations were mainly focused on a regime where the current density is relatively small as compared to the critical current density . Only little is known[11, 12, 13] at present regarding the vortex dynamics in a regime where the current density is close to .
In the here presented work, we investigate experimentally the low field vortex dynamics in a Bi2212 single crystal for magnetic fields perpendicular to the layers. For this purpose we have designed and constructed a dc-SQUID magnetometer with high sensitivity and long time thermal stability. The measurements of the relaxation of the remanent magnetization are taken in the temperature interval and cover a time window of seven decades. The wide current range of the experimental data allows a detailed analysis of the vortex dynamics within the theoretical vortex creep models.[14, 15] Applying the method of Maley et al.[16] to the relaxation data, a characteristic functional dependence between the activation barrier and the current density is obtained for the temperature regimes and , whereas for temperatures between and the -relation is found to depend strongly on temperature. On the basis of a qualitative low field phase diagram[17] of Bi2212, an interpretation of the behavior of the vortex dynamics in the temperature interval around the crossover temperature[18, 19, 20, 21] is given.
II Experimental
The measured single crystal is in size and the critical temperature is 95 K, as determined by ac-susceptibility measurements. The growth procedure as well as the transport properties have been described elsewhere. [22] The experiments are performed in a custom made dc-SQUID magnetometer, where the sample remains stationary in the pick-up coil during the measurements. The externally applied magnetic field is supplied by a superconducting coil, working in a non-persistent mode. In order to prevent eddy currents, the experimental cell is entirely built out of epoxy resin Stycast 1266.[23]
During the measuring procedure, the sample is first zero field cooled in the residual field of the cryostat () from well above and then stabilized at a fixed temperature . Next, a magnetic field applied perpendicularly to the -planes is gradually increased from zero to before being removed linearly at a rate of . This fast rate is achieved by shorting the superconducting coil () over an extremely non-linear resistor. Measurements of the current in the coil show that no discontinuities occur during the removal of the field. The data are taken as soon as the decreasing magnetic field fulfills the condition . As a time origin for the measured data we choose the time at which starts being removed. After measuring the relaxation of the remanent magnetization for about seven time decades, the sample is heated above in order to record its residual magnetization. The maximum values of the initially applied magnetic field are shown in Table I for all the measuring temperatures . The values of are chosen so that they are bigger than twice the field needed to achieve full flux penetration into the sample. Table I further contains the values of the residual field along the axis of the superconducting coil after cycling the magnetic field from zero to and back to zero again.
Due to the high field removal rate , it was necessary to perform some controls concerning the initial field profile in the sample as well as self-heating effects. Several field removal rates have been tested. We found that for the field removal rates , the measured remanent magnetizations do not show any remarkable difference. Moreover, no significant change in the dynamics of the relaxation of could be detected by increasing the initial field values by a factor of 2–3. From our estimations we concluded that the self-heating of the sample due to induction as well as to flux flow can be neglected for all temperatures and fields of our measurements.
With the described experimental procedure we measured the relaxation of the remanent magnetization for the Bi2212 crystal from the fully critical state in a temperature range of . Since there is only a small uncertainty of the time origin of the creep process (), the initial behavior of the relaxation data as a function of time is very well defined so that we were able to test the existing vortex creep models over a wide current density region starting from values near .
III Flux dynamics models
The main effect of pinning is to allow a flux density gradient to be sustained within a type II superconductor. This is intrinsically related to the flow of a macroscopic diamagnetic screening current density that can be expressed, in the continuous approximation, through Maxwell’s equation . The configuration with a finite flux density gradient is metastable and hence is bound to decay. The dynamics arises from the vortex creep motion as a result of thermal activation[24] and quantum tunneling[25, 26] (). For a geometry where and , the Maxwell equations together with the condition of flux conservation lead to the non-linear diffusion equation[27, 28]
| (1) |
Anderson[29] postulated that the velocity of the vortices, as a consequence of thermal activation over the pinning barrier , be given by
| (2) |
where is the mean vortex velocity and can be expressed as , where is the mean hopping length and the is inverse attempt frequency. For a situation where is independent of , the diffusion equation (1) can be transformed into
| (3) |
As discussed by Geshkenbein and Larkin[30], equation (3) can be solved within logarithmic accuracy, yielding
| 13 | 15 – 27 | 30 – 40 | 50 | ||
|---|---|---|---|---|---|
| 1500 | 1000 | 500 | 300 | ||
| (4) |
where is a time scaling factor. Once the functional dependence between the pinning barrier and the current density is known, the time dependence of is simply determined by the inversion of (4).
On approaching the critical current density , the effective pinning barrier vanishes and one can write
| (5) |
| (6) |
which maps to the original formulation of Anderson[29] for .
In the above derivation it is assumed that the current densities be close to . This is a good assumption for conventional type II superconductors. Further theoretical considerations are necessary to describe the strongly decaying current densities in HTSC, for which values of much smaller than are reached already at laboratory times. For the HTSC in the limit of small currents, the weak collective pinning theory[14] (WCPT) as well as the vortex glass theory[15], predict an activation barrier that diverges algebraically for vanishing currents:
| (7) |
Inserting the relation (7) into equation (4) the following non purely logarithmic time dependence of the current density is obtained:
| (8) |
In order to find a more general formula, (8) and (6) (we assume ) can be interpolated with the following expression
| (9) |
and the corresponding activation barrier is (see equation (4))
| (10) |
Within the single vortex pinning regime the exponent is large, such that for expression (9) can be approximated by
| (11) |
with a logarithmic potential
| (12) |
Notice that within the WCPT, the divergence in the potentials (7), (10), and (12) at low current densities is related to the observation that the activated motion of vortices involves hops of larger vortex segments/bundles over longer distances. The elastic energy cost will therefore grow with decreasing . This is no longer the case for the point-like pancake-vortices for which no extra deformation energy is needed in order to overcome the pinning barrier for decreasing current densities. For strongly layered superconductors within the single pancake creep regime the activation barrier is therefore expected to saturate. However, using the concept of variable-range hopping[31, 32] (VRH) it has been argued[14] that, for decreasing current densities , pancake-vortices still couple into a 2D elastic manifold. As a matter of fact, due to the randomness in the energies of the metastable state, pancakes will hop over larger distances as the current density decreases. Such a large hopping distance leads to a large shear interaction energy between pancakes ( is the shear modulus and the interlayer distance). As a consequence, for a large enough hopping distance , the pancake-vortex will start to couple to its neighbours. Thus, the vortex system is expected to first go through a VRH regime, which is followed by a 2D collective creep regime[7] at still lower current densities.
In the above treatment of the flux dynamics models we have considered current densities flowing inside a superconductor, whereas from the experiment we obtain spatially averaged values of the magnetization . In the case of an infinite slab parallel to the applied magnetic field , the dependence between and has been described by Bean.[33] Recently Gurevich and Brandt[34] obtained an asymptotic solution for the non-linear diffusion equation (1) describing flux creep in strips and disks starting from a barrier as given in formula (10). It turns out that, despite the particular field distribution for these sample geometries, the current density can still be considered as constant throughout the sample at a given time . It follows that the magnetization , which is given by
| (13) |
for a disk-like geometry and for a constant current density , can be expressed as
| (14) |
where the integration over the geometrical factor leads to
| (15) |
with being the sample radius. For the case of disks (strips) the well known Bean model relationship for an infinite cylinder (infinite slab) in the fully critical state is therefore still a valid approximation.
IV Vortices in strongly layered superconductors
For the considerations given in this Section concerning the vortex lattice in coupled superconducting layers we will closely follow the approach of Refs. [14] and [35]. Within weak collective pinning theory the size of the correlated regions (Larkin domains) is determined by the balance between deformation energy and pinning energy. In terms of length scales, the volume forming the Larkin domain is given by the pinning correlation lengths and in the direction perpendicular and parallel to the magnetic field, respectively. Through the study of the relative magnitude of the deformation and the pinning energy of a vortex lattice in coupled superconducting layers, it is possible to determine the size of the correlated regions as a function of temperature and field.
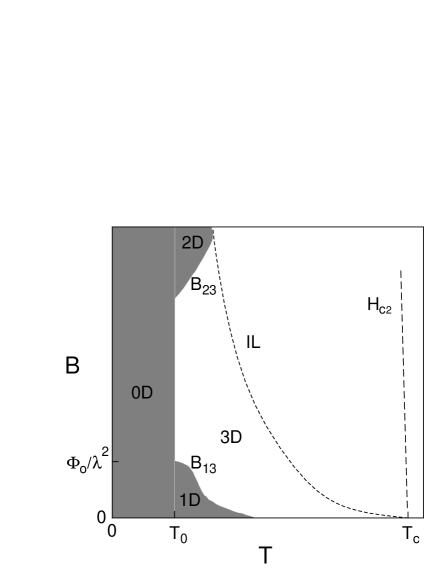
For a magnetic field perpendicular to the superconducting layers, a vortex lattice has three relevant energy scales, namely the tilt energy , the shear energy , and the pinning energy , with being the dispersive tilt modulus, the shear modulus, the range of the pinning force, the intervortex spacing, and the disorder strength (where a short-scale correlated disorder potential has been assumed ). Depending on the relative magnitude of these energies, one can distinguish four possible pinning regimes: (1) independently pinned vortex pancakes (0D pinning regime: ), (2) independently pinned vortex lines (1D pinning regime: ), (3) a 2D collectively pinned state in which the 2D vortex lattices in the layers are pinned independently from each other (), and (4) a 3D collectively pinned state ().
According to Refs. [14] and [17], for temperatures and fields , where is a few tens of Kelvins and is a few Teslas, the dominant energy scale for the strongly anisotropic Bi2212 is the pinning energy (where , , , , is the interlayer distance, and the depairing current density). The - phase diagram for this region is therefore characterized by 0D pinning. On the other hand, for temperatures the collective pinning length and the collective pinning radius both grow very fast due to thermal depinning. This implies that for temperatures the size of the Larkin domains becomes large giving rise to a 3D pinning regime[17]. At high fields , a crossover to a 2D collective pinning region is predicted[14] when the shear energy outweighs the tilt energy.
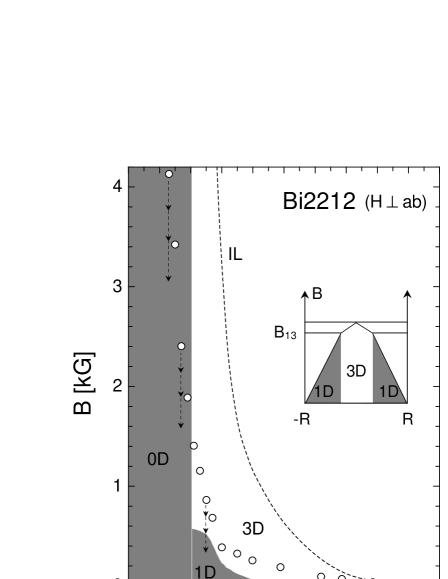
Finally, since the relaxation measurements of the remanent magnetization presented in this work are performed in the “field off” state, we need to discuss the very low field regime. At fields , the shear modulus has a linear dependence in , whereas at low fields (), decreases exponentially[17, 36]
| (16) |
where is the penetration depth. As a consequence, also the shear energy decreases exponentially for fields . This means that for temperatures and small enough magnetic fields () a 1D pinning regime occurs. Fig. 1 shows a qualitative map of the low field pinning regimes of Bi2212 resulting from these considerations.
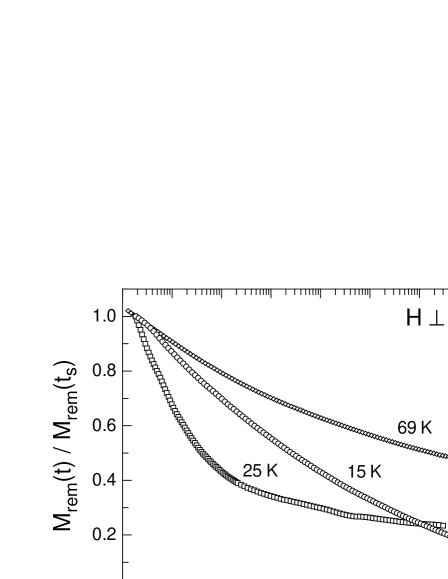
() at 15 K, () at 25 K, and () at 69 K.
The time origin is given by the instant, when the externally applied magnetic field starts being decreased and is the time, when the first point of the relaxation of is taken.
V Experimental Results and Analysis
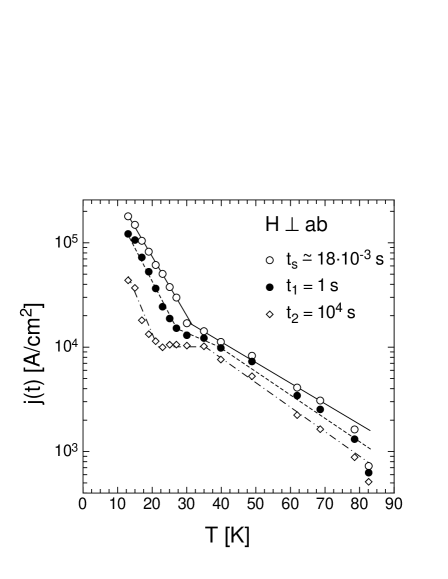
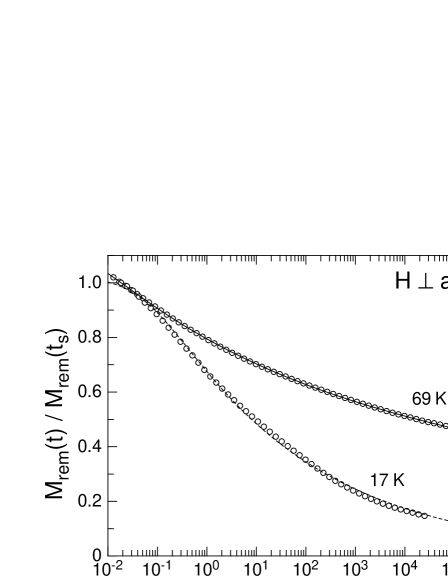
In Fig. 2 we illustrate the time dependence of the remanent magnetization with a typical set of data. A non-logarithmic behavior[21] is observed at all temperatures. Notice that at , where a sharp drop in the relaxation rate has been previously reported[18, 19, 20], the remanent magnetization decays extremely fast in the first few seconds after the removal of the external field . This is also seen in Fig. 3, where the current density (as obtained from formula (15)) is plotted as a function of temperature for the times , and . The data taken at the starting time (empty circles) suggest the presence of only two regimes of vortex dynamics, separated by a crossover at . Both regimes are accurately described by an exponential temperature dependence but with different slopes . However, at longer times (filled circles and empty diamonds) the existence of a third regime for temperatures between and becomes evident. This third regime is characterized by very particular vortex dynamics and will be referred to as the “intermediate regime”. We will discuss these temperature regimes separately and distinguish them as follows: a low temperature regime for , an intermediate regime for and a high temperature regime for . For each regime we determine the activation barrier by means of the method of Maley et al.[16] Once the functional dependence of is obtained, an analysis of the time evolution of the current density is given.
A Low Temperature Regime ()
As shown by Maley et al. it is possible to determine the activation barrier for vortex motion directly from the relaxation data . Starting from equation (3), one obtains
| (17) |
where the term is independent of , and . Plotting the expression as a function of current density at different temperatures , a set of curves is found which are vertically shifted with respect to each other. For a temperature interval where the functional dependence between the activation barrier and the current density is essentially temperature independent, this shift is given by the term , where is a constant, and is the temperature difference between two considered curves. Combining the data measured at different temperatures , the activation barrier is obtained over a wide current density range.
starting time , , and .
The lines serve as guides to the eyes.
For temperatures , the data obtained from the expression at different temperatures can be accurately mapped onto a common curve using a single constant . The obtained potential is shown in Fig. 4. It is interesting to observe in Fig. 4(a), that the data measured at a fixed temperature (marked by horizontal segments) do overlap over wide regions of current. As seen in Fig. 4(b), the potential is proportional to the logarithm of the current density over a wide current region. This is in good agreement with previous relaxation measurements by van der Beek et al.[7] and by Emmen et al.[8], who found a logarithmic dependence of for temperatures . The deviation from the logarithmic behavior at temperatures is attributed to the influence of the approaching intermediate regime.
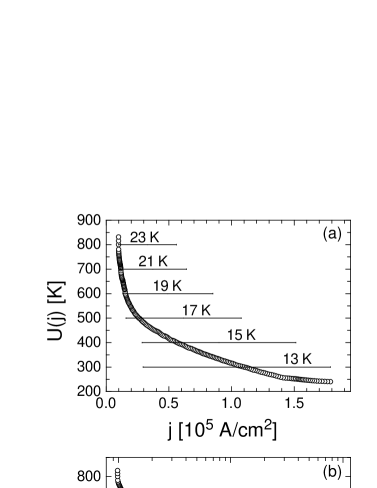
(b) The same data in a semi-logarithmic graph. The line is a fit for temperatures up to (indicated by the arrow) with a logarithmic potential of the type . From the fit one finds the critical current density .
For temperatures , a fit of the measured potential with the logarithmic activation barrier (12) leads to the following parameters: and the extrapolated critical current density . The value of is very close to the values found in the literature[7, 8] (taking into account the considered proportionality factors between and ).
As discussed in Section III, the activation barrier is expected to be logarithmic within the single vortex pinning regime. Since the measured potential is indeed logarithmic, this would suggest that for temperatures vortex strings are pinned individually. However, a simple estimate of the collective pinning length along the -axis , where is the anisotropy factor and is the depairing current density, shows that, for the parameters of Table II and III, . This means that, for temperatures and low enough magnetic fields, pancake-vortices placed on different superconducting layers are pinned independently indicating the presence of a single pancake pinning regime. A more detailed discussion of the low temperature activation barrier will be given in Section VI.
We can crosscheck the result for the barrier as obtained via the Maley analysis making use of equations (11) and (15). A typical fit to the data measured at temperatures is shown in Fig. 5, confirming the logarithmic dependence . The resulting fitting parameters are the following: , and values of about 5% above the values shown in Fig. 3 for .
Finally, we point out that for temperatures the values of the pinning potential and of the extrapolated critical current density are both in good agreement with the results in the literature, usually obtained in the “field on” mode at much slower field ramping rates .
B Intermediate Regime ()
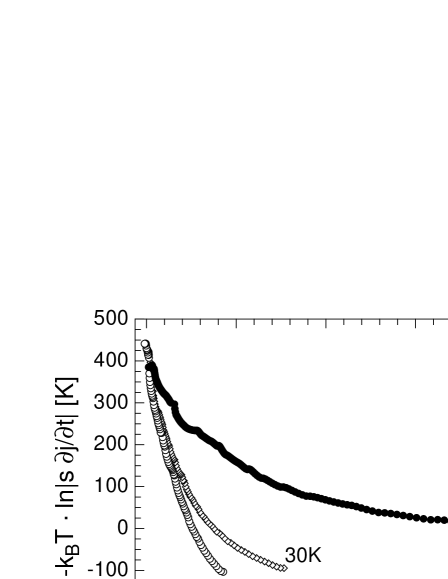
In order to find the activation barrier for temperatures , the relaxation data are again evaluated with the method of Maley et al. The results obtained with help of equation (17) for different temperatures are shown in Fig. 6. We observe that the curves are strongly tilted with respect to each other and it is not possible to obtain a unique smooth curve by simply shifting the data obtained at different temperatures along the vertical axis. Thus, within the temperature range , we cannot find a unique temperature independent functional relation between and following the above approach. A qualitative interpretation of the vortex dynamics in this temperature regime will be given in Section VI.
C High Temperature Regime ()
For temperatures , the activation barrier is found with the same method that has been applied for the low temperature regime using a single constant . The resulting barrier is shown in Fig. 7. From the double logarithmic plot of Fig. 7(b), we observe that the activation barrier follows a power-law behavior over a wide current range. Fitting this potential with formula (10) for temperatures , we find the values and .
According to Ref. [14], a power-law potential with the form of (10) leads to a time dependence of the current density as given by the interpolation formula (9). As one can see from the solid line of the fit to the data in Fig. 5, the time dependence of the current density is very well described by the interpolation formula (9). The fitting parameters confirm the results previously obtained for the barrier and can be summarized as follows (see also Table II): , , , and values of about 5% above those obtained from Fig. 3 at . According to weak collective pinning theory, an exponent indicates a regime of large 3D bundle pinning.
The high temperature data have been analysed considering a constant current density inside the sample
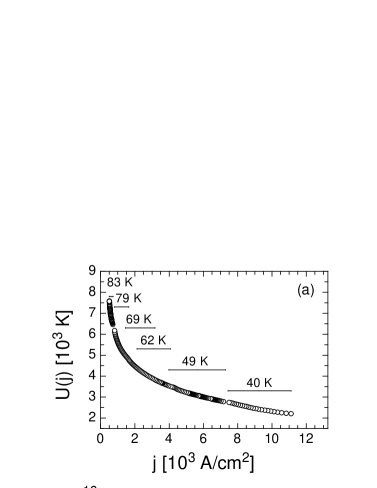
(b) The same data in a double-logarithmic graph. The line is a fit for temperatures , with a power-law potential as given in formula (10).
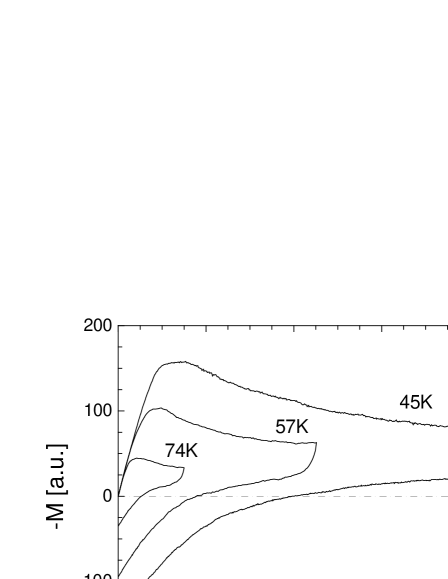
as assumed in the Bean model (see formula (15)). We argue that, for the present measurements of the relaxation of the remanent magnetization , the contributions of pinning due to potential barriers arising from surface effects[37, 38, 39, 40] and sample geometry [41, 42] have only a secondary effect as compared to the contributions of bulk pinning. As a matter of fact, if surface barriers were the only mechanism responsible for the irreversible behavior, the magnetization curves would be characterized by zero magnetization on the descending branch of the loop.[38, 39, 40] Fig. 8 shows three magnetization cycles of the Bi2212 crystal measured at different temperatures . From the shape of the curves we can safely say that, for our sample, pinning due to surface barriers does not play
| (K) | (s) | |||
|---|---|---|---|---|
| (K) | 140 | |||
| (K) | 1000 | — | 0.6 |
a dominant role. In thin superconducting strips of rectangular cross section, Meissner currents flow throughout the whole sample[43, 44] and not only in a surface layer of width . Lorentz forces arising from the Meissner currents will therefore act on the vortices and give rise to a barrier of purely geometric origin.[41] This kind of geometrical barrier will not influence measurements performed in the “field off” state, since Meissner currents do not flow in this state (the influence of the residual fields is of minor importance, see Table I).
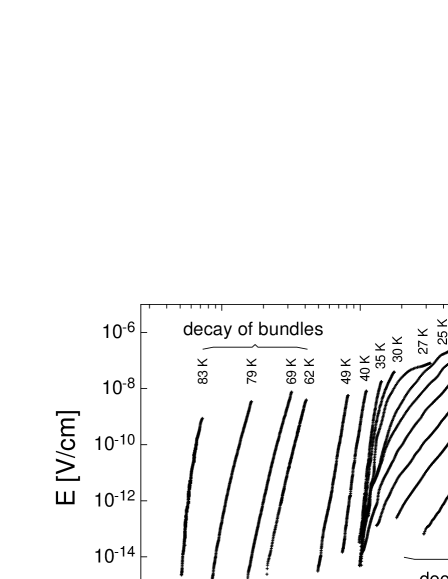
D Current-Voltage Characteristics
Inductive measurements of the relaxation of the remanent magnetization are a powerful tool[9, 45, 46] for the evaluation of characteristics of a superconductor down to very low values of the electric field . The functional dependence between the electric field and the current density can be found as follows. In the Coulomb gauge , the vector-potential can be expressed as
| (18) |
where is the current density. For a disk-like geometry and for a constant current density , one obtains
| (19) |
which, together with the Faraday induction law , leads to
| (20) |
where is the mean electrical field in the sample, the sample radius and its thickness. The constant factor arises from the assumption of a disk-like geometry for the sample.
The results obtained from the magnetic relaxation data and equation (20) are plotted in Fig. 9. From the graph one can clearly distinguish the three regimes of vortex dynamics, which were previously discussed in this Section. For current densities , the electric field due to the dissipative process of thermally activated vortex drift can be written as[34]
| (21) |
From Fig. 9 it is seen that for temperatures the curves follow a power-law behavior. As a matter of fact, inserting the logarithmic potential (12) into formula (21) one obtains
| (22) |
From a fit to the curves in this temperature regime we obtain again , in agreement with the previous results.
| (K) | (Å) | |
|---|---|---|
| (K) | ||
For temperatures , the electric field behaves like a power-law only at high current densities. For smaller values of the current density , the different curves tend to converge into the curve. Further details about this temperature regime will be given in the next Section.
Finally, for temperatures , the curves have a negative curvature in the - plot, in agreement with the interpolation formula (10) for the barrier as obtained from the WCPT. The fitting parameter is again consistent with our previous results.
VI Summary and Discussion
The results obtained in the previous Section for the strongly layered Bi2212 single crystal in magnetic fields -planes are now summarized and further discussed within the frame of WCPT.
For temperatures , the activation barrier for vortex motion depends logarithmically on the current density, while the time relaxation of the current density follows a power-law behavior as given by formula (11). According to the discussion in Section III, an approximately logarithmic current dependence in the activation barrier (12) is obtained within the single vortex pinning situation. However, in Section V it has been shown that for temperatures and small enough magnetic fields, the correlation length along the -axis is much smaller than the interlayer distance . This indicates that for this regime pinning involves elementary pancake-vortices.
On the other hand, within the most simple approach (see Section III), for decreasing current densities the activation barrier for single pancakes is expected to be a constant, whereas the measured activation barrier is found to be logarithmic up to temperatures . The non-constant behavior of the measured activation barrier suggests that there are residual interactions which were not considered in the most simple approach and which lead to an increase of the elastic energy for decreasing . This argument is also supported by following considerations: The collective pinning energy for single pancakes,[14] which is the relevant parameter for the determination of quantities such as the critical current density and the depinning energy, is given by . For the parameters of Table II and III one finds that . Furthermore, the energy which is relevant for creep of pancake-vortices is expected to be bigger than , but of the same order of magnitude. However, this estimated energy is still small as compared to the values obtained for the activation energy plotted in Fig. 4, indicating that for creep of pancake-vortices additional interactions have to be considered. A possible idea leading to coupling of the pancake-vortices into an elastic plane[14] for decreasing current densities is the concept of variable-range hopping. As discussed in Section III, due to the randomness in the energies of the metastable state, pancakes will hop over larger distances as the current density decreases. The shear interaction energy will therefore grow with increasing hopping distance and for low enough current densities will become of the order of the pinning energy . In summary, the vortex system is expected to go over from a VRH regime (creep of individual pancake-vortices) to a 2D collective creep regime at low current densities.
At higher temperatures (), where bulk pinning becomes relatively weak, barriers arising from the geometry of the sample and from surface effects can play an important role. As shown in Section V, in the low magnetic induction regime (“field off” creep measurements) and for our specimen, these contributions are of minor importance as compared to the contributions of bulk pinning.
For temperatures , the activation barrier is found to follow a power-law behavior (Fig. 7) that can be accurately fitted with formula (10). Within WCPT it has been shown that a potential of the form of (10) leads to a time relaxation of the current density as given by the interpolation formula (9). From the fit to the data in Fig. 5, it is seen that for this temperature regime the time dependence of the current density is actually well described by formula (9). According to WCPT, a power-law potential with an exponent , as obtained from the fits, indicates a regime of large bundle pinning. A list of the obtained fitting parameters is given in Table II.
No unique functional dependence between and could be found for the temperature range . Motivated by the present experimental results, the very low field regime of the Bi2212 pinning diagram has been investigated. Fig. 1 shows the qualitative diagram obtained for this regime. For temperatures above , two different pinning regimes separated by are found involving vortex-pancakes and vortex-segments. In order to describe the relaxation data in this temperature regime it is therefore necessary to estimate the induction in the center of the sample () at the time , immediately after removing the external field . These values are given for all temperatures by the empty circles in Fig. 10, where the arrows indicate the time evolution of during the relaxation of the remanent magnetization . For temperatures and , it follows that the whole sample is characterized by 0D and by 3D pinning, respectively. On the other hand, as shown in the insert of Fig. 10, for temperatures , the values of the initial field profile in the sample lead to the coexistence of two different pinning regimes: 3D pinning in the central region of the sample and 1D pinning close to the borders. The simultaneous occurrence of two different pinning regimes may then provide an explanation why no simple functional dependence between and could be found for this temperature interval.
From the analysis of the relaxation data we find that vortex bundles are strongly pinned against thermal activation. Nevertheless, due to their large size they can only sustain low flux density gradients, which means low critical current densities . On the other hand, vortex strings are weakly pinned, but being small in size they can sustain relatively high flux density gradients. Much higher creep rates are therefore expected for collectively pinned vortex lines than for large vortex bundles. Thus, a possible interpretation of the vortex dynamics observed for the temperature interval is the following: The high relaxation rates which are measured at times (see Fig. 2) are mainly the result of the strong decay of the flux in the 1D regime at the border areas of the sample. At times , most of the flux has left the sample and only a low flux density gradient of vortex strings remains. As discussed in Section III, at low current densities the activated motion of vortex-lines involves hops of larger vortex segments by longer distances. The weak relaxation rates of the current density measured at times are then explained by the growth of the elastic energy for the activated motion of vortex strings at low current densities.
A feature that has recently attracted a lot of interest in the literature is the observation of a second peak in the magnetization loop.[48] In our Bi2212 sample, as well as in several other works on Bi2212,[42, 49, 50, 51, 52] this second peak is seen for magnetic inductions of the order of and for temperatures between and . As discussed in Section IV, for magnetic inductions the shear modulus starts to decrease exponentially so that, at low fields and for temperatures , a 1D pinning regime can arise (see Fig. 1). For the ascending branch of a magnetization loop it follows that, for fields larger than the field of first flux penetration , the sample is expected to first enter into the 1D regime before gradually going over into 3D. As previously discussed, at a fixed temperature , the value of is bigger for the 1D regime than for the 3D regime. However, since the flux in the 1D regime has a much faster creep rate as compared to the 3D regime, it is very important to consider the time scale for the measurement of the magnetization loop. For instance, if the time scale were very short (), the effects of creep would be negligible and for an increasing (decreasing) magnetic field one would expect to measure a decrease (increase) in the magnetization as soon as the magnetic induction is of the order of , where the flux in the sample goes over from 1D to 3D. On the other hand, on the typical time scale of the measurement of a magnetization loop, the flux in the 1D regime is already strongly relaxed while the flux in the 3D regime is still close to its configuration in the critical state. The value of the magnetization may then turn out to be smaller in the 1D regime than in the 3D regime, leading to the characteristic double peak in the magnetization loop as measured for temperatures between and .
This interpretation is in agreement with previous reports (Refs. [52, 53, 54]) which relate the second peak of the magnetization loop to the slower magnetization decay for the field range where the peak is observed. Moreover, it is in agreement with the results of Ref. [42] regarding local induction measurements on a Bi2212 sample. In the descending branch of the magnetization loop, at and for field values between and , a change of slope of the field profile is observed[42] occurring at various locations inside the crystal starting from the edge regions and moving towards the center as the applied field is decreased (with being the induction parallel to the crystallographic -axis). Within the presented low field phase diagram of Bi2212, this change of slope is expected to occur at the crossover field .
In conclusion, for temperatures , the observation of the second peak in the magnetization loop and of the high relaxation rates of the current density for times can both be related to the coexistence of two different pinning regimes inside the sample and to the strong difference in their relaxation rates.
VII Acknowledgments
It is a pleasure to acknowledge many helpful discussions with V.B. Geshkenbein, C. de Morais-Smith, T. Teruzzi, K. Aupke, R. Frassanito, and A. Amann. We are grateful to V.N. Zavaritzky for providing the Bi2212 sample. A.S. would like to thank D. Brinkmann for his kind support. This work was supported by the Schweizerischer Nationalfonds zur Förderung der wissenschaftlichen Forschung and by the Eidgenössische Stiftung zur Förderung der schweizerischen Volkswirtschaft durch wissenschaftliche Forschung.
REFERENCES
- [1] Present Address: Physik-Institut der Universität Zürich, Winterthurerstr. 190, 8057 Zürich, Switzerland.
- [2] J.R. Clem, Phys. Rev. B 43, 7837 (1991).
- [3] H. Safar, C. Durán, J. Guimpel, L. Civale, J. Luzuriaga, E. Rodriguez, F. de la Cruz, C. Fainstein, L.F. Schneemeyer, and J.V. Waszczak, Phys. Rev. B 40, 7380 (1989).
- [4] P. Svendlindh, C. Rossel, K. Niskanen, P. Norling, P. Nordblad, L. Lundgren, and G.V. Chandrasekhar, Physica C 176, 336 (1991).
- [5] D. Shi and M. Xu, Phys. Rev. B 44, 4548 (1991).
- [6] D. Hu, W. Paul, and J. Rhyner, Physica C 200, 359 (1992).
- [7] C.J. van der Beek, P.H. Kes, M.P. Maley, M.J.V. Menken, and A.A. Menovsky, Physica C 195, 307 (1992).
- [8] J.H.P.M Emmen, V.A.M. Brabers, and W.J.M. de Jonge, J. of Alloys and Compounds 195, 439 (1993).
- [9] A.A. Zhukov, H. Kupfer, V.A. Rybachuk, L.A. Ponomarenko, V.A. Murahov, and A.Yu. Martynkin, Physica C 219, 99 (1994).
- [10] J.G. Bednorz and K.A. Müller, Z. Phys. 64, 189 (1986).
- [11] H. Küpfer, C. Keller, R. Meier-Hirmer, U. Wiech, K. Salama, V. Selvamanickam, S.M. Green, H.L. Luo, and C. Politis, Phys. Rev. B 41, 838 (1990).
- [12] L. Gao, Y.Y. Xue, P.H. Hor, and C.W. Chu, Physica C 177, 438 (1991).
- [13] T. Puig, P.G. Huggard, M. Pont, Gi. Schneider, J.S. Muñoz, and W. Prettl, Phys. Rev. B 49, 7004 (1994).
- [14] A.I. Larkin and Yu.N. Ovchinnikov, J. Low Temp. Phys. 34, 409 (1979); V.M. Vinokur, M.V. Feigel’man, V.B. Geshkenbein, and A.I. Larkin, Phys. Rev. Lett. 65, 259 (1990); G. Blatter, M.V. Feigel’man, V.B. Geshkenbein, A.I. Larkin, and V.M. Vinokur, Rev. Mod. Phys. 66, 1125 (1994).
- [15] M.P.A. Fisher, Phys. Rev. Lett. 62, 1415 (1989); D.S. Fisher, M.P.A. Fisher, and D.A. Huse, Phys. Rev. B 43, 130 (1991).
- [16] M.P. Maley, J.O. Willis, H. Lessure, and M.E. McHenry, Phys. Rev. B 42, 2639 (1990).
- [17] G. Blatter et al., unpublished.
- [18] V.N. Zavaritzky and N.V. Zavaritzky, Physica C 185–189, 2141 (1991).
- [19] T. Teruzzi, Ph. D. Thesis, ETH Zürich (1993).
- [20] V.V. Metlushko, G. Güntherodt, I.N. Goncharov, A.Yu. Didyk, V.V. Moshchalkov, and Y. Bruynseraede, Physica B 194–196, 2219 (1994).
- [21] M. Nideröst, T. Teruzzi, R. Frassanito, A. Amann, P. Visani, and A.C. Mota, Physica C 235–240, 2891 (1994).
- [22] N.V. Zavaritzky, A.V. Samoilov, and A.A. Yurgens, Physica C 169, 174 (1990).
- [23] Stycast 1266, Grace N.V., 2431 Westerloo, Belgium.
- [24] P.W. Anderson and Y.B. Kim, Rev. Mod. Phys. 36, 39 (1964).
- [25] A.C. Mota, A. Pollini, P. Visani, K.A. Müller, and J.G. Bednorz, Phys. Rev. B 36, 4011 (1987).
- [26] G. Blatter and V. Geshkenbein, Phys. Rev. B 47, 2725 (1993).
- [27] M.R. Beasley, R. Labusch, and W.W. Webb, Phys. Rev. 181, 682 (1969).
- [28] E.H. Brandt, J. Mod. Phys. B 5, 751 (1991).
- [29] P.W. Anderson, Phys. Rev. Lett. 9, 309 (1962).
- [30] V.B. Geshkenbein and A.I. Larkin, Sov. Phys. JETP 68, 639 (1989).
- [31] N.F. Mott, Philos. Mag. 19, 835 (1969).
- [32] B.I. Shklovskii and A.L. Efros, Electronic Properties of Doped Semiconductors, Springer Series in Solid-State Science No. 45 (Springer, Berlin, 1984).
- [33] C.P. Bean, Phys. Rev. Lett. 8, 250 (1962); Rev. Mod. Phys. 36, 31 (1964).
- [34] A. Gurevich and E.H. Brandt, Phys. Rev. Lett. 73, 178 (1994).
- [35] A.E. Koshelev and P.H. Kes, Phys. Rev. B 48, 6539 (1993).
- [36] R. Labusch, Phys. Status Solidi 19, 715 (1967); 32, 439 (1969); A.I. Larkin, Zh. Eksp. Teor. Fiz. 58, 1466 (1970) [Sov. Phys. JETP 31, 784 (1970)].
- [37] C.P. Bean and J.D. Livingston, Phys. Rev. Lett. 12, 14 (1964).
- [38] A.M. Campbell and J.E. Evetts, Critical Currents in Superconductors (Taylor & Francis, London, 1972), p. 142.
- [39] J.R. Clem, in Proceedings of the 13th Conference on Low Temperature Physics (LT13), edited by K.D. Timmerhaus, W.J. O’Sullivan, and E.F. Hammel (Plenum, New York, 1974), Vol. 3, p. 102.
- [40] M. Konczykowski, L.I. Burlachkov, Y. Yeshurun, and F. Holtzberg, Phys. Rev. B 43, 13707 (1991); L. Burlachkov, ibid. 47, 8056 (1993).
- [41] E. Zeldov, A.I. Larkin, V.B. Geshkenbein, M. Konczykowski, D. Majer, B. Khaykovich, V.M. Vinokur, and H. Shtrikman, Phys. Rev. Lett. 73, 1428 (1994).
- [42] E. Zeldov, D. Majer, M. Konczykowski, A.I. Larkin, V.M. Vinokur, V.B. Geshkenbein, N. Chikumoto, and H. Shtrikman, unpublished.
- [43] A.I. Larkin and Yu.N. Ovchinnikov, Zh. Eksp. Teor. Fiz. 61, 1221 (1971) [Sov. Phys. JETP 34, 651 (1972)].
- [44] R.P. Huebner, R.T. Kampwirth, and J.R. Clem, J. Low Temp. Phys. 6, 275 (1972).
- [45] G. Ries, H.W. Neumüller, and W. Schmidt, Supercond. Sci. Technol. 5, 81 (1991).
- [46] W. Paul, D. Hu, and Th. Bauman, Physica C 185–189, 2373 (1991).
- [47] A. Schilling, R. Jin, J.D. Guo, and H.R. Ott, Phys. Rev. Lett. 71, 1899 (1993).
- [48] M. Däumling, J.M. Seuntjens, and D.C. Larbalestier, Nature 346, 332 (1990).
- [49] V.N. Kopylov, A.E. Koshelev, I.F. Schegolev, and T.G. Togonidze, Physica C 170, 291 (1990).
- [50] G. Yang, P. Shang, S.D. Sutton, I.P. Jones, J.S. Abell, and C.E. Gough, Phys. Rev. B 48, 4054 (1993).
- [51] T. Tamegai, Y. Iye, I. Oguro, and K. Kishio, Physica C 213, 33 (1993).
- [52] Y. Yeshurun, N. Bontemps, L. Burlachkov, and A. Kapitulnik, Phys. Rev. B 49, 1548 (1994).
- [53] N. Chikumoto, M. Konczykowski, N. Motohira, K. Kishio, and K. Kitazawa, Physica C 185–189, 2201 (1991).
- [54] L. Krusin-Elbaum, L. Civale, V.M. Vinokur, and F. Holtzberg, Phys. Rev. Lett 69, 2280 (1992).