[
Numerical investigation of the influence of the history on the local structure of glasses
Abstract
By means of molecular dynamics simulations and the Voronoï tessellation, we study the influence of the history on the low temperature characteristics of soft sphere and silica glasses. The quench from the liquid is interrupted at an intermediate temperature for a given relaxation time, and then the cooling process is continued down to 0K. The local structure at 0K depends on the temperature and the effect is larger for close to the glass transition temperature . This dependence, coherent with recent results, is expected in the strong glass former where the characteristics of a particular state depend on its history. In the soft-sphere case, because of crystallization effects, the dependence of the local structure of the glassy samples on their history can only be detected in the supercooled liquid region.
pacs:
PACS numbers: 61.43.Fs, 02.70.Ns, 61.20.Lc, 61.43.-j]
I. INTRODUCTION
Experimentally, from the study of slow dynamics in disordered solids,
it is now well established that the time evolution of certain systems
depends on the manner these systems were prepared. This phenomenon called
usually “aging” has been observed in structural (polymer) glasses
[1], spin-glasses [2] or orientational glasses [3].
Recently theoretical work concerning aging effects in a structural
Lennard-Jones glass has been published [4]. Through classical
molecular dynamics (MD) simulations the authors show that the dynamical
behavior of this system depends on the initial temperature before the
quench and exhibits the same scaling features than the one observed
in spin-glasses.
Several theoretical explanations have been proposed to account for
this apparent universal behavior of the out-of-equilibrium dynamics
in various glasses [5].
Since it has been shown that aging effects occur in a model glass,
we want here to address this question from the structural point of view
by using a combination of classical microcanonical MD calculations
and the Voronoï tessellation. An in-depth description of our Voronoï tessellation scheme can be found in a previous paper [6].
For the sake of generality, we consider two very different systems, a soft
sphere glass and a silica glass, representative of amorphous metals and
vitreous oxides, respectively.
II. METHODOLOGY
The soft sphere system is a very simple monoatomic model (without any particular experimental counterpart) described by the purely repulsive potential introduced by Laird and Schober (LS) [7]. This potential is basically a modified inverse power potential similar to those very often used in computer simulations of liquids and glasses. Here we use the same parameters (arbitrarily equal to the Lennard-Jones parameters of Argon) as in previous studies [6, 8] and consequently the glass transition temperature and melting temperature are respectively K [7] and K [9]. In the present MD calculations we have considered, as before [6, 8], 1000 soft spheres in a cubic box of edge length 34.05Å. The silica system is described by the more sophisticated potential first introduced by van Beest, Kramer and van Santen (BKS) [10] and justified by ab initio calculations. Though designed originally for the crystalline phases of silica, it has been shown to describe quite well the structural [11] and vibrational [12] properties of vitreous silica. In that case also we make use of the same parameters as in a previous study [13] in which we have performed microcanonical MD calculations (treating the Coulomb interactions using the Ewald summation method [14]). The Voronoï tessellation procedure has been straightforwardly adapted to this two component system and it is worth noting that we did not include any weighing factor to distinguish silicon from oxygen atoms [13]. The estimated value for the glass transition temperature [11, 12, 13] is K, subsequently larger than the experimental one partly because of the very fast cooling rate (2.3 1014 K/s) imposed by numerical calculation limitations. But the value of is consistent with its dependence with the cooling rate proposed by Vollmayr et al. [11] in which a Vogel-Fulcher dependence of the relaxation time of the system on the temperature is assumed. As in [13], our silica system consists of 216 silicon and 432 oxygen atoms confined in a cubic box of edge 21.48Å corresponding to a density close to the experimental one. In the following the soft sphere and silica systems will be called LS and BKS, respectively.
The purpose of the present work is to study the influence of the sample history on the low temperature structural properties of our two model glasses. To achieve this goal we follow in both cases a very simple modus operandi, which is illustrated in Fig. 1 in the LS case. We start from well equilibrated liquid samples at a well defined temperature (point A). We have chosen K in the LS case and 7000K in the BKS case. At this point two paths can be followed : either the liquid is quenched to an intermediate temperature (point B) then relaxed in a microcanonical ensemble during a time (point C’) and finally quenched to zero temperature (point D) or the liquid is quenched to 0K directly (point C) relaxed during and finally cooled to 0K (point D). This last cooling procedure is necessary because of the slight temperature increase following the direct quench to 0K since our system evolves at constant energy. From a structural point of view we have checked that this short quench is not really necessary but we have included it anyway in the second path to have a unique final state (point D).
III. SOFT-SPHERE GLASS
In the LS case, the quenching rate has been chosen equal
to the “ideal” quenching rate of K/s for which the glass
stability at 0K compared to the crystalline state has been shown to
be maximum [8] and the local structure at point D has been
studied using the fraction of pentagonal faces
of the Voronoï cell attached to each particle. We have previously
shown that this parameter is a very sensitive tool : a high value of
(typically 0.45) is a sign of strong icosahedral order,
characteristic of amorphous metallic glasses, while a small
value of (0.2) indicates the onset of crystal nucleation.
Indeed, depending on , one has to be careful in order to
distinguish between pure glassy state relaxation and recrystallization effects. Here we have considered two different values of : 100 and 300 ps.
These values of should be compared to the value of the typical
relaxation time of the system, . This relaxation time
depends on the quenching rate. It is generally admitted that the system falls
out of equilibrium when its relaxation time is on the order of the time scale
of the cooling process i.e. ps where is the effective cooling rate deduced from Fig.1. The
values of used in our study are therefore large enough to permit
a complete relaxation of the systems for . Of course this is no more the case in the solid phase.
Concerning , for each sample we saved configurations (positions
and velocities) along the quench at fixed time intervals corresponding
approximately to a difference of temperature of 2K. The corresponding
results have then been averaged over ten different samples generated
from ten independent liquid configurations. It is interesting to note in Fig.1 that the amplitude of the temperature fluctuations during the relaxation
procedure follows the usual behavior and are almost
inexistent at very low temperature.
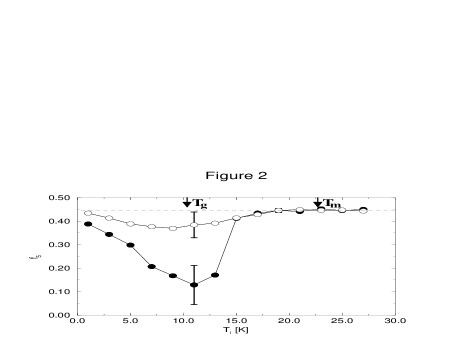
In Fig.2 we show the variation of as a function of for
and ps. The error bars show the temperature
dependent dispersion of our statistical ensemble containing ten
samples.
The first information concerns the high temperature behavior. Fig. 2
points out that if is above a temperature K
(lower than ), the
structure obtained at 0K is the same whichever path the system
followed during the quench.
This structure is symbolically represented in Fig.2 by the horizontal
dashed line. Indeed the points for K lie
nicely on this line as well as the extrapolated value for
(due to averaging, the value can not be reached exactly).
This structure is without any doubt a glassy arrangement and
exhibits a value of close to 0.45 which is a sign of strong
icosahedral local order. This first
information tells us that the low temperature structure following the
quench will be the same whatever the initial
liquid temperature is, as long as it is above . In the picture
representing the whole system as a point evolving on a complex
multi-valleyed energy “surface”[15], it means that as long
as the temperature is above , the kinetic energy of the system
is greater than all the energy barriers on that surface. Therefore if
the system explores the whole configuration space and the
low temperature sample does not depend on . From a purely practical
point of view it means also that quenches from the liquid state can be started
at temperatures just above the melting temperature without the system
remembering the characteristics of this liquid state.
The curves in Fig.2 depart from the horizontal dashed line (which
represents in a sense the “reference” structure) for below
K. It is
interesting to note that the two curves
corresponding to the two values of are superimposed
down to K. Then these two curves split and exhibit
a minimum for K. This minimum is close to
for ps and is much lower for ps (
). This is a direct consequence of the relaxation,
the system after ps being on its way to the equilibrium
configuration reached after ps. What is the meaning of this
minimum ? As said earlier a small value of is a sign of
the onset of crystallization. Moreover looking at the results
obtained for the individual samples it appears that some systems
exhibit values of as small as indicating an almost
perfect crystalline character. This can also be verified by direct
visualization of these samples. These results indicate that if
is chosen close to the glass transition temperature
(K), the propensity to crystallize is maximum. This means that
our model glass exhibits a maximum of instability with respect to
the crystalline state when its temperature is close to . Below
, increases again and the low temperature glass stability
is recovered as shown previously for this quenching rate [8].
The fact that the tendency to crystallize increases when
increases up to can be explained
using the same kinds of arguments than the ones developed in [8].
When increases, the local density fluctuations increase and
therefore the probability to find crystal germs in
the samples increases. Of course, as in [8],
this explanation remains qualitative since it does not take
into account the ability of the existent germs to grow.
To explain the existence of a minimum around in the curve
i.e. that the stability increases when increases above ,
one can argue that the crystal germ nucleation is now
outweighed by the fact that the energy difference between the
super-cooled state and the crystal state increases, making the
crystallization process more difficult to happen. Let us discuss again in terms of relaxation times. When crystal nucleation occurs the nucleation rate has to be taken into account introducing an extra time scale, .
is a very rapidly varying, non monotonous function of the temperature: it first decreases as T is lowered from the liquid state, due to the decrease in the free energy barrier and then increases again due to the liquid becoming more sluggish. This variation is shown in the so-called “TTT” diagrams [16]. The curves in Fig.2 can then be interpreted in the following way: the waiting time
ps is always smaller than while ps becomes larger than between 12.5 and 15K. Hence the samples relaxed at K exhibit crystal nucleation.
The maximum crystalline order is reached when
the nucleation rate is maximum i.e. around [16].
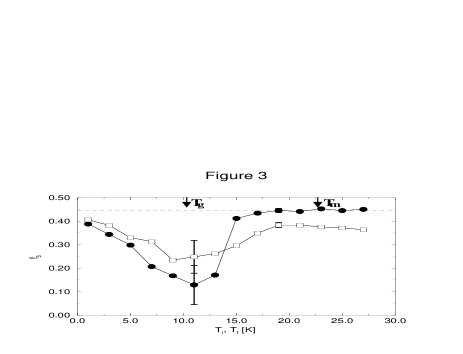
When the curves in Fig. 2 depart from the horizontal dashed line, it means that the glass “remembers” its past history and has a different structure depending on the path (ABC’D or ACD) which it followed during the quench. Nevertheless most of these differences are due to recrystallization effects which are interesting but are not aging effects (the term aging was in fact introduced to “distinguish glassy state relaxation from other time-dependent processes such as recrystallization”[1]). To make this distinction we report in Fig.3 the variation for ps of as a function of (full circles) but also as a function of (open squares). is the temperature of the system at point C’ in Fig.1. It corresponds to the final temperature after the waiting time and can be compared directly to the temperature used in the work done on the Lennard-Jones glass [4]. As can be seen in Fig.3, these temperatures are almost identical which permits to compare the s in the system at C’ and D. The difference between these two states is an additional quench to lower the temperature from to 0K. In fact the time spent during this quench can be viewed as an extra relaxation time. Therefore if the system evolves towards a crystalline state this supplemental relaxation time should lead to a decrease of the s at D compared to the results obtained at C’. In Fig.3 this is the case for temperatures between 2K and the crossover temperature . This indicates that the departure from the reference structure in that temperature range is simply due to crystallization effects. In the liquid region for temperatures above the smaller values of at are a consequence of thermal effects [17] and therefore it is expected that once the system is cooled down the values of increase towards the values obtained in the reference structure. Let us now examine the last temperature interval which goes from to . In Fig. 3 we see that the additional relaxation time induces an increase of the s in that temperature region (as an example at K, is equal to 0.28 at C’ while at D ). Therefore no onset of crystallization is present in the samples. On the contrary the additional quench makes them even more amorphous. Nevertheless in that temperature interval the curve of as a function of is not superimposed with the horizontal dashed line. Therefore the glassy structures obtained are different from the reference structure indicating the effect of the history on the local structure of the amorphous phase. The differences are admittedly small but they exist and are larger than the error bars in that temperature range. This effect exists between and i.e. roughly in the supercooled liquid region. It may exist also at lower temperatures but to us it will remain hidden by the recrystallization effects. In that temperature region the system does not explore the whole configuration space anymore and therefore the glassy systems obtained are different from the ones obtained at higher temperatures. Locally they appear less disordered ( is smaller than the value obtained for the reference structure) because the system has not access to the full variety of possible configurations but it remains amorphous. In fact we have a picture of the configurational space corresponding to in which the crystalline ground state is not accessible and which leads to glassy systems structurally different from the reference structure. This difference is quantified in Fig. 3.
IV. SILICA GLASS
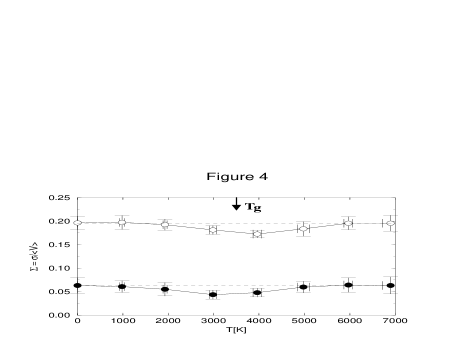
In the BKS case, the quenching rate has been chosen equal to 2.3 1014K/s and a unique relaxation time ps (corresponding to 60000 timesteps) has been considered. This choice for results from a balance between an upper limit imposed by our computing facilities and a lower limit necessary to obtain detectable effects, even after averaging over ten independent samples, as we did here. Also this value of is nearly three times larger than the typical relaxation time of the system, ps, which permits a complete relaxation of the samples during the waiting time for . The difficulty in obtaining these results is rewarded by the certitude that in the BKS case no crystallization tendency has ever been seen [11, 12, 13]. To detect the structural modifications in the case of vitreous silica we can no more make use of the parameter since it has a significance only for amorphous monoatomic glasses with spherical symmetry. Here we have chosen to present the standard deviations and of the Voronoï cell volumes for the oxygen and silicon atoms over the whole sample. In fact we have calculated the dimensionless quantities and in which the standard deviation has been divided by the corresponding averaged cell volume. The standard deviation of the cell volumes is a direct measure of the local density fluctuations around a given atom. As shown in a recent study [13] this quantity decreases when lowering the temperature from the liquid state and it is possible to extrapolate it to zero at 0K as if the system would try to reach a crystalline state. This decrease slows down when becomes lower than the glass transition temperature , and finally the standard deviations saturate to a non zero value at 0K, typical of glassy disorder. Therefore the lower the ’s are, the closer to an “ideal” glassy state the considered system is (as long as there is no crystallization). The variation of as a function of is plotted in Fig. 4. Note that is smaller than which reflects a larger disorder around the oxygen atoms, in agreement with the fact that the tetrahedral arrangement around the silicon atoms is quite well preserved, even in the liquid or amorphous states. In the case of silica also, the data obtained for a sufficiently large temperature (K) correspond to the one obtained for K (represented by the horizontal dashed lines in the figure) within the error bars. The small but significant data departure from the dashed line in the whole range is maximal when is chosen close to , similar to the behavior observed in the soft-sphere glass. How can this departure be interpreted in the case of silica in which no crystallization occurs ? For a strong glass former, at sufficiently low temperature, the characteristics of a sample depend on the history of the sample (quenching rate, relaxation time) as shown previously [11]. Therefore we expect that the local structure of our silica glass depends on and this is indeed the case as shown quantitatively in Fig. 4. Nevertheless in that point of view the shape of the curve needs to be explained: why is there a minimum close to ? For temperatures below , in the solid phase, the structural relaxation time exceeds by far ps and therefore our waiting time is not sufficient to permit a complete relaxation of the systems and the situation gets worse as the temperature decreases. This explains why the curves in Fig.4 converge towards the reference lines at low temperature. At , ps and the waiting time is sufficient to let the systems relax closer the underlying ideal glassy structure (with a smaller ). In terms of energy landscapes, at the system has enough kinetic energy to overcome the barriers separating the metastable state characteristic of the considered quenching rate from the lower lying states, during the waiting time. At a higher temperature, the system explores more phase space during the time and therefore gets trapped after the quench in a state close to the metastable state characteristic of the cooling rate. With still higher temperatures, the system explores the same energy landscape during the waiting time and the low temperature structure (after the quench) is just a reflection of the fast cooling rate. The minimum in the curves in Fig.4 indicates that the structure obtained by stopping the quench to perform a long relaxation period at a temperature close to is closer to the ”ideal” glassy structure, since it corresponds to lower values for the standard deviations of the cell volumes than in the reference system (quenched at the same speed, but without interruption). This is consistent with the fact that, for a slower quench, the glass transition temperature would be smaller and so would be the standard deviations of the cell volumes (which have been shown to decrease with decreasing temperature in the liquid phase [13]). In practice, to obtain the same result, it is however more efficient to stop the quench and perform a relaxation at , which is the procedure followed by the authors in [12], than to perform a slower purely linear quench.
V. CONCLUSION
This study combining MD simulations and the Voronoï tessellation
in model glasses provides an other point of view in the study
of the influence of the glass history on its properties. Here we tackle
this question from the structural point of view.
First of all the study as a function of temperature of the local
structure in soft-sphere samples has shown that this model glass exhibits
a maximum instability with respect to the crystalline state at
.
We have then shown that the structure of this model glass
depends on its history. Indeed when a system is cooled
to an intermediate temperature, relaxed and then quenched to
zero temperature (and if it stays amorphous) its structure is
different from the structure obtained by a direct quench to 0K
followed by the same relaxation period if the intermediate
temperature is chosen roughly in the supercooled liquid region.
Secondly we did the same kind of study in a model silica glass where
the crystallization phenomenon is absent. In that case we find also,
as expected, a dependence of the local structure on the glass history.
This dependence is maximum when the intermediate temperature is close
to .
These results show that the Voronoï cell characteristics
permit to clearly distinguish recrystallization from “true” glassy
state relaxations in the case of the soft-sphere glass. In the case of
silica an extension of this work would be to check if the change of
the local structure observed close to is detectable in other quantities.
Acknowledgements:
It is not often that one can thank the referees for enlighting comments and
suggestions about the physics of a paper. This was our experience for this
publication and we want to stress it here. Therefore it is a pleasure
to thank also Pr. A. Fuchs for his editorial work on this article.
REFERENCES
- [1] See for example Hodge, I. M.(1995). ” Physical Aging in Polymer Glasses”, Science, 267, 1945 and references therein.
- [2] Lundgren, L., Svedlindh, P., Nordblad, P. and Beckman, O. (1983). ”Dynamics of the relaxation time spectrum in a CuMn spin-glass”, Phys. Rev. Lett., 51, 911; Chamberlin, R. V. (1984).”Time decay of the thermoremanent magnetization in spin-glasses as a function of the time spent in the field-cooled state”, Phys. Rev. B, 30, 5393; Lederman, M., Orbach, R., Hammann, J., Ocio, M. and Vincent, E. (1991). ”Dynamics in spin glasses”, Phys. Rev. B, 44, 7403; Lefloch, F., Hammann, J., Ocio, M. and Vincent, E. (1992). ”Can aging phenomena discriminate between the droplet model and a hierarchical descrition in spin glasses?”, Europhys. Lett., 18, 647; Vincent, E., Bouchaud, J. P., Hammann, J. and Lefloch, F. (1995). ”Contrasting effects of field and temperature variations on ageing in spin glasses”, Phil. Mag. B, 71, 489.
- [3] Hochli, U. T., Knorr, K. and Loidl, A. (1990). ”Orientational glasses”, Adv. Phys., 39, 405; Vugmeister, B. E. and Glinchuk, M. (1990). ”Dipole glass and terroelectricity in random-site electric dipole systems”, Rev. Mod. Phys., 62, 993; Alberici, F., Doussineau, P. and Levelut, A. (1997). ”New results about aging in an orientational glass”, Europhys. Lett., 39, 329.
- [4] Kob, W. and Barrat, J.L. (1997). ”Aging Effects in a Lennard-Jones Glass”, Phys. Rev. Lett., 78, 4581.
- [5] Koper, G. J. and Hilhorst, H. J. (1988). ”A domain theory for linear and non linear aging effects in spin glasses”, em J. Phys. (Paris) 49, 429; Bouchaud, J.P. (1992). ”Weak ergodicity breaking and aging in disordered systems”, J. Phys. I (France), 2, 1705; Bouchaud, J.P., Cugliandolo, L. F., Kurchan, J. and Mezard, M. (1996). ”Mode-coupling approximations, glass theory and disordered systems”, Physica, 226A, 243.
- [6] Jund, P., Caprion, D. and Jullien, R. (1997). ”The glass transition in a simple model glass: numerical simulations”, Mol. Sim., 20, 3.
- [7] Laird, B. and Schober, H.R. (1991). ”Localized low-frequency vibrational modes in a simple model glass”, Phys. Rev. Lett., (1991) 66, 636.
- [8] Jund, P., Caprion, D. and Jullien, R. (1997). ”Is There an Ideal Quenching Rate for an Ideal Glass?”, Phys. Rev. Lett., 79, 91.
- [9] Hoover, W. G., Young, D.A. and Grover, R. (1972). ”Themodynamic properties of the fluid and solid phases for inverse power potential”, J. Chem. Phys., 56, 2207.
- [10] van Beest, B. W. H., Kramer, G. J. and van Santen, R.A. (1990). ”Force fields for silicas and aluminophosphates based on ab initio calculations”, Phys. Rev. Lett., 64, 1955.
-
[11]
Vollmayr, K., Kob, W. and Binder, K. (1996). ”Cooling-rate effects in amorphous silica: A computer-simulation study”, Phys. Rev. B, 54, 15808.
- [12] Taraskin, S.N. and Elliott, S.R. (1997). ”Phonons in vitreous silica: Dispersion and localization”, Europhys. Lett, 39, 37.
- [13] Jund, P. and Jullien, R. (1998), ”The glass transition in a model silica glass: evolution of the local structure”, to be published in Phil. Mag. A.
- [14] Allen, M.P. and Tildesley, D.J. in Computer simulation of liquids, Oxford University Press, New-York (1990).
- [15] An exhaustive review is given in: Angell C.A. (1995). ”Formation of glasses from liquids and biopolymers”, Science, 267, 1924.
- [16] Zarzycki, J. in Les verres et l’état vitreux, Masson, Paris (1982).
- [17] Jund, P., Caprion, D. and Jullien, R. (1997). ”Local investigation of the glass transition: molecular dynamics and Voronoï tessellation, Europhys. Lett., 37, 547.