Global and Local Measures of the Intrinsic Josephson Coupling in Tl2Ba2CuO6
Nature 395 (1998) 360-362, 24 september 1998
A.A. Tsvetkov*$, D. van der Marel*, K.A. Moler&, J. R. Kirtley+, J. L. de Boer*, A. Meetsma*, Z.F. Ren#,
N. Koleshnikov, D. Dulic*, A. Damascelli*, M. Grüninger*, J. Schützmann*, J.W. van der Eb*,
H. S. Somal*, and J.H. Wang#.
* Materials Science Centre, University of Groningen, 9747 AG Groningen
$ P. N. Lebedev Physical Institute, 117924 Moscow, Russia
& Department of Physics, Princeton University, Princeton, NJ 085544
+ IBM T. J. Watson Research Center, P.O. Box 218, Yorktown Heights, NY 10598
# Department of Chemistry, Suny at Buffalo, Buffalo, NY 14260-3000
Institute of Solid State Physics, Russian Academy of Sciences, Chernogolovka
One leading candidate theory of the high-temperature superconductors in the copper oxide systems is the Inter-Layer
Tunneling (ILT) mechanism[1]. In this model superconductivity is created by tunneling of electron pairs between the copper
oxdide planes- contrasting with other models in which superconductivty first arises by electron pairing within each plane. The
ILT model predicts that the superconducting condensation energy is approximately equal to the gain in kinetic energy of the
electron pairs due to tunneling. Both these energies can be determined independently[2-4], providing a quantitative test of the
model. The gain in kinetic energy of the electron pairs is related to the interlayer plasma energy, , of electron pair
oscillations, which can be measured using infrared spectroscopy. Direct imaging of magnetic flux vortices also provides a test[5],
which is performed here on the same samples. In the high-temperature superconductor Tl2Ba2CuO6, both the sample
averaging optical probe and the local vortex imaging give a consistent value of = 28 cm-1 which, when combined with the
condensation energy produces a discrepancy of at least an order of magnitude with deductions based on the ILT model.
In the ILT model the normal state is different in nature from the traditional Landau Fermi liquid. As a result coherent transport of single charge
carriers between the planes is strongly inhibited in the normal state. In the superconducting phase tunneling of pairs is possible, and the
superconducting condensation energy (Econd) in the ILT model is precisely the gain in kinetic energy (EJ) due to the tunneling of those pairs: EJ
= Econd. The number is of order 1 when ILT is the only active pairing mechanism[3].
With conventional mechanisms, although usually ,
there is no prediction for that is free from materials parameters. A crucial point in this discussion is, that both Econd and EJ are experimentally
accessible quantities, thus allowing the experimental verification of the ILT hypothesis. Econd can be measured
from the specific heat[6]. EJ can
be determined by measuring the interlayer (Josephson) plasma frequency[7].
For this work, we used two kinds of samples: single crystals and epitaxial thin films of Tl2Ba2CuO6. The crystals have a transition temperature
of 82K and transition width (10) of 13 K, as determined by bulk SQUID susceptibility. Using 4-circle X-ray diffraction we verified that the
material belongs to the tetragonal I4/mmm space group, with (for the crystals) lattice parameters a=b=3.867 ,
and c=23.223 . The films
have Tc=80K as determined by DC resistivity, and c=23.14 . Both types of samples have relatively large physical dimensions
perpendicular to
the c-axis, corresponding to the conducting copper oxide planes (50 mm2 for the thin films, and 1 mm2 for the crystals). They have small
dimensions along the c-axis ( 1 m for the thin films, and 50 m for the crystals).
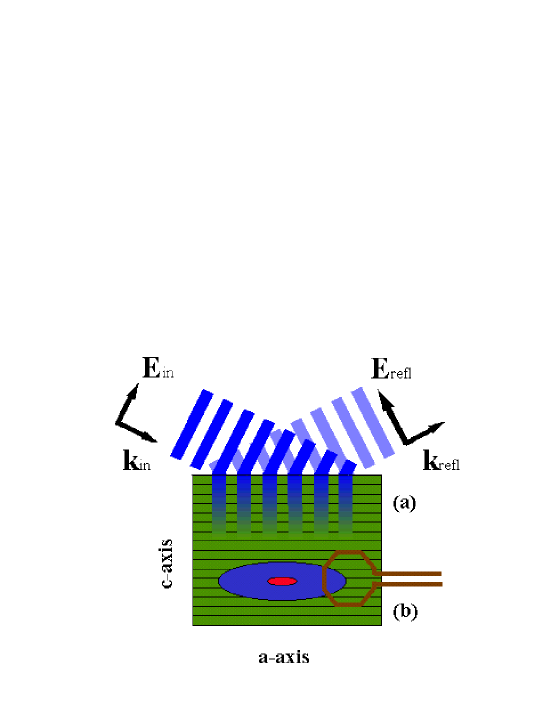
To determine the plasma resonance we measure the reflection coefficient of infrared
radiation incident on the ab-plane at a large angle (80o)
with the surface normal[8]. A sketch of the experiment is presented in Fig. 1. In the case of the single crystals the reflected light drops below our
detection limit if the wavelength exceeds 0.2 mm (i.e. for ) due to diffraction. Using thin films we were able to extend this range
to 20 cm-1. The electric field vector of the radiation is chosen parallel to the plane of reflection, resulting in a large component
perpendicular to
the CuO2 planes. This geometry allows absorption of the light by lattice vibrations and plasma-oscillations polarised
perpendicular to the planes.
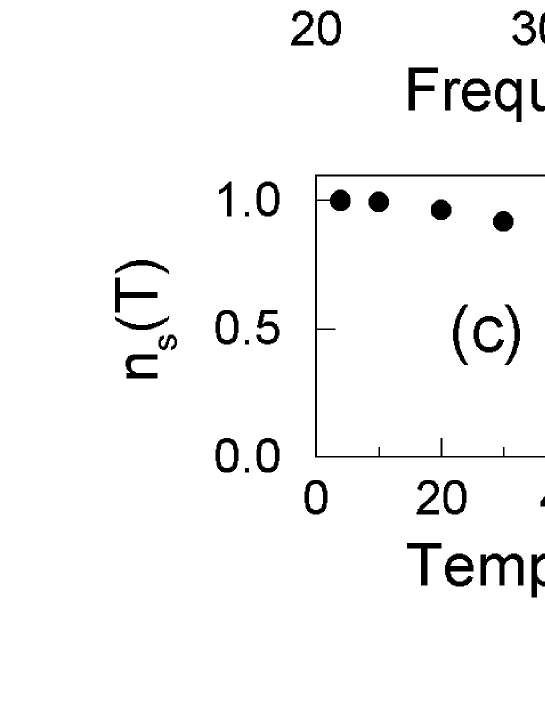
In Fig. 2a we present the single crystal and thin film reflectivity for c respectively above and below 150 cm-1. All prominent absorption lines for frequencies above 50 cm-1 correspond to infrared active lattice vibrations, which show no strong temperature dependence. In the 4K spectrum we observe a clear absorption at 27.8 cm-1. This resonance exhibits a strong red shift upon raising the temperature, as displayed in Fig. 2b. Above 70 K it has shifted outside our spectral window. In Fig. 2c we also present the temperature dependence of of the resonance position. This temperature dependence extrapolates to zero at Tc, which indicates, that it is a plasma resonance of the paired charge carriers. We therefore attribute this absorption to a Josephson plasmon, a collective oscillation of the paired charge carriers perpendicular to the coupled superconducting planes[7]. For a purely electronic system the supercurrent density along the c-axis determines the Josephson resonance frequency, . Because in the present case the Josephson plasma resonance is located at a frequency below the infrared active lattice vibrations, the corresponding dynamical electric field is screened by the ions and the lattice vibrations, characterised by a dielectric constant ecs. As a result we observe the Josephson resonance at a reduced frequency . We performed a full optical analysis of these spectra in the spectral range from 20 to 6000 cm-1 using Fresnel’s equations for oblique angle of incidence reflection of anisotropic optical media. This way we were able to extract the dielectric function ecs from our data. For frequencies below 40 cm-1, . We therefore obtain .
An independent experimental measure of the interlayer coupling is provided by a direct measurement of . Here we employ the fact that
vortices which are oriented parallel to the planes, called interlayer Josephson vortices, have a characteristic size
along the planes and
perpendicular to the planes[9]. In order to determine directly, we used a scanning Superconducting QUantum Interference Device (SQUID)
microscope10 to map the magnetic fields perpendicular to an a-c face at 4 K (Fig. 1b) [5]. The crystal was cooled in a magnetically shielded
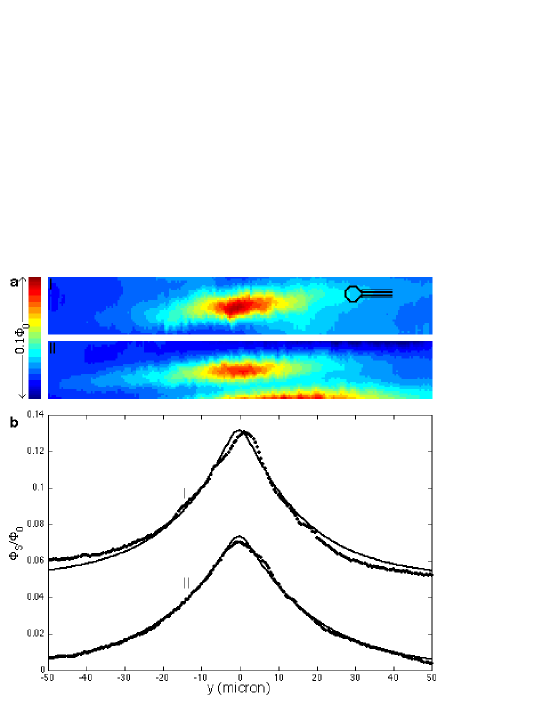
cryostat with a residual magnetic field of a few milligauss, resulting in the presence of a few isolated trapped vortices (Fig. 3a). The jitter
apparent in this image is due to the mechanical scanning mechanism used in our SQUID microscope. With an L = 4 mm octagonal pickup loop,
the vortices were resolution-limited along the c direction (), but not along the a direction ().
Fitting the longitudinal cross-sections (Fig. 3b) to the functional form for the magnetic fields of an interlayer Josephson vortex[9] convoluted with
the shape of the pickup loop[5,10], gave the results = 17 4 mm and = 19 1 mm for these two vortices. The statistical error bars were
determined using a criterion of doubling of the variance from the least-squares value, but systematic errors from the background and the shape
of the pickup loop, and the effect of the surface on the shape of the vortex, which may be as large as 30vortices in three pieces cut from a large single crystal, which was part of the mosaic used to make the measurements in Fig. 1a. The vortices in
all three pieces confirm the plasma resonance frequency of 28cm-1.
We are now ready to determine EJ using the expression[7] ,
where is the distance between planes (11.6 ), is the cell
parameter (3.87 ), is the Planck constant,
and is the charge of the pairs. The result is per formula unit. For Tl2Ba2CuO6
the measured value of Econd is 100 per formula unit[6]. Hence , which is clearly at variance with the notion
that condensation in the high-Tc superconductors is due to the gain in kinetic energy of the pairs (EJ) in the superconducting state.
Our observation of the same value of with a local probe (scanning SQUID) and a sample averaging probe (grazing reflectivity) demonstrates
that we measure the intrinsic Josephson coupling, rather than a coupling determined by isolated metallurgical defects. The body of data
presented in this paper provides strong support for the interpretation of both the Josephson plasma resonance and the interlayer Josephson
vortices as intrinsic properties of Tl2Ba2CuO6. One of the key predictions of the ILT model,
that =EJ/Econd is of order 1, is far outside the range of our experiments, which give =0.0024.
Received 13 March, accepted 29 june 1998
References
- [1] P. W. Anderson, The Theory of Superconductivity in the high Tc Cuprates (Princeton University Press, Princeton, NJ, 1997).
- [2] P. W. Anderson, Interlayer Tunneling Mechanism for High-Tc Superconductivity: Comparison with c Axis Infrared Experiments, Science 268, 1154-1155 (1995).
- [3] A. J. Leggett, Interlayer Tunneling Models: Implications of a Recent Experiment, Science 274, 587-590 (1996).
- [4] D. van der Marel, J. Schhützmann, H.S. Somal, and J.W. van der Eb, Electrodynamical properties of High- Tc superconductors studied with polarized angle resolved infrared spectroscopy, Proceedings of the 10th Anniversary HTS Workshop on Physics, Materials & Applications p 357 (World Scientific, Rivers Edge, NJ, 1996).
- [5] K.A. Moler, J.R. Kirtley, D.G. Hinks, T.W. Li, and M. Xu, Images of interlayer Josephson vortices in Tl2Ba2CuO6+d, Science 279, 1193-1195 (1998).
- [6] J. Loram, K.A. Mirza, J.M.Wade, J.R. Cooper, and W.Y. Liang, The Electronic Specific Heat of Cuprate Superconductors, Physica C 235, 134-137 (1994).
- [7] W.E. Lawrence and S. Doniach, Theory of Layer Structure Superconductors, Proceedings of the 12th International Conference on Low Temperature Physics, p. 361-362 (Academy Press, Kyoto, 1971).
- [8] J. Schützmann, H.S. Somal, A.A. Tsvetkov, D. van der Marel, G. Koops, N. Koleshnikov, Z.F. Ren, J.H. Wang, E.Brh ck and A.A. Menovsky, Experimental Test of the Inter-Layer Pairing Models for High-Tc Superconductivity Using Grazing Incidence Infrared Reflectometry, Phys. Rev. B 55 11118-11121 (1997).
- [9] J. R. Clem and M. W. Coffey, Viscous flux motion in a Josephson-coupled layer model of High-Tc superconductors, Phys. Rev. B 42, 6209-6216 (1990).
- [10] J. R. Kirtley , M.B. Ketchen, K.G. Stawiasz, J.Z. Sun, W.J. Gallagher, S.H. Blanton, and S.J. Wind, High-resolution scanning SQUID microscope, Appl. Phys. Lett. 66, 1138-1140 (1995).
- [11] P.W. Anderson, c-Axis Electrodynamics as Evidence for the Interlayer Theory of High-Temperature Superconductivity, Science 279, 1196-1197 (1998).
Acknowledgements. We thank M. Bhushan and M. Ketchen for assistance with the development of the scanning SQUID microscope. We gratefully acknowledge P. W. Anderson for
stimulating comments, and P. Stamp for carefully reading the manuscript. KAM acknowledges the support of an R.H. Dicke postdoctoral fellowship. This work was supported by the
Netherlands Foundation for Fundamental Research (FOM) with financial from the Nederlandse Organisatie voor Wetenschappelijk Onderzoek (NWO). AAT acknowledges the support
by NWO, RVBR and the Russian Superconductivity Program. The work performed at SUNY-Buffalo is partly supported by NYSERDA.
Correspondence and requests for materials should be addressed to Prof. Dr. D. van der Marel, electronic mail: D.van.der.marel@ phys.rug.nl