Structural evidence for the
continuity of liquid and glassy
water
An open question is whether the liquid and glassy phases of water are thermodynamically distinct or continuous [1]. Here we address this question using molecular dynamics simulations in comparison with neutron scattering experiments to study the effect of temperature and pressure on the local structure of liquid water. From both simulations and experiments, we find that the liquid structure at high pressure is nearly independent of temperature, and remarkably similar to the known structure of the high-density amorphous ice (HDA). Further at low pressure, the liquid structure appears to approach the experimentally-measured structure of low-density amorphous ice (LDA)as temperature decreases. These results are consistent with continuity between the liquid and glassy phases of H2O.
The structure of liquid water has been well-studied at ambient pressure by a variety of experimental and simulation techniques. It has been recognized that each water molecule is typically hydrogen bonded to four neighboring molecules in a tetrahedral arrangement, leading to an open bond network that can account for a variety of the known anomalies of water [1]. More recently, the effect of pressure on both the structure and the hydrogen bond network of liquid water has been studied experimentally [2, 3, 4] and by simulations using a variety of potentials, including the ST2 potential [5, 6, 7, 8], the MCY potential [9], the TIP4P potential [7, 8, 10, 11, 12], and the SPC/E potential [13, 14]. Furthermore, understanding the effects of pressure may be useful in elucidating the puzzling behavior of liquid water.
In particular, three competing “scenarios” have been hypothesized to explain the anomalous properties of water: (i) the existence of a spinodal bounding the stability of the liquid in the superheated, stretched, and supercooled states [15, 16]; (ii) the existence of a liquid-liquid transition line between two liquid phases differing in density [6, 7, 8, 12, 17, 18]; (iii) a singularity-free scenario in which the anomalies are related to the presence of low-density and low-entropy structural heterogeneities [19].
Here, we present molecular dynamics (MD) simulations (Table I) of a comparatively large system of 8000 molecules interacting via the extended simple point charge (SPC/E) pair potential [24]. We find remarkable agreement with neutron scattering studies of the effect of pressure on the structure of liquid D2O [4], indicating that the SPC/E potential reproduces many structural changes in the liquid over a wide range of temperature and pressure. By comparing the simulated pair correlation functions and structure factor with our experimental data, we find that the structure of the supercooled liquid at low pressure resembles the structure of low-density amorphous (LDA) ice. At high pressure, we find that the structure of the liquid appears independent of temperature and is nearly indistinguishable from that of high-density amorphous (HDA) ice. The combined results at high and low pressure appear consistent with continuity between the liquid and glassy states of water and also with a possible liquid-liquid transition in the supercooled region of the liquid terminated by a second critical point.
We analyze the structures found in our simulations by calculating the atomic radial distribution functions (RDF) , , and . To compare the RDFs with neutron scattering measurements, we form the weighted sum
| (1) |
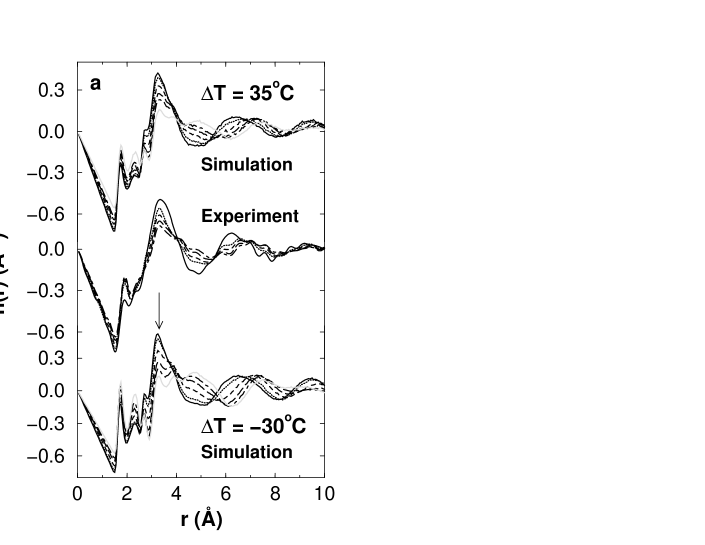
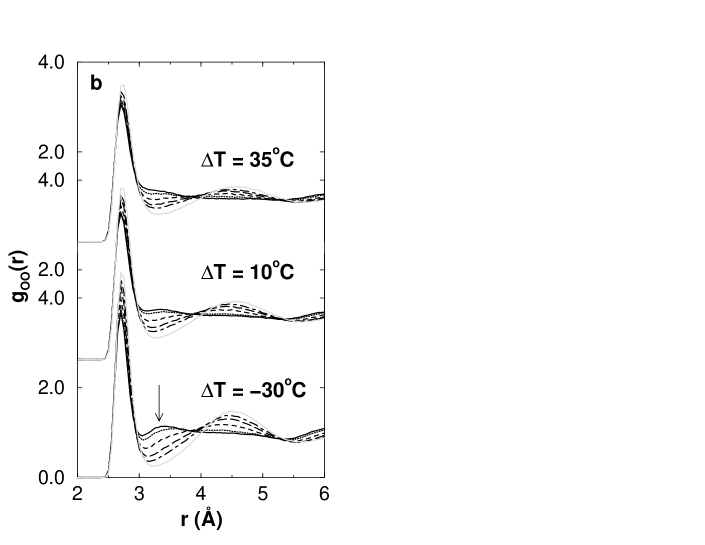
where the weighting factors are selected to coincide with experimental measurements of D2O. Experimentally, is obtained by Fourier transformation of the molecular structure factor. The dominant contributions to are the H-H and O-H (or D-D and O-D for D2O) spatial correlations, so includes relatively little contribution from oxygen-oxygen correlations. Fig. 1a shows at two of the five temperatures simulated and also compares with experimental data. The peaks centered at 1.8 Å, 2.3 Å, and 2.8 Å correspond to the O-H, H-H, and O-O intermolecular distances in the hydrogen-bonded configuration, respectively. While the magnitudes of these peaks change slightly, their ubiquity demonstrates the stability of the first neighbor ordering – namely that each molecule is typically surrounded by four molecules in a tetrahedral configuration.
We find that the peak at 3.3 Å of becomes more pronounced as increases. Examination of the individual RDFs shows that the increase at 3.3 Å can be attributed to changes in . In addition, shows a pronounced increase at 3.3 Å under pressure (Fig. 1b), but cannot account for the changes in , as the weighting factor in Eq. (1) is small [2, 3, 4]. The growth at 3.3 Å in indicates that the liquid locally has the structure of an interpenetrating tetrahedral network similar to ice VI and VII, the ice polymorphs close to the high pressure liquid, and can also be associated with the formation of clusters with structure similar to HDA [25].
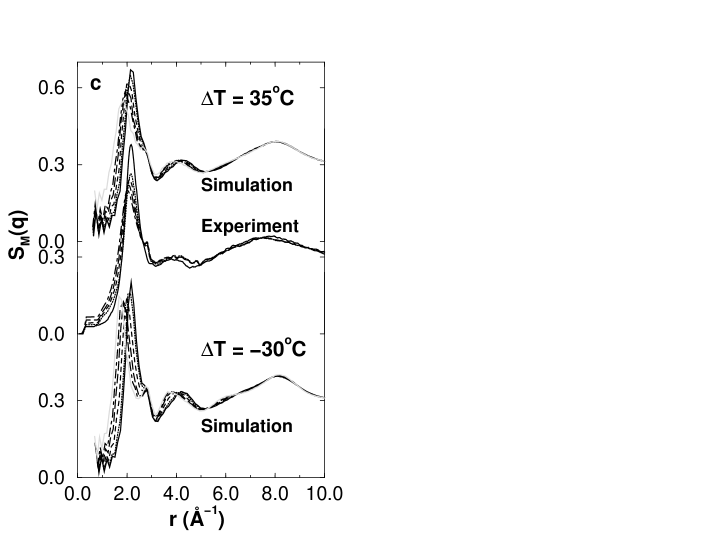
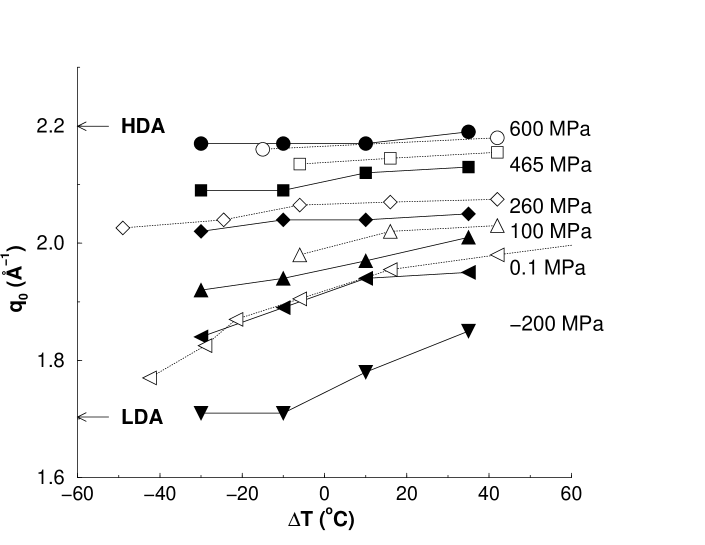
To directly compare with experimental measurements, we calculate the molecular structure factor , where and are the intramolecular and intermolecular contributions to , respectively. We calculate explicitly, as described in ref. [26], and Fourier transform to obtain . We find striking agreement between simulated and the experimental values of (Fig. 1c). In particular, the value of the first peak of shifts to larger values as increases (Fig. 2). We note the feature that as temperature is lowered: (i) for MPa, approaches the experimental value of HDA ice (2.20 Å-1), (ii) For MPa and MPa, approaches the experimental value of LDA ice (1.69 Å-1). Indeed we find the high-pressure liquid structure resembles that of HDA ice (Fig. 3a), and the low-pressure liquid structure that of LDA ice (Fig. 3b) [6, 8].
We also study the structure of the glassy phase and find that the structure of the simulated glasses strongly resembles the experimentally-measured structure of HDA and LDA solid water (Fig. 3, c and d), suggesting that the simulated glassy state points are the analogues of HDA and LDA solid water for SPC/E. Furthermore, by compression of the simulated LDA-like system, we are able to reversibly transform the structure to the HDA-like system, reminiscent of the experimentally observed reversible first-order transition of LDA to HDA under pressure [29].
These results support the postulated continuity between atmospheric pressure water and LDA ice, based on measurements of the free energy [30] and dielectric relaxation time [31] at 1 atm. Our results are also consistent with continuity between high pressure liquid water and HDA ice [4, 6, 7, 8]. Combined with the experimentally-detected first-order transition between HDA and LDA, our results are consistent with the presence the postulated second critical point in the supercooled region of the phase diagram.
Methods
We equilibrate systems of 8000
molecules interacting via the SPC/E potential to a constant temperature
and pressure by monitoring the evolution of the density and internal
energy. The SPC/E model treats water as a rigid molecule consisting of
three point charges located at the atomic centers of the oxygen and
hydrogen which have an OH distance of 1.0 Å and HOH angle of
109.47∘, the tetrahedral angle. Each hydrogen carries a charge
and the oxygen carries a charge , where
is the magnitude of the electron charge. In addition, the oxygen atoms
of separate molecules interact via a Lennard-Jones potential with
parameters Å and kJ/mol. We
adjust the temperature and pressure via the methods of Berendsen
[20] and we account for the long-range Coulomb
interactions using the reaction field technique with a cutoff of 0.79 nm
[21]. The equations of motion evolve by the SHAKE
algorithm [22] with a time step of 1 fs. We typically
simulate each state point using eight processors in parallel. We obtain
simulation speeds of approximately per particle per update.
The total simulation time is about 1000 CPU-days.
REFERENCES
- [1] Debenedetti, P. G. Metastable Liquids (Princeton Univ. Press, Princeton, 1996).
- [2] Wu, A. Y., Whalley, E. & Dolling, G. Neutron diffraction of heavy water to 15.6 kbar. Mol. Phys. 47, 603–628 (1982).
- [3] Okhulkov, A. V., Demianets, Y. N. & Gorbaty, Y. E. X-ray-scattering in liquid water at pressures of up to 7.7 kbar: Test of a fluctuation model. J. Chem. Phys. 100, 1578–1588 (1994).
- [4] Bellissent-Funel, M.-C. & Bosio, L. A neutron-scattering study of liquid D2O under pressure and at various temperatures. J. Chem. Phys. 102, 3727–3735 (1995).
- [5] Stillinger, F. H. & Rahman, A. Molecular dynamics study of liquid water under high compression. J. Chem. Phys. 61, 4973-4980 (1974).
- [6] Poole, P. H. et al. Phase behavior of metastable water. Nature 360, 324–328 (1992)
- [7] Poole, P. H. et al. Phase Diagram for Amorphous Solid Water. Phys. Rev. E 48, 4605 (1993).
- [8] Sciortino, F., Poole, P.H., Essmann, U., Stanley, H.E. Line of compressibility maxima in the phase diagram of supercooled water. Phys Rev. E 55, 727–737 (1997).
- [9] Impey, R. W., Klein, M. L. & McDonald, I. Molecular dynamics studies of the structure of water at high temperatures and density. J. Chem. Phys. 74, 647–652 (1981).
- [10] Tse, J. S. & Klein, M. L. Pressure-induced phase transformations in ice. Phys. Rev. Lett. 58, 1672-1675 (1987).
- [11] Madura, J. D., Pettitt, B. M. & Calef, D. F. Water under pressure. Mol. Phys. 64, 325–336 (1988).
- [12] Tanaka, H. A self-consistent phase diagram for supercooled water. Nature 380, 328–330 (1996).
- [13] Harrington, S. et al. Equation of state of supercooled SPC/E water. J. Chem. Phys. 107, 7443–7450 (1997).
- [14] Bagchi, K., Balasubramanian, S. & Klein, M. L. The effects of pressure on the structural and dynamical properties of associated liquids: Molecular dynamics calculations for the extended simple point charge model of water. J. Chem. Phys. 107, 8651–6567 (1997).
- [15] Speedy, R. J. & Angell, C. A. Isothermal compressibility of supercooled water and evidence for a thermodynamic singularity at -45∘C. J. Chem. Phys. 65, 851–858 (1976).
- [16] Speedy, R. J. Stability-limit conjecture: An interpretation of the properties of water. J. Phys. Chem. 86, 892-991 (1982).
- [17] Roberts, C. J., Panagiotopoulos, A. Z. & Debenedetti, P. G. Liquid-liquid immiscibility in pure fluids: Polyamorphism in simulations of a network-forming fluid. Phys. Rev. Lett. 97, 4386–4389 (1996).
- [18] Bellissent-Funel, M.-C. Is there a liquid-liquid phase transition in supercooled water? Europhys. Lett. 42, 161–166 (1998).
- [19] Sastry, S. et al. Singularity-free interpretation of the thermodynamics of supercooled water. Phys. Rev. E 53, 6144–6154 (1996).
- [20] Berendsen, H. J. C. et al. Molecular dynamics with coupling to an external bath. J. Chem. Phys. 81, 3684–3690 (1984).
- [21] Steinhauser, O. Reaction field simulation of water. Mol. Phys. 45, 335–348 (1982).
- [22] Ryckaert, J.-P., Ciccotti, G. & Berendsen, H. J. C. Numerical integration of the Cartesian equations of motion of a system with constraints: Molecular dynamics of n-alkanes.. J. Comput. Phys. 23, 327–341 (1977).
- [23] Baez, L. & Clancy, P. Existence of a density maximum in extended simple point-charge water. J. Chem. Phys. 101, 8937–9840 (1994).
- [24] Berendsen, H. J. C., Grigera, J. R. & Stroatsma, T. P. The missing term in effective pair potentials. J. Phys. Chem. 91, 6269–6271 (1987).
- [25] Shiratani, E. & Sasai, M. Molecular scale precursor of the liquid-liquid phase transition of water. J. Chem. Phys. 108, 3264–3276 (1998).
- [26] Bellissent-Funel, M.-C., Bosio, L. & Teixeira, J. The inelasticity correction for liquid water in neutron scattering. J. Phys. Condensed Matter 3, 4065–4074 (1991).
- [27] Bellissent-Funel, M.-C., Teixeira, J. & Bosio, L. Structure of high-density amorphous water. II. Neutron scattering study. J. Chem. Phys. 87, 2231–2235 (1987).
- [28] Sciortino, F. et al. Supercooled water and the kinetic glass transition. Phys. Rev. E 54, 6331–6343 (1996).
- [29] Mishima, O. Reversible first-order transition between two H2O amorphs at GPA and K. J. Chem. Phys. 100, 5910–5912 (1994).
- [30] Speedy, R. J. et al. The evaporation rate, free energy, and entropy of amorphous water at 150 K. J. Chem. Phys. 105, 240–244 (1996).
- [31] Johari, G. P. Water’s character from dielectric relaxation above its . J. Chem. Phys. 105, 7079–7082 (1996).
Acknowledgments: We thank C.A. Angell, J. Nielsen, C. Roberts, S. Sastry, F. Sciortino, and J. Teixeira for helpful discussions, and especially S. Harrington for his significant contributions to the early stages of this work. We are grateful to the Center for Computational Science at Boston University for extensive use of the 192-processor SGI/Cray Origin 2000 supercomputer. FWS is supported by a NSF graduate fellowship. The Center for Polymer Studies is supported by NSF Grant CH9728854.
| (MPa) | (∘C) | (g/cm3) | (kJ/mol) | Equilibration Time (ps) | |
|---|---|---|---|---|---|
| 600 | -47.65 | 1100 | |||
| -49.02 | 1300 | ||||
| -50.22 | 2000 | ||||
| -51.43 | 3000 | ||||
| -55.3 | 4000 | ||||
| 465 | -47.61 | 1100 | |||
| -49.05 | 1300 | ||||
| -50.24 | 1800 | ||||
| -51.49 | 2500 | ||||
| 260 | -47.59 | 550 | |||
| -49.09 | 750 | ||||
| -50.33 | 1500 | ||||
| -51.62 | 2100 | ||||
| 100 | -47.51 | 600 | |||
| -49.11 | 800 | ||||
| -50.48 | 1500 | ||||
| -51.85 | 2100 | ||||
| 0.1 | -47.42 | 600 | |||
| -49.12 | 800 | ||||
| -50.56 | 1500 | ||||
| -52.15 | 3000 | ||||
| -56.1 | 4000 | ||||
| -200 | 35 | -46.73 | 600 | ||
| -48.83 | 800 | ||||
| -50.59 | 1500 | ||||
| -52.12 | 3000 |