[
Impurity mediated nucleation in hexadecane-in-water emulsions
Abstract
We report detailed nucleation studies on the liquid-to-solid transition of hexadecane using nearly monodisperse hexadecane-in-water emulsions. A careful consideration of the kinetics of isothermal and nonisothermal freezing show deviations from predictions of classical nucleation theory, if one assumes that the emulsion droplet population is homogeneous. Similar deviations have been observed previously[4]. As an explanation, we propose a novel argument based on the dynamic generation of droplet heterogeneity mediated by mobile impurities. This proposal is in excellent agreement with existing data.
pacs:
PACS numbers: 82.60.Nh, 64.60.Qb,44.60.+k,82.70.Kj]
I Introduction
The use of micron-sized emulsified droplets for nucleation studies of the liquid-to-crystal transition is a well established technique. Vonnegut [2] pioneered this concept in the first half of this century and others have used it to study a variety of materials[3, 4, 5, 6]. The advantage of using a large ensemble of independent nucleation sites to measure the stochastic process of nucleation is obvious. An additional advantage is that the effects of crystal growth are virtually eliminated. On the time scale of the nucleation measurements, the growth time for each droplet is instantaneous. Furthermore, because experiments are conducted in a range where the probability of two nucleation events per drop is small, it is a simple matter to equate the total number of crystallized droplets with the number of nucleation events.
The role of impurities on nucleation in emulsion studies is not obvious. Clearly, one possible role is to act as heterogeneous nucleation sites. Both Turnbull[3] and Perepezko[7] have discussed this. A signature of heterogeneous nucleation is a small difference between the melting temperature and the onset of nucleation. For example, in mercury, Turnbull showed that changes in surfactants could increase the undercooling from 5 ∘C to 60 ∘C, with the smaller values attributed to the effects of heterogeneous nucleants either on the surface or within the volume of the droplets. It is well known that emulsification tends to increase the undercooling over that of bulk liquids, but a simple calculation shows that for this to result from isolation of the heterogeneous catalysts they must be present at extremely low levels (cf. Sec. V). This seems to suggest that most impurities are not effective nucleating agents[6].
A second role of impurities is to lower the melting point. Perepezko[7] has shown in his studies of metals that as the liquidus temperature drops due to alloying, there is a corresponding decrease in the nucleation temperature. Hence an approximately constant value of the undercooling is observed. These effects can be large, for example in the lead-antimony system the liquidus and nucleation temperatures both decline by about 75 ∘C as the antimony content increases up to atomic percent. The effect of a typical impurity level (mole fraction ) will of course be much smaller. However, the nucleation rate is strongly temperature dependent. For example, in n-alkanes (CnH2n+2, henceforth abbreviated C), the nucleation rate changes by a factor of 5000 per ∘C[4]. We show in this work that impurity levels of even a few percent cause a significant change in nucleation behavior. This influence must be accounted for to extract an accurate value of the nucleation rate.
Size of the emulsion droplets also plays a key role in nucleation studies. In homogeneous nucleation, the nucleation rate is proportional to the volume of the droplets. Typically, the determination of the size distribution for the emulsions is a large source of error in nucleation rate measurements[4]. Advances in emulsion synthesis techniques now makes it possible to create nearly uniformly sized emulsion particles. The average deviation in diameter from the mean size is only from to [8, 9, 10]. By using such emulsions with narrow size distributions, the determination of the rate constant for any given emulsion radius is considerably improved. Also, this makes it possible to better test the predicted volume scaling of the nucleation rate.
In this paper, we report the results of a refined experimental and theoretical investigation of the nucleation rate in emulsified hexadecane (C16). The quality of experimental data has been significantly improved by using nearly monodisperse emulsions in a well controlled thermal environment and by using x-ray scattering to accurately monitor the volume of nucleated droplets during crystallization. Data were obtained for both fixed and linearly increasing undercooling as a function of time, henceforth referred to as isothermal nucleation and linear cooling, respectively. Thermodynamic melting curves have also been obtained for the samples in order to assess the influence of impurities introduced during the emulsification procedure. The theoretical analysis has concurrently been refined to account for the entire time-dependence of the solid fraction as a function of time, rather than just matching some characteristic time. This careful analysis revealed deviations from a simple scenario involving a uniform ensemble of independent nucleation events. By systematically relaxing the assumptions in this description, we have concluded that the most probable cause of the observed deviations is a novel mechanism which involves the transport of impurities expelled from nucleated droplets to the remaining liquid droplets. This transport subsequently increases the impurity concentration of these remaining droplets and reduces their nucleation rate by lowering their thermodynamic melting point . This mechanism can completely account for the observed behavior and can be further explored with additional experiments.
The remainder of this paper is organized as follows: In Sec. II, we review previous studies on alkane nucleation. Sec. III provides details of the experimental techniques and procedures used. Sec. IV reviews classical nucleation theory and its predictions based on the assumption of uniform nucleation, i.e., independent nucleation events in a homogeneous ensemble of droplets. Finding that this theory is unable to account for the observed behavior of the system, we consider possible extensions of this theory in Sec. V. Here we explore two scenarios for the generation of droplet heterogeneity, which is necessary to explain the data. These include the possibility of some fixed-in-time heterogeneity generated by the emulsification process, such as a distribution of droplet sizes or impurity concentrations, and the dynamic generation heterogeneity in the droplet population due to the nucleation process itself. Based on the reanalysis of the data, we present our conclusions in Sec. VI and suggest a number of experiments to further test the validity of the proposed mechanism, as well as avenues for future theoretical consideration.
II Previous studies of alkane nucleation
Four groups have studied alkane nucleation through the use of emulsion samples. The earliest work is from Turnbull and Cormia [4] who studied C16, C17, C18, C24 and C32. Theirs is the first evidence that alkane nucleation is unusual. First, they noted that there seemed to be an unusual spread in the melting temperatures. This was characterized as “sharp” and “broad” melting fractions. The amount of each varied from sample to sample, even for the same chain length. Because they performed isothermal nucleation studies they were sensitive to this spread in melting temperature. To analyze the nucleation behavior in this situation they focused on the early-time data with transformed fraction . This narrowed focus was meant to isolate the behavior of the sharp-melting, majority phase.
The second anomaly in alkane nucleation is the ease with which the alkanes nucleate. Stated in terms of reduced undercooling, , where is the point where the nucleation rate becomes significant and is the thermodynamic melting temperature, for the alkanes is about 0.05 whereas that for other materials is from 0.2 to 0.5 [11]. Turnbull and Cormia’s analysis of the nucleation behavior in terms of the classical nucleation model showed that the nucleation barrier is small ( mJ/m2 for C18; detailed kinetics measurements were not performed for C16) but that the pre-exponential factor is in rough agreement with that calculated from classical nucleation theory (experimental value m-3s-1 for C18). The small barrier accounts for the small undercooling temperature. The agreement of the pre-exponential with that from classical nucleation theory is itself unusual. Other materials typically exhibit values several orders of magnitude larger in value than the classical value [5].
Two subsequent studies on alkane nucleation explored the effect of changing carbon number [12, 13]. In both studies continuous cooling data were used to calculate the crystal-liquid surface tension and the pre-exponential factor. Both studies found that as the carbon number is reduced below about , there is an increase in the barrier. The pre-exponential values were not precisely determined by these studies. Re-analysis in terms of the Negentropic Model [11] led to a value of mJ/m2 for the barrier of C16, and to the suggestion that the anomalous barrier height disappears as and as , and that its origin is in partial alignment of the alkane chains.
The fourth group [14, 15, 16, 17] to study nucleation in emulsions focused on the behavior of C16. They utilized ultrasound transmission to measure the proportion of liquid to solid in an emulsion sample. Both stepwise cooling and isothermal hold experiments were used. Their results exhibit the typical undercooling found by other workers, showing that their samples behave as expected during stepwise cooling. However, the real focus of these studies was the interaction of liquid and crystalline droplets during isothermal hold experiments [14]. At an undercooling of ∘C, where the nucleation rate for the C16 liquid droplets alone is quite small, equal volume mixtures of liquid and solid C16 droplets were studied. The solid C16 drops were created by an initial deep undercooling and then physically mixed together with the as-yet unfrozen sample. The authors found that the solid C16 particles accelerate nucleation. The particle size distribution before and after the experiment was similar; therefore they ruled out Ostwald ripening as the source of the acceleration. No attempt was made to fit this data to a rate law.
In a set of related experiments the type and concentration of the surfactant was varied [15]. The presence of crystalline C16 droplets accelerated the nucleation by varying amounts depending on the surfactant type. It was also found that the rate of nucleation for the mixed solid/liquid emulsion increased as the amount of surfactant increased. The authors suggest that inter-particle collisions are responsible for the accelerated nucleation.
As we discuss in Sec. IV, we observe an effect opposite to that seen by these authors. As our sample crystallizes, the remaining crystallization is more difficult. However, Dickinson et al. [17] also report an experiment where this effect is seen. In this work they hold their emulsion at a undercooling of about 15 ∘C and follow the percent transformed with time. Like us, they observe an initially rapid nucleation which then slows. They do not attempt to fit this to a rate law, but it is clear that a single exponential cannot describe their data. Also similar to our findings they report that the melting behavior extends over a large temperature regime. They report melting ranges of about 2 ∘C for all their samples, and in one instance [17] they report the onset of melting more than 10 ∘C below the bulk melting temperature. As we show in Sec. V A, this is a signature of the impurity effects which can affect nucleation.
III Experimental Procedure
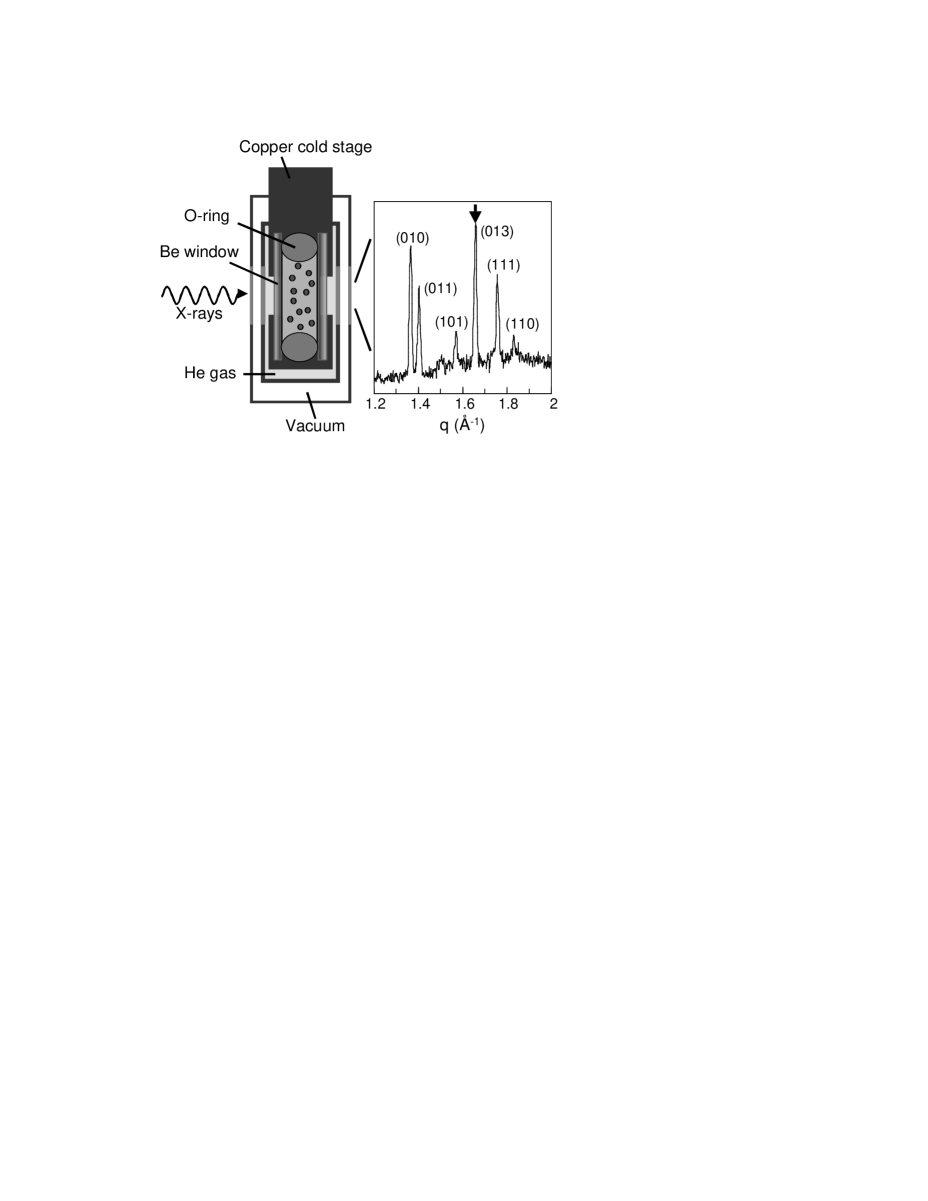
Nucleation of the liquid to crystal transition was measured in droplets of C16 of an oil-in-water emulsion. The observed crystal phase is the thermodynamically stable triclinic phase. A schematic of the experimental setup is shown in Fig. 1. A reference table of relevant material properties for C16 is given in Table I.
| Melting Temperature: | K |
|---|---|
| Entropy of Fusion: | |
| Mass Density: | |
| Molar Weight: | |
| Viscosity at : |
One diameter emulsions of C16 in water with the surfactant sodium dodecyl sulfate (SDS) were prepared using the fractionation method of Bibette[18]. The distribution of droplet sizes was less than in diameter as determined by light scattering and optical microscopy.
Below its Krafft point at 283 K[20], SDS precipitates out of solution as a crystalline solid in equilibrium with a small concentration of dissolved monomers. In order to avoid this effect, a co-surfactant was added to supress the Krafft point[21]. The chosen surfactant, a sulfated polyoxyethylenated alkyl alcohol (refered to here as EO), has the chemical formula CH3(CH2)11-15(OCH2CH2)9OSO3Na. An aqueous solution of EO was added to the initial emulsion sample to achieve approximately equal concentrations of SDS and EO in the range of 0.5 - 1 wt. This new solution was allowed to equilibrate for more than 24 hours before use, during which time the emulsion droplets had flocculated together to form a white cream floating on the aqueous phase. The cream of the emulsion sample with both SDS and EO co-surfactants was loaded directly into the x-ray cell.
The emulsion sample was loaded into a Viton O-ring sandwiched between two Be windows, held between two copper plates (see Fig 1). The sample temperature was read with thermistors ( K accuracy) placed in the copper less than 3.5 mm from the sample. The sample was cooled on an Air Products Displex cold finger with a closed-cycle He refrigeration system. Heating wire wrapped around the base of the cold finger provided temperature control. As the cold finger was operated in vacuum, an air-tight copper shield with kapton windows was placed directly around the copper sample mount inside the vacuum shroud of the Displex to surround the sample with gas and therefore reduce temperature gradients. The temperature was controlled with a LakeShore 340 Temperature Controller. The control temperature sensor (Si diode) was embedded in the cold finger directly above the copper sample mount. Using this setup, it was possible to cool the sample from room temperature down to 277 K in less than 250 s without any overshoot of the temperature (Fig. 2). This careful attention to temperature gradients overcame problems encountered in the initial studies [22].
The nucleation rate was determined by measuring the change in intensity of the x-ray diffraction as a function of time. X-ray scattering was performed using a Rigaku 18 kW rotating anode generator and an x-ray wavelength of 1.542 Å. Scattered x-rays were detected with a Bicron detector on a Huber 4-circle spectrometer. Scattering from the solidified 1 dia. droplets resulted in a powder diffraction pattern of the triclinic phase. The (013) Bragg peak of the triclinic phase was selected to be monitored (Fig 1) due to the intensity of the peak and the low scattering from the liquid phase at that angle. For the isothermal experiments, the detector slits were set very wide to increase the signal intensity and to encompass slight differences in the peak position due to thermal expansion when measuring at different temperatures. During the constant cooling rate and the melting experiments, the slits were narrowed and the detector was continually shifted to track the peak during thermal expansion.

Three types of experiments were conducted: crystallization at a constant undercooling (isothermal nucleation), crystallization while the temperature was lowered linearly in time (linear cooling), and melting at a slow heating rate. For the isothermal experiments, the sample was rapidly quenched from room temperature down to the desired undercooling and held at that temperature while the increase in x-ray scattering was followed as a function of time (see Fig. 2). In order to determine the total scattering signal when the entire droplet population was frozen, each experiment was followed by a deep quench to a lower temperature (273.8 K) that froze all droplets. All reported isothermal data is normalized to the final intensity value of the subsequent deep quench. In addition, all quenches were repeated multiple times with identical results.
In the linear cooling experiments, the rate of temperature change was between and K/min. Faster rates were avoided because the latent heat released by the crystallizing droplets could not be dissipated quickly enough and resulted in a smearing of the transformation over a larger temperature range.
Melting was done in steps of 0.25 to 1 K. The sample was heated slowly between steps and was allowed to equilibrate for approximately 1 hour at each step. This equilibration was observed by the leveling out of the intensity subsequent to each temperature step.
IV Uniform Nucleation
In this section, we interpret the results of the experiments using classical nucleation theory, with the assumptions that (i) all droplets in the emulsions are identical, and that (ii) nucleation events are statistically independent in each droplet. We refer to this set of assumptions as uniform nucleation.
In classical nucleation theory [5, 23], the formation of the thermodynamically stable crystalline phase in an undercooled, metastable liquid phase is controlled by the local free energy barrier towards solidification. The free energy cost, , associated with the creation of a solid sphere of radius is given by
| (1) |
where is the free energy difference per volume between the metastable liquid and the stable solid phase, and is the surface tension between the two phases. For small solid radii, , the second term dominates the first and the formation of the more stable solid phase requires an increase in free energy. The nucleation rate is controlled by the free energy barrier associated with the formation of a solid sphere at a critical radius of , since further solidification reduces the free energy of the system. For small undercooling, the thermodynamic driving force , where is the entropy of fusion of the phase transition and is the degree of undercooling of the sample at temperature [24]. We neglect the dynamics of the growth and simply assume that upon formation of a solid phase of critical radius, the entire droplet freezes instantaneously.
The probability of spontaneously creating a solid with the critical radius is simply found from Eq.(1), leading to a nucleation rate
| (2) |
This rate is proportional to the volume, , of available undercooled fluid, the Boltzmann factor associated with the free energy barrier for creating a critical nucleus as determined from Eq.(1), and an attempt frequency per unit volume, , for creating such a critical nucleus, which is given by [25]
| (3) |
Here, , , , and are, respectively, a numeric constant , the monomeric volume, molecular number density, molecular diameter and the Stokes-Einstein diffusion constant of C16 in its liquid phase. For notational simplicity we define
| (4) |
so that the nucleation rate given by Eq.(2) becomes
| (5) |
A Isothermal Nucleation
At a fixed level of undercooling, the rate at which emulsion droplets freeze is time independent. Let represent the fraction of solid droplets at time following a rapid quench to a given undercooling at . Then obeys the differential equation
| (6) |
with initial condition: . This differential equation may be integrated to give
| (7) |
so the fraction of liquid droplets decreases exponentially in time.
It should be noted that the rate depends strongly on both the surface tension of the liquid–solid interface and the degree of undercooling [cf. Eqs.(4)-(5)]. This strong dependence allows an extremely precise determination of provided that the data can be fit to a single exponential. On the other hand, Fig. 3, showing a representative data set from an isothermal freezing experiment, demonstrates that such a simplistic interpretation of the data is inapplicable. The freezing of remaining liquid droplets at later times proceeds far slower than suggested by an extrapolation from the initial decrease of the fraction of liquid droplets, , shown by the solid line in Fig. 3.

B Linear Cooling
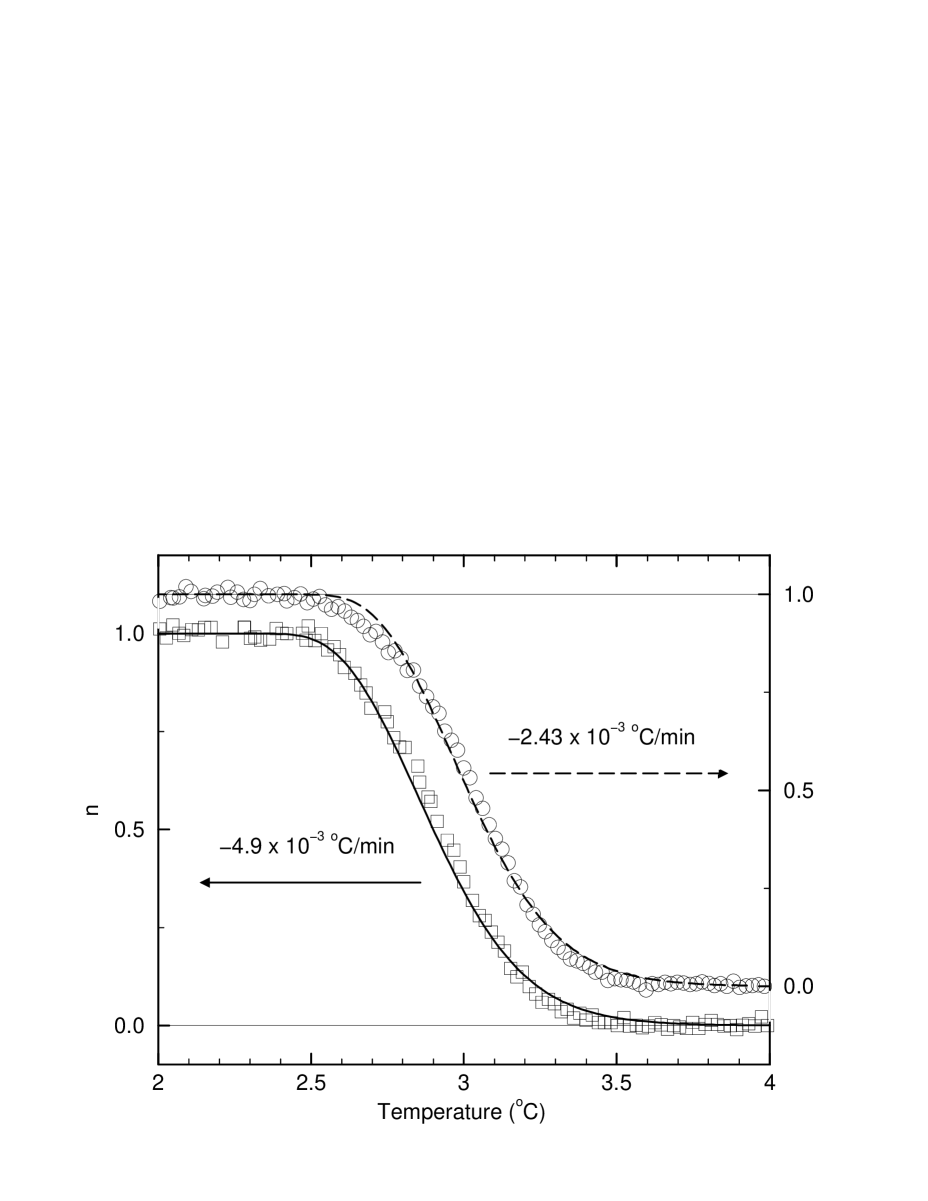
We now consider the case where the temperature, rather than being held constant, decreases linearly in time. The thermodynamic driving force thus increases in time and the exponential decay of the liquid fraction seen in the solution of Eq. (6) is changed to a relatively sudden drop at an undercooling determined by the cooling rate (see Fig. 4).
Suppose that the temperature of the sample is decreased at a rate given by . If we ignore the weak temperature dependence in the pre-exponential factor in Eq. (5), we find that the time-dependent nucleation rate is now given by
| (8) |
The differential equation describing the time evolution of reads
| (9) |
where the initial time, , is chosen to occur when the sample is at .
Following a change of independent variable to the solution of Eq. (9) is given by
| (10) |
where we have introduced the incomplete Gamma function[26]
| (11) |
For , this function goes to zero as so at short times behaves as
| (12) |
Thus, at the function has an essential singularity and the initial increase in the solid fraction is extremely slow. For , the integral in Eq.(11) is dominated by the divergence of the integrand at and is approximately given by , so at long times
| (13) |
as expected since the free energy barrier disappears. However, since the attempt frequency is typically very large, the nucleation process is largely finished long before the free energy barrier becomes negligible. Therefore, this asymptotic behavior is not observable experimentally. The complete solution is plotted in Fig. 4 together with the experimental data.

The plot shown in Fig. 4 of Eq. (10) was made using the pre-exponential factor taken from a fit to the isothermal data (see Sec. V B) and using the surface tension as a fitting parameter. The pre-exponential factor used in this fit was calculated at ( at the temperature of transformation is less than 3% smaller than at ). We find that the best fit value of this surface tension is mJ/m2. It should be noted that, to a good approximation, shifting the value of the surface tension simply translates the theoretical curve in time (i.e. temperature). Therefore, can in principle be determined with great precision, since the time at which abrupt change in occurs is exponentially sensitive to its value. The principal source of the uncertainty is the accuracy with which the magnitude of the undercooling was measured. This result for the surface tension is in agreement with the previous work of Turnbull et al. for C18 [4] and other groups for C16 [12, 13].
Finally, we note that the agreement between the linear cooling data and the prediction of Eq. (10) is not exact. In particular the slope of the data in the transition region (3.2 – 2.6 ∘C in Fig. 4) is clearly smaller than that of the theoretical prediction. This behavior is consistent with the observed slowdown of the nucleation rate in isothermal experiments. In order to address these discrepancies, we proceed in the next section to systematically relax the assumptions made in the uniform nucleation hypothesis.
V Nonuniform Nucleation
Applying the results of uniform nucleation theory to both the isothermal and linear cooling experiments has led to substantial disagreements between theory and experiment in the former and more subtle deviations in the latter. The departure from simple exponential behavior in the isothermal quench experiments has been noted by previous workers in the field[4, 17]. Faced with this observation, one is forced to consider one of two general possibilities:
(i) The emulsion droplets are not homogeneous, i.e., there is a “quenched-in” dispersion in some relevant property, such as a distribution of sizes or impurity concentrations, leading to multi-exponential decay of in the isothermal experiments, or,
(ii) Nucleation events are not statistically independent, i.e., the nucleation rate of a given emulsion droplet depends on the state of the other droplets, such as the current fraction of solid droplets in the emulsion, possibly due to an impurity mediated interaction between the droplets. This sort of interaction might lead to a history dependent nucleation rate and result in non-exponential freezing curves. We re-emphasize that the non-exponential character of the curve (Fig. 3) does not reflect the finite growth rate of the solid as this rate is extremely fast compared to the data acquisition rate[27, 28]. Similarily we may not attribute the deviation from a simple exponential to latent heat effects (rise in temperature due to rapid release of heat from crystallization) since the magnitude of the deviation does not diminish with smaller uncoolings and hence, lower nucleation rates. In addition, given that the isothermal curves can be reproduced repeatedly for the same loading of a given sample, the non-exponential character does not arise from coarsening of the size distribution of the emulsion sample. The main difference between mechanisms (i) and (ii) is that in the former scenario, although there is a distribution of nucleation rates, it does not depend on the state of the droplets, whereas the latter scenario suggests that nucleation events influence the subsequent evolution of the system.
Let us start by considering the first possibility, the existence of some fixed in time distribution of nucleation rates. If there is a population of droplets with different volumes, Eq. (7) can easily be generalized to account for this effect by integrating contributions to the freezing curve of droplets of a given volume over the volume distribution . The resulting isothermal freezing curve is then [cf. Eqs.(5), (7)]
| (14) |
We take the droplet volume distribution to be log normal with characteristic volume and variance [29]
| (15) |
and find that the best fit to the experimental data is obtained for . The resulting best fit to the data is poor; also, the emulsion is actually known to have a much narrower volume distribution, based on the method of emulsion preparation and our own optical measurements [30]. Furthermore, isothermal experiments at different undercoolings cannot be accounted for by a single set of fitting parameters. Thus, we do not believe that the observed non-exponential saturation of the isothermal freezing curves can be attributed to the polydispersity of the emulsion sample.
Along a similar vein, one may postulate that there exists some fixed distribution of melting temperatures in the emulsion droplet population, possibly due to a distribution of impurity concentrations in the emulsion droplets. Here one must assume that the impurities in the droplets are highly insoluble in water, in order to prevent the equalization of impurity concentration via diffusion through the continuous phase. Problems very similar to the case of size distribution arise here as well. Although good fits to individual isothermal nucleation curves can be obtained using this modification, experimental runs at different undercoolings cannot be accounted for using the same fixed impurity concentration distribution. Furthermore, in order to fit a given data set one is once again forced to assume a distribution of impurity concentrations that is too broad (with standard deviation comparable to the mean). The average number of impurities in a droplet of volume is , where is the mole fraction of impurities, is Avogadro’s number, and , are the density and molar weight of C16, respectively. Substituting material values from Table I and typical values and m3, yields . Thus, at this impurity level, the central limit theorem suggests a much narrower distribution.
Nevertheless, the role of impurities in this system is not inconsequential. While it is true that we may dispense with a time-independent distribution of impurities in order to account for the experiments, a time-dependent change of the impurity concentration driven by the freezing process can account for the non-exponential behavior of the isothermal freezing data. Before we discuss this possibility in detail, we consider the effect of impurities on the melting temperature of the C16 droplets.
A Impurity Effects
In a liquid, the presence of impurities that are relatively insoluble in its solid reduces its equilibrium freezing point[31] and broadens its melting curve. Figure 5 shows the behavior for both the emulsion and the bulk C16 that was used in its preparation. Note that each emulsion droplet (or the entire bulk C16 sample) will have a partially molten fraction, described by in the following discussion.

For molar impurity fractions , the impure liquid will be in equilibrium with its pure solid at a suppressed temperature[31]
| (16) |
where is the melting point of pure C16. A point on the melting curve at temperature reflects coexistence between the liquid fraction with impurity concentration and the pure solid, since the total number of impurities are fixed and the impurities are assumed to be insoluble in the solid. Thus, the temperature at which the liquid fraction is is given by
| (17) |
Here, K, obtained from the material parameters of C16 in Table I. Inverting this equation gives the liquid fraction as a function of
| (18) |
A single-parameter fit to the bulk melting curve gives excellent agreement over the entire temperature range (see Fig. 5), with which is typical of what one might expect given the purity specification of the manufacturer for the sample that was used.
Surfactants and water have been introduced to the sample in order to make the emulsion droplets, and therefore it is reasonable to expect additional impurities to end up in the emulsion droplets. A similar fit to the melting curve of emulsion droplets shown in Fig. 5 shows an increase in the impurity concentration to about . Given the high purity and small solubility of water in C16, the surfactants are likely to be the main source of these additional impurities.
Given that there is a range of melting temperatures, which we attribute to varying impurity concentrations in the droplets, we propose the following scenario in order to explain the observed behavior: The system is presumably in thermodynamic equilibrium prior to the initiation of nucleation events. It is reasonable to suppose that when a droplet freezes, some of the impurities inside or at the surface of the droplet are expelled to the surrounding water, since the impurities are less soluble in solid than in liquid C16. These impurities consequently redistribute themselves among the water and remaining liquid C16 droplets in order to restore thermodynamic equilibrium. This happens by diffusion through the continuous phase, which occurs rapidly on the time scale over which the fraction of frozen droplets varies. Some fraction of these impurities, determined by their relative solubility in water vs. C16, end up in the remaining liquid droplets, whose enhanced impurity concentration decreases their effective undercooling and reduces their nucleation rate. Thus, the first droplets to freeze have a higher melting temperature than the last droplets to freeze since they have a lower impurity concentration, which gives rise to the non-exponential behavior during isothermal nucleation.
The theoretical analysis can easily be extended to account for such a mechanism, which can then be compared with the experiments to test the hypothesis. We do this in the remainder of this section.
B Return to Isothermal Nucleation
The leading behavior manifested by an impurity mediated suppression of the undercooling can be expressed as a linear decrease in the relevant melting temperature as a function of solid C16 fraction . Thus, the time evolution of at a fixed temperature is given by
| (19) |
where is the initial melting temperature of the droplets and is the rate at which the melting point of subsequent droplets is reduced. In general, depends on the volume fraction of the droplets in the emulsion and the relative solubilities of the impurities involved in the mechanism in water and C16. Being unable to determine independently, we use it as an additional fitting parameter to account for the experimental data. A least-squares fit of the numerical integration of Eq.(19) with respect to , , and ( was allowed to vary from the intial value as predicted using Eq.(3) and the numerical constants in Table I) was performed on the data. The comparison of experiment and theory for four different undercoolings is shown in Fig. 6. Compared to uniform nucleation or fixed-in-time heterogeneity assumptions, the agreement with experiment is excellent. Furthermore, the obtained value for is physically very reasonable. The best-fit value for was 0.55 K, i.e., the melting point of the last droplets to nucleate have been reduced by about half a degree. The resulting value of the pre-exponential factor was a factor of times the classical expression. This gave a value of m-3s-1 at an undercooling of 15.1 K. The resulting value for the kinetic barrier was mJ/m2, in good agreement with that obtained from the linear cooling experiments (see Sec. IV B).
Actual values for the rates of transformation for the isothermal data in Fig. 6 range from m-3s-1 at K to m-3s-1 at K for early times. These rates slow down due to the impurity effect by a factor of 10 after 60 % conversion of the sample.

It may be noted that the freezing curve with the fastest time scale (largest undercooling) lies somewhat below the theoretical prediction. We attribute this discrepancy to the rapid liberation of latent heat upon the freezing of the droplets, which raises the sample temperature and slows the freezing of the remaining liquid droplets. Larger undercoolings (not shown) all seem to suffer increasingly from this effect. In Fig. 6 we have also adjusted the melting temperature of C16 from the value given in Table I of K to K. This downward shift of the melting temperature from that of the pure material reflects the initial impurity concentration in the emulsion droplets prior to the freezing-induced enhancement, as well as the accuracy in the calibration of thermistors used to measure sample temperature. (Note that the melting temperatures for the isothermal and linear cooling experiments were measured with different thermistors for emulsion samples prepared at different times.)
C Return to Linear Cooling
We may further test our hypothesis by revisiting the linear cooling problem. If the transformation rate is slow compared to the time over which impurity molecules are able to diffuse from one emulsion droplet to the next, we may assume that the impurities remain in equilibrium over the course of the experiment. We can estimate this equilibration time as: where is the radius of an emulsion droplet, is the diffusion coefficient for an impurity molecule in water (which we may take to be on the order of a typical molecular diffusivity) and is the volume fraction of the emulsion droplets. We then find that the assumption of impurity concentration equilibration remains valid up to transformation rates, , on the order of Hz. The experimental maximum transformation rate (taken from the maximum slope of the data in Fig. 4) is on the order of Hz . Clearly this estimate applies only to the situation where the total conversion to the solid is incomplete (as is the case in our isothermal experiments – see Fig. 6) since the diffusion time to another unfrozen droplet becomes infinite as the fraction of remaining liquid droplets () drops to zero. In the linear cooling experiments where the transformation is complete, the assumption of impurity equilibration holds until less than % of the liquid droplets remain, so the observation of the breakdown of this assumption is experimentally inaccessible.
Upon modifying Eq. (8) to account for the suppression of the melting temperature, time evolution of for linear cooling is given by
| (20) |
The integration of Eq. (20) can be performed numerically. The result of this integration along with the linear cooling data is shown in Fig. 7 for two different cooling rates. Once again, is used as a fitting parameter, with a best fit value of K. Values of and are as given in Sec. IV B.
Comparing Fig. 7 with Fig. 4 one immediately notes that the discrepancy in maximum slope between the unmodified theory and the data has now disappeared. The difference in the values of between the linear cooling and isothermal quench experiments is not unexpected, given the fact that the value of is sample dependent and different emulsion samples were used for the two types of experiments. A more detailed analysis of the impurity mediated interaction hypothesis, including a better quantitative analysis of and further implications of this hypothesis on other types of experiments is the subject of ongoing work[32].
VI Summary and Conclusions
In this paper we report on the results of nucleation studies in C16 emulsions during isothermal quench and linear cooling conditions. By application of recently developed emulsion preparation techniques to produce nearly monodisperse emulsion samples and use of x-ray scattering for direct observation of the crystalline phase, we greatly reduced many of the uncertainties in the interpretation of experimental data. In doing so, we have found potentially important effects not accounted for by the standard interpretation of uniform nucleation. In accord with previous measurements of this sort by Turnbull and Cormia[4], the isothermal quench experiments do not show the standard exponential growth and saturation of the fraction of solid droplets over time. Instead we observe a substantial decrease in the rate of nucleation events at later times, when a significant fraction of the system has already transformed to the solid phase. In addition, we find that in the linear cooling experiments the maximum transformation rate predicted by the simple nucleation theory is larger than that of the data.
Such discrepancies have previously been attributed to the existence of some sort of temporally fixed heterogeneity in the emulsion droplet population. One proposed source of heterogeneity has been the volume polydispersity in the emulsion droplets. However, using recently developed emulsification techniques, we can better control the droplet polydispersity and still not recover single exponential behavior. Furthermore, by attempting to fit isothermal data at different temperatures to a given droplet size distribution, we find that no single distribution is capable of fitting the data at different levels of undercooling. Along similar lines one may attempt to postulate a distribution of the number of heterogeneous nucleators in the droplets. The best attempts to fit the data with such a scheme result in unaccountably broad distributions of impurity concentrations in the emulsion droplets. Such distributions are highly unlikely in light of the central limit theorem.
In contradistinction to both of these ideas, we propose that the observed heterogeneity in the emulsion droplets is dynamically generated by the nucleation process itself. Freezing droplets expel impurities (some of which might be attributed to the addition of surfactant) which then go into solution in the remaining liquid C16 droplets in order to restore thermodynamic equilibrium. By doing so, these mobile impurities reduce the melting temperature of the remaining liquid droplets, which experience a reduced thermodynamic driving force towards solidification and consequently a reduced nucleation rate. This proposal is able to account for both the isothermal and linear cooling data at a variety of undercoolings and cooling rates, respectively. To a good approximation, the magnitude of this effect can be parametrized by a sample dependent parameter , which expresses the rate at which the melting point of remaining liquid droplets is suppressed as a function of the solid droplet fraction. To obtain accurate quantitive measurements of either the activation barrier toward nucleation or the pre-exponential factor, this effect needs to be taken into account. Note that measurements described in this paper were performed on emulsion samples prepared with a mixture of anionic surfactants. Measurements of a C16 emulsion sample prepared with a single nonionic surfactant does not appear to show such a large impurity effect [32].
Further tests of this theory can be anticipated. It should be possible to directly detect and measure the suppression of melting temperature by an experiment where the emulsion is partially melted and subsequently refrozen at a temperature where no new nucleation is allowed. Such careful studies of the remelting process coupled to a more detailed theory for the impurity expulsion and transport should lead to a better understanding of whether and how the dynamics of the freezing process effects the results of emulsion nucleation studies. Additional work along these lines is currently in progress[32].
We would like to thank H. Shao and H. Gang for their help in the initial stages of the experiments, J. Wang for performing the isothermal quench experiments, W. Gordon for his assistance with the experiments, and E. Sirota, S. Milner and J. Hutter for useful discussions. For work done while at the University of Pennsylvania, A. L. acknowledges support by the Donors of The Petroleum Research Fund administered by the American Chemical Society.
REFERENCES
- [1] Present address: Department of Physics & Astronomy, University of Pennsylvania, Philadelphia, PA 19104.
- [2] B. Vonnegut, J. Colloid Sci. 3, 563 (1948).
- [3] D. Turnbull, J. Chem. Phys. 20, 411 (1952).
- [4] D. Turnbull and R. L. Cormia, J. Chem. Phys. 34, 820 (1961).
- [5] K. F. Kelton, Solid State Physics 45, 75 (1991).
- [6] J. H. Perepezko, Materials Science and Engineering A226-228, 374 (1997).
- [7] J. H. Perepezko, Materials Science and Engineering 65, 125 (1984).
- [8] J. Bibette, J. Colloid Interface Sci. 147, 474 (1991).
- [9] K. Kandori, K. Kishi and T. Ishikawa, Colloids and Surfaces 55, 73 (1991).
- [10] K. Kandori, K. Kishi and T. Ishikawa, Colloids and Surfaces 61, 269 (1991).
- [11] D. Turnbull and F. Spaepen, J. Polym. Sci., Polym. Symp. 63, 237 (1978).
- [12] D. R. Uhlmann, G. Kritchevsky, R. Straff and G. Scherer, J. Chem. Phys. 62, 4896 (1975).
- [13] M. J. Oliver and P. D. Calvert, J. Crystal Growth 30, 343 (1975).
- [14] D. J. McClements; E. Dickinson and M. J. W. Povey, Chem. Phys. Lett. 172, 449 (1990).
- [15] E. Dickinson, F.-J. Kruizenga, M. J. W. Povey and M. v. d. Molen, Col. and Surf. A 81, 273 (1993).
- [16] E. Dickinson, M. I. Goller, D. J. McClements, S. Peasgood and M. J. W. Povey, J. Chem. Soc. Faraday Trans. 86, 1147 (1990).
- [17] E. Dickinson, D. J. McClements and M. J. W. Povey, J. Colloid Interface Sci. 142, 103 (1991).
- [18] J. Bibette, Journal of Colloid and Interface Science 147, 474 (1991).
- [19] D. M. Small, The Physical Chemistry of Lipids: ¿From Alkanes to Phospholipids, Plenum Press (New York, 1986).
- [20] H. Nakayama, K. Shinoda and E. Hutchinson, J. Phys. Chem. 70, 3502 (1966).
- [21] M. Hato and K. Shinoda, J. Phys. Chem. 77, 378 (1973).
- [22] H. Shao, Ph.D Thesis, X-ray Scattering Study of Structures and Phase Transitions of Normal Alkanes, The Ohio State University (1995).
- [23] D. Turnbull and J. C. Fisher, J. Chem. Phys. 17, 71 (1949).
- [24] We neglect the difference in specific heats between the liquid and solid phases in this case.
- [25] D. Wu, Solid State Physics 50, 37 (1996).
- [26] M. Abramowitz and I. A. Stegun, Handbook of Mathematical Functions, p. 260, Dover Publications, Inc. (New York, 1972).
- [27] D. Turnbull, Contemp. Phys. 10, 473 (1969).
- [28] At typical crystal growth velocities of meters per second, the time lag between nucleation and completion of growth in a single emulsion droplet is on the order of a microsecond. This estimate is not substantially changed by the fact that these materials form plate-like structures during freezing. Even though the formation of plates suggests slower growth along certain cystallographic directions, the ratio of the slow rate to the fast one would have to be less than to have an effect on the experiments.
- [29] D. B. Siano, J. Chem. Educ. 49, 755 (1972).
- [30] Based on the estimate that the standard deviation for the droplet diameter is about , the standard deviation for the emulsion droplet volume distribution should be about .
- [31] E. M. Lifshitz and L. P. Pitaevskii, Statistical Physics, 3rd Edition, Part 1, Chap. 9, Pergamon Press (New York, 1980).
- [32] D. Ertaş et. al., in preparation.