Universality in sandpiles
Abstract
We perform extensive numerical simulations of different versions of the sandpile model. We find that previous claims about universality classes are unfounded, since the method previously employed to analyze the data suffered a systematic bias. We identify the correct scaling behavior and conclude that sandpiles with stochastic and deterministic toppling rules belong to the same universality class.
PACS numbers: 64.60.Lx, 05.40.+j
Sandpile automata [1] are among the simplest models to describe avalanche propagation, a phenomenon of upsurging experimental interest in a wide range of fields [2]. In the stationary state, after suitable tuning of the driving fields [3], these models display critical behavior in the avalanche statistics. As for ordinary critical phenomena, it is possible to define a set of scaling exponents that characterize that large scale behavior of the system [3].
The precise identification of universality classes in sandpile models [1] is an unresolved issue. From a theoretical standpoint, it would be unusual that small modifications in the dynamical rules of the model could lead to different universality classes. Real-space renormalization group calculations [5] suggest that different sandpile models, such as the Bak, Tang and Wiesenfeld (BTW) [1] and the Manna [4] models, all belong to the same universality class. This result is also confirmed by a recently-proposed field theory approach [6], which shows that all sandpile models [7] are described by the same effective field theory at the coarse grained level. Universality is also found between BTW (discrete) and Zhang [8] (continuous) models in the dynamical renormalization group calculations of Ref. [9].
The results obtained by numerical simulations are unclear. Early large scale numerical simulations of the Manna [4] and BTW models [10], show that the avalanche distributions are described by the same exponents for the power law decay and the scaling of the cutoffs. These results were questioned by Ben Hur and Biham [11] who analyzed the scaling of conditional expectation values [12] of various quantities. They found significant differences in the exponents for the two models and therefore proposed a new classification of universality in sandpile models in which models with stochastic update rules, such as the Manna model, fall in a universality class different from that of Abelian models, such as the BTW [13]. The method was later applied to the Zhang model that was declared “non-universal” [14]. This results pose a puzzling problem, since they contradict all the existing theories and do not agree with the scaling predicted analyzing avalanche distributions [4, 10].
Here we present large scale numerical simulations of the BTW and Manna sandpile models, with the goal of settling the issue of universality. First we show that the method of conditional expectation values, introduced in Ref. [12] and used in Ref. [11], is systematically biased by non-universal corrections and does not provide indications on universality classes. By removing the bias, we provide evidence that the BTW and Manna models are universal. We confirm this conclusion by data collapse and moment analysis of the distributions [15].
Sandpile models are defined on dimensional hypercubic lattice. On each site of the lattice we define an integer variable which we call “energy”. At each time step an energy grain is added on a randomly chosen site (). When one of the sites reaches or exceeds a threshold a “toppling” occurs: and , where represents the nearest neighbor sites of site . In the BTW model and each nearest neighbor receives a grain after the toppling of the site . In the Manna model and therefore only two randomly chosen neighboring sites receive a grain. A toppling can induce nearest-neighbor sites to topple on their turn and so on, until all the lattice sites are below the critical threshold. This process is called an avalanche. A slow driving is usually imposed, so that grains are added only when all the sites are below the threshold. The model is conservative and energy is dissipated only at boundary sites [1]. Here, we perform numerical simulations of two-dimensional Manna and BTW models with open boundary conditions and conservative dynamics. The lattice size ranges from to in both models. In each case, statistical distributions are obtained averaging over nonzero avalanches.
Avalanches in sandpile models are usually characterized by three variables: the number of topplings , the area affected by the avalanche, and the avalanche duration . The probability distribution of each of these variables is usually described as a power law with a cutoff
| (1) |
where . When the system size goes to infinity the cutoff diverges as . Under the finite size scaling (FSS) assumption of Eq. (1), the set of exponents defines the universality class of the model.
In two dimensions, an accurate numerical determination of the power law exponents in Eq.(1) proved to be a difficult task [4, 10, 16, 17], due to the large deviations at the lower and upper cutoffs. For this reason, Christensen et al. [12] in order to distinguish among universality classes proposed a more refined numerical analysis based on the evaluation of the expectation value of the variable restricted to all the avalanches with variable , where [12]. It is assumed that and the exponents are used to distinguish among universality classes [11]. These exponents satisfy the scaling relations and .
If the conditional probability distribution is sufficiently peaked, then is well-defined and to each value of the variable we can unambiguously associate a value of the variable (i.e. ). In particular, the cutoff of the distributions should be related by the same exponents (i.e. ), which implies . For instance, we have , since in two dimensions avalanches are compact for both the BTW [10] and Manna model [11], so that . The data collapse analysis shows the BTW and Manna model both share the same exponent [4, 10, 16] which implies . On the contrary, Refs. [11, 14] found for the BTW model and for the Manna model, which would yield two different universality classes for the two models. Less marked differences were also observed for the other exponents [11, 14].
In order to resolve this paradox, we return to the hypothesis underlying the use of conditional expectation values: must be symmetric and strongly peaked around the average value. We checked numerically that this assumption is not fulfilled: in the BTW model the distribution is maximum for and decreases for , with a characteristic value scaling as (see Fig. 1). The distribution is not symmetric (see also Ref. [17]), consistent with the constraint (the avalanche area can not be greater than the number of topplings). Similar considerations apply as well to other quantities (i.e. , ) whose conditional probability distributions show asymmetry although less marked.
To understand the effect of non-symmetric distributions on conditional expectation values, consider a distribution of the form
| (2) |
where the characteristic value scales as and is the step function . The factor ensures normalization for any
| (3) |
so that the conditional expectation value is given by
| (4) |
Performing the substitution , we obtain
| (5) |
where is a non-universal constant.
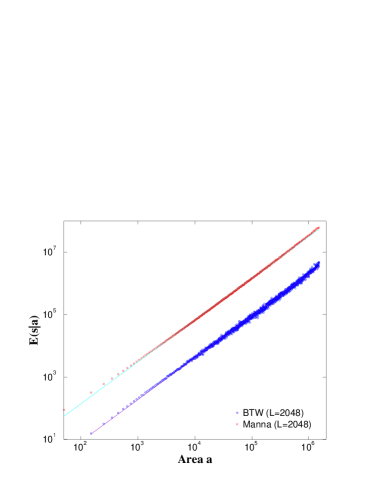
In the BTW model has the form of Eq. (2) as is shown by performing data collapse analysis (see inset of Fig. 1). Thus, we can easily subtract the linear bias from the expectation value in order to obtain the correct scaling behavior to be compared with that of the Manna model (Fig. 2), whose conditional distributions appear to be symmetric. Data from avalanche areas up to provide striking evidence that both models share the same asymptotic behavior with an exponent , in agreement with other published results [4, 10, 16, 17]. The scaling of the other expectation values is also biased as it is apparent from the bending in the curves reported in Refs.[11, 14]. The correction of the bias is not so straightforward as in the case we have discussed but can be obtained from the analysis of . This discussion clearly shows that conditional expectation values are not a reliable method to determine the universality class of a model.
To confirm the conclusion about a single universality class we perform the moment analysis on the distributions in close analogy with the recent work of De Menech et al.[15] on the two-dimensional BTW model. Here we apply the moments analysis on both BTW and Manna models, taking advantage of the large sizes reached in our numerical simulations. We define the -moment of on a lattice of size as . If FSS hypothesis (Eq. (1)) is valid, at least in the asymptotic limit (), we can transform and obtain
| (6) |
or in general . The exponents can be obtained as the slope of the log-log plot of versus . Using Eq. (6), we obtain or , so that the slope of as a function of is the cutoff exponent . This is in general not true for small because the integral in Eq. (6) is dominated by the lower cutoff. In particular, corrections to scaling of the type are important for . For instance, when , logarithmic corrections give rise to effective exponents up to very large lattice sizes. Finally, normalization imposes .
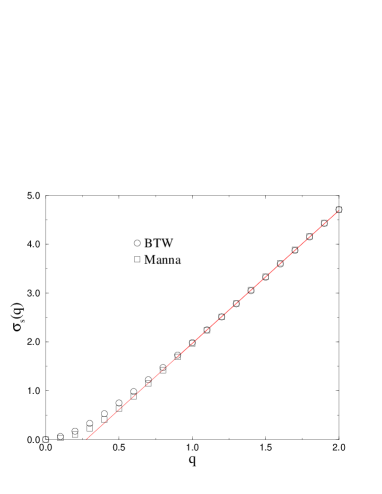
In Fig. 3 we show the results obtained from the moment analysis of the distribution for the Manna and the BTW model. In this case we can use the exact result , which implies , as a test for the convergence of our simulations to the asymptotic scaling regime. This relation is fulfilled and the of the two models are indistinguishable for , indicating universal scaling behavior. We observe small deviations for small which are due to the non-universal lower cutoff. By measuring slope of , we obtain . This value is larger than the value reported in Ref. [15] (i.e. ), where small lattice sizes have been used. We have repeated the same analysis for the and the and the measured cutoff exponents and are reported in Table I. Also in this case the exponents for the two models share the same values within error bars, confirming the presence of a single universality class.
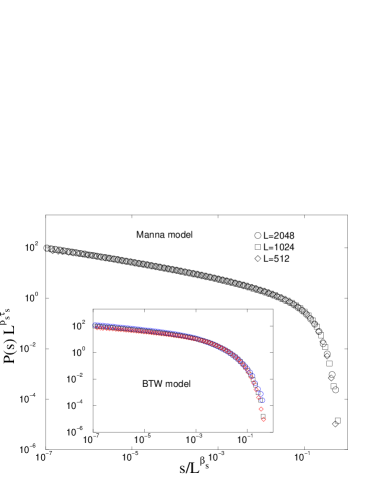
As a final consistency test, we used the data collapse method in order the check the FSS hypothesis, which states that rescaling and , the data for different must collapse onto universal curves. If FSS is verified, we can compute the exponent from the scaling relation , that should be satisfied for enough large sizes. Using the values of reported in Table I and the values obtained for we find the exponents to be inserted in the data collapse. For instance, using the exact result and the estimated , we obtain . The data collapse with these values is satisfactory for both models (see Fig.4).
In the same way, we obtain very good data collapse for the Manna model and distributions, yielding and . On the other hand, we find that the BTW data collapses for time and area distributions are not compatible with the FSS hypothesis. The linear behavior of the moments analysis, however, ensures that for large sizes the FSS form must be approached. This result can be explained if we assume that the scaling in the BTW model displays subdominant corrections of the form , where are non-universal constants. These corrections are compatible with the linear behavior at large , but the decay of the is not a simple power law for small and thus FSS is not obeyed. It is worth to remark that the time and area distributions span over much less order of magnitude than the size distribution, which could explain why subdominant corrections are more relevant in the first two cases. Subdominant corrections are due to higher order operators in the dynamics and do not determine the universality class, since the asymptotic scaling behavior is ruled by the leading power.
In summary, we have presented strong numerical evidence pointing towards a single universality class for the Manna and the BTW model. In particular, we show that previous analyses [11, 14] are not reliable because of systematic biases introduced by the method employed. Further work is needed in order to quantify the extent of subdominant corrections to scaling in the BTW model.
We thank A. Barrat, D. Dhar, R. Dickman, S. Krishnamurthy, E. Marinari, M.A. Muñoz and D. Stauffer for useful discussions and suggestions. The main part of the numerical simulations have been run on the Kalix parallel computer [18] (a Beowulf project at Cagliari Physics Department). We thank G. Mula for leading the effort toward organizing this computer facility. A.V. and S.Z. acknowledge partial support from the European Network Contract ERBFMRXCT980183. The Center for Polymer Studies is supported by NSF. A. C. acknowledge the hospitality of the CPS, where this work has been initiated.
REFERENCES
- [1] P. Bak, C. Tang and K. Wiesenfeld, Phys. Rev. Lett. 59, 381 (1987); Phys. Rev. A 38, 364 (1988).
- [2] Avalanches were recorded in frictional sliding: S. Ciliberto and C. Laroche, J. Phys. I (France) 4, 223 (1994); type II superconductors: S. Field, J. Witt, F. Nori, and X. Ling, Phys. Rev. Lett. 74, 1206 (1995); magnetic systems: G. Durin, G. Bertotti and A. Magni, Fractals 3, 351 (1995); D. Spasojević, S. Bukvić, S. Milosević and H. E. Stanley, Phys. Rev. E 54, 2531 (1996); fractures: A. Garciamartin, A. Guarino, L. Bellon and S. Ciliberto, Phys. Rev. Lett. 79, 3202 (1997); earthquakes: G. Gutenberg and C. F. Richter, Ann. Geophys 9, 1 (1956).
- [3] A. Vespignani and S. Zapperi, Phys. Rev. Lett. 78, 4793 (1997); Phys. Rev. E 57, 6345 (1998).
- [4] S. S. Manna, J. Phys. A 24, L363 (1991).
- [5] L. Pietronero, A. Vespignani and S. Zapperi, Phys. Rev. Lett. 72, 1690 (1994); A. Vespignani, S. Zapperi and L. Pietronero, Phys. Rev. E 51, 1711 (1995).
- [6] R. Dickman, A. Vespignani and S. Zapperi, Phys. Rev. E 57, 5095 (1998);A. Vespignani, R. Dickman, M. A. Muñoz, and S. Zapperi, preprint cond-mat/9806249.
- [7] We note that directed models (D. Dhar and R. Ramaswami, Phys. Rev. Lett. 63, 1659 (1989)) belong to a different universality class. The classification is different in one dimension (L. A. N. Amaral and K. B. Lauritsen Phys. Rev. E 56, 231 (1997)).
- [8] Y. C. Zhang, Phys. Rev. Lett. 63, 470 (1989).
- [9] A. Díaz-Guilera, Europhys. Lett. 26, 177 (1994); A. Corral and A. Díaz-Guilera, Phys. Rev. E 55, 2434 (1997).
- [10] P. Grassberger and S. S. Manna, J. Phys. (France) 51, 1077 (1990); S. S. Manna, J. Stat. Phys. 59, 509 (1990); Physica A 179, 249 (1991).
- [11] A. Ben-Hur and O.Biham, Phys. Rev. E 53, R1317 (1996).
- [12] K. Christensen, H. C. Fogedby and H. J. Jensen, J. Stat. Phys. 63, 653 (1991).
- [13] This classification is not correct since D. Dhar (preprint cond-mat/9808047) has recently shown that the Manna model is Abelian.
- [14] E. Milshtein, O. Biham and S. Solomon, Phys. Rev. E 58, 303 (1998); preprint cond-mat/9805206.
- [15] M. De Menech, A. L. Stella and C. Tebaldi, preprint cond-mat/9805045.
- [16] A. Chessa, E. Marinari, A. Vespignani and S. Zapperi, Phys. Rev. E 57, R6241 (1998).
- [17] S. Lübeck and K.D. Usadel, Phys. Rev. E 55, 4095 (1997); ibid. 56, 5138 (1997); S. Lübeck, ibid 56, 1590 (1997).
- [18] For information see the web-site: http://kalix.dsf.unica.it/
| Model | ||||
|---|---|---|---|---|
| Manna | ||||
| BTW |