Theory of the “Honeycomb Chain-Channel” Reconstruction of Si(111)31
Abstract
First-principles electronic-structure methods are used to study a structural model for Ag/Si(111)31 recently proposed on the basis of transmission electron diffraction data. The fully relaxed geometry for this model is far more energetically favorable than any previously proposed, partly due to the unusual formation of a Si double bond in the surface layer. The calculated electronic properties of this model are in complete agreement with data from angle-resolved photoemission and scanning tunneling microscopy.
pacs:
PACS numbers: 73.20.At, 79.60.Bm, 68.35.BsThe surfaces of silicon reconstruct in strikingly diverse ways. This diversity provides a rich proving ground for simple, physically intuitive ideas about the stability of semiconductor surfaces—ideas which are invaluable for understanding more complex dynamical phenomena such as growth, etching, and reactivity. Two such simple concepts—elimination of surface dangling bonds and relief of surface stress—explain the frequent appearance of elementary “building blocks” in silicon reconstructions. For example, dimers appear on Si(001)21 (and its variants), (111)77, (113)32, (114)21, and (5,5,12)21; -bonded chains appear on (111)21 and (5,5,12)21; and adatoms appear on the (111)77, (113)32, (114)21, and (5,5,12)21 reconstructions (see Ref. [1] and citations therein).
One reconstruction that remains controversial is the metal-induced /Si(111)31 (where =Li, Na, K, Ag, Mg), which is widely believed to have a single common structure. Starting from known building blocks, we and others have recently proposed two models for this reconstruction, both with low dangling-bond density and low surface stress [2, 3, 4, 5, 6]. First-principles total-energy calculations showed these models to be stable relative to previously proposed ones [6]. The more stable of the two, the extended Pandey chain model, was also consistent with scanning tunneling microscopy (STM) images, but the calculated surface-state band structure of both models was in serious disagreement with angle-resolved photoemission (ARPES) data [7].
In this Letter, we examine theoretically a new model for the :31 surface proposed very recently by Collazo-Davila, Grozea, and Marks (CGM) on the basis of direct phasing of transmission diffraction data [8], and independently by Lottermoser et al. from surface x-ray diffraction and total-energy calculations [9]. First, starting from coordinates obtained by CGM, we further relax the atomic positions so as to minimize the calculated total energy. The resulting model is by far the most stable of any proposed to date. Second, we show how a nearly perfect “surface symmetry” of this reconstruction neatly resolves a long-standing puzzle regarding ARPES data for Li:31 (and may also explain the apparent insulating nature of Mg:31, which has an odd number of electrons per unit cell). Third, we show that this model derives its remarkable stability from the formation of a true Si double bond—a “building block” not seen on any other surface of silicon. Finally, we show that this model completely accounts for the appearance of the existing STM images (including the differences between =Li and Ag).
The model proposed by CGM was based on data from Ag:31 [8]. Previous experimental results from low-energy electron diffraction [10], STM [11], and core level spectroscopy [2, 7] suggest that Li, Na, K, Ag, and Mg all have the same reconstruction (apart from several details discussed later). For this reason we concentrate first on Li:31, which leads to a slightly simpler physical picture, and then later discuss the differences between Li:31 and Ag:31. Starting from the atomic positions determined by CGM, we performed full structural relaxation using first-principles electronic-structure methods. The calculations used a double-sided slab geometry with 14 layers of Si plus Li, with a vacuum region equivalent to 10 layers of Si. The four innermost layers of Si were fixed, while all other atoms were allowed to relax until the rms force was less than 0.02 eV/Å. Total energies and forces were calculated within the local-density approximation (LDA), using Troullier-Martins pseudopotentials and a plane-wave basis with a kinetic-energy cutoff of 12 Ry, as implemented in the fhi96md code [12]. Four -points were used to sample the surface Brillouin zone.
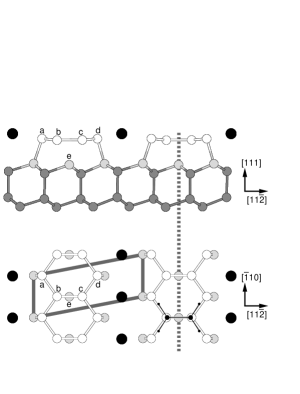
The fully optimized structure is shown in Fig. 1. Several observations will motivate our discussion below. (1) There are four inequivalent Si surface atoms (labeled a, b, c, d in Fig. 1) which form a “honeycomb chain” lying in a plane parallel to the surface. (2) Each of these surface Si atoms is threefold coordinated: outer atoms a and d roughly tetrahedrally, and inner atoms b and c in a planar configuration. (3) Electron density plots show that b and c are only very weakly bonded to the first-layer Si atom, e, below. (4) The Li atom sits in a channel formed by neighboring honeycomb chains, and occupies a symmetric location with respect to the [10] direction—that is, it preserves the [10] mirror plane. (5) Electron density plots show that the Li atom is fully ionized.
To compare the stability of this model with previous ones we compute the surface energy, , where is the total energy of a reconstructed slab supercell containing Si atoms, and is the total energy per atom of bulk Si. Relative to the extended Pandey model, which is the lowest energy model to date [6], this “honeycomb chain-channel” (HCC) model has a surface energy lower by 0.52 eV per 31 cell, or 14 meV/Å2—an enormous energy gain on the scale of silicon surface reconstructions (and in good agreement with the LDA result of Ref. [9]).
A structural model with five under-coordinated atoms would appear to be energetically unfavorable, so how can we understand the very low calculated surface energy of the HCC model? We develop here a simple intuitive picture for this stability, one which also resolves an apparent discrepancy regarding ARPES data for Li:31. The measured spectra reveal a single surface state, dispersing downward from toward the A point, i.e., along the [10] direction [7]. The apparent absence of additional states is puzzling since, roughly speaking, each surface orbital is expected to give rise to a surface state—and the 31 structural models proposed to date have at least three surface orbitals. Indeed, the HCC model has five unsaturated Si surface orbitals, and so should give rise to five surface states. There are six electrons available to fill these states—four from the Si surface atoms (a, b, c, d), one from the Li ion, and one from e—and so we expect three filled surface states and two empty states.
The theoretical band structure, part of which is shown in Fig. 2, confirms this description and illustrates the discrepancy. Three surface states, labeled , are fully occupied and one, labeled , is completely empty (the other empty state lies higher and is not shown). For the occupied states, the single peak in the ARPES data, also shown in Fig. 2, lies between and thus is consistent with and , but is completely inconsistent with .
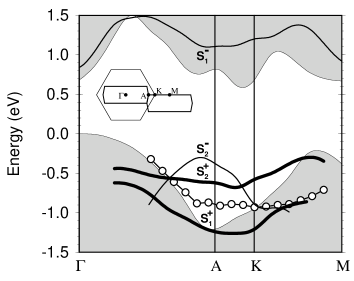
The resolution to this discrepancy provides internally consistent evidence in support of the HCC model itself, and also explains its surprising stability. Our argument is that the photoemission cross-section is large for states and , but small or vanishing for . Specifically, if the plane defined by the incident light beam and the photoelectron detector is a mirror plane of the crystal, then the states along that direction in reciprocal space have either even or odd parity. Given this condition, the photoemission matrix element, , will vanish by symmetry for two situations: (i) when the polarization vector, A, is normal to the mirror plane and the initial wave function, , has even parity; or (ii) when A is parallel to the mirror plane and has odd parity [13].
The ARPES data shown in Fig. 2 are from a synchrotron light source with the incident beam, detector, and polarization vector all lying in the plane defined by the surface normal and the [10] direction, i.e. the plane normal to [11]. This plane is shown in Fig. 1 as a heavy dotted line. It is clearly not a mirror plane with respect to either the Li atoms or the Si substrate. However, the Li atoms are completely ionized, and the substrate atoms do not contribute significantly to the surface states. Hence neither is relevant to determining the surface symmetry. The relevant atoms are those in the surface layer (a, b, c, d) and perhaps the first layer. Fig. 1 shows that for these atoms the dotted line is a nearly perfect mirror plane.
The extent to which this approximate symmetry leads to surface states with definite parity can be easily evaluated. Given an exact mirror-plane symmetry and a set of orbitals, , associated with atoms a through e, the five symmetry-adapted basis functions will have even () and odd () parity:
| (1) |
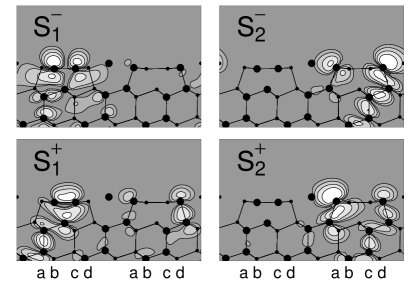
In Fig. 3 we show the squared modulus of the four surface states from Fig. 2, evaluated near the A point along the [10] direction. This figure clearly shows that is a linear combination of and and thus has overall even parity (the orthogonal state, not shown, is 2 eV above the valence edge), while has odd parity, as evidenced by the node at the mirror plane. Likewise, and have overall even and odd parity, respectively. Having shown that the existence of an approximate surface mirror-plane symmetry indeed leads to surface states with approximate parity, we conclude that the matrix element for photoemission from the states and will be very small. This explains the absence of any signal from in the ARPES data. Moreover, we note that the single peak in the ARPES spectra is quite broad, with a FWHM of 0.7–0.8 eV. We suggest that this broad peak is in fact a superposition of states and . Indeed, excellent fits of the zone boundary spectrum can be obtained by using two Voigt functions, representing and , separated by 0.4 eV.
The description of the occupied surface states in terms of a symmetry-adapted basis also leads to a simple explanation for the stability of the HCC model. The largest contribution to the state is from the basis function, which is an even combination of orbitals separated by one Si bond length—and thus bonding with respect to b and c. The antibonding combination of these orbitals, , is unoccupied. This suggests the existence of a true Si double bond, between atoms b and c, which we propose is primarily responsible for the stability of the HCC model. Indeed, the energy splitting between and is almost 2 eV, far larger than the bonding-antibonding splitting (less than 0.5 eV) for the extended Pandey chain.
The Si double bond, although unusual, also occurs in a variety of molecular systems. In the first known example, the Si=Si bond was sterically stabilized by two mesityl groups bonded to each Si [14]. The simpler disilene molecule, Si2H4, has a planar structure (see Fig. 1) essentially identical to the arrangement of atoms a, b, c, d in the HCC reconstruction. Here, the bonds from the substrate to a and d play the role of steric stabilizers.
We turn now to the appearance of the /Si(111)31 surface in STM images. Experimental filled-state images of Li:31 appear as double rows of staggered maxima with approximately equilateral spacing; empty-state images appear as narrow lines with small spurs on both sides [11]. It is at first difficult to reconcile the STM image of staggered maxima with the model of Fig. 1, which has a mirror plane at the center of each chain. This, too, has a natural explanation. The 31 surface periodicity implies a half-period shift between adjacent chains along the [10] direction. Thus, orbitals and from two adjacent chains should give rise to a double row of spots with approximately equilateral spacing. Both and lie within 0.5 eV of the valence-band maximum, so that filled-state images with this bias voltage or larger should appear as described.
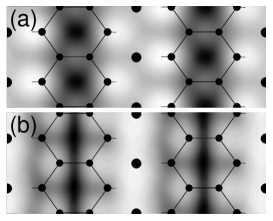
In Fig. 4 we show theoretically simulated constant-current STM images for the HCC model, obtained by integrating the local-state density over a 1.5-eV energy window for both filled and empty states. The filled-state simulated image confirms our qualitative description, and is in excellent agreement with experimental STM images of Li:31. (Note also a small contribution from the state, which contributes to this simulated image because of the large bias voltage chosen.) The empty-state simulated image is also in excellent agreement with experiment, appearing as a single row, centered on the Li ions, with small side spurs. This is easily understood as the superposition of the unoccupied Li 2 atomic state and the unoccupied surface state. We also remark that the registry of the filled- and empty-state images has been determined experimentally with respect to both the [10] and [11] directions [11], and is in identical to that of the simulated images in Fig. 4.
We return now to the differences between =Li and Ag. We repeated the above procedure, starting from the geometry determined by CGM for the Ag:31 surface and using an appropriately higher energy cutoff of 40 Ry for the Ag pseudopotential. In the fully relaxed geometry, the Ag atom—in contrast to Li—occupies an asymmetric location with respect to the [10] direction and thus breaks this mirror-plane symmetry. With respect to the bulk crystal, the asymmetry is 0.66 Å, in very good agreement with the diffraction result of 0.58 Å[8]. Moreover, this asymmetry distorts the triangular spacing observed for Li:31, and leads instead to a pairing of atoms a and d from adjacent chains. Physically, this asymmetry is driven by the formation of weak Ag-Si bonds, which favors two-fold coordination of the Ag atom—in contrast to the purely electrostatic interaction of Li and Si, which favors three-fold coordination of the Li atom. Furthermore, this symmetry breaking is accompanied by a distortion of the surface-layer Si atoms in which the chain hexagons are rotated by 7∘ (these distortions were not modeled experimentally). This rotation leads to bond strains which can be partially relieved by alternating the sense of the Ag asymmetry in adjacent channels. Indeed, we find that this 61 reconstruction, which has paired Si atoms but unrotated hexagons, is lower in energy by 5 meV/Å2 relative to Ag:31. These differences have been widely observed in comparative STM studies, which indeed find asymmetrically paired maxima and 61 periodicity for =Ag, but not for Li [11, 15].
Finally, we suggest a reinterpretation of a recent photoemission experiment for Mg:31 [16]. Since Mg is divalent, a band description of Mg:31 must be metallic. But high-resolution ARPES data shows no peak crossing the Fermi level, and on this basis was interpreted as evidence for a Mott-Hubbard insulator phase [16]. Our calculations for Mg:31 suggest a different interpretation, motivated by two important results: (1) The fully relaxed HCC model for Mg:31 is very similar to Li:31; in particular, the mirror plane normal to [11] is again nearly perfect. Thus, by the symmetry argument made above for Li:31, the matrix element for odd-parity states will vanish when the incident light is polarized parallel to the mirror plane. (2) The band structure of Mg:31 is very similar to Li:31, with one striking exception: the state is pulled down from the conduction manifold to sit approximately midgap, pinning the Fermi level at 0.5 eV above the valence-band edge. The ARPES data shows two surface states (labeled and in Fig. 3 of Ref. [16]) whose dispersion is in excellent agreement with and in Fig. 2. The odd-parity state is not observed in the data; we propose that is not observed for the same reason. In other words, Mg:31 is likely a normal band metal, but appears insulating as a result of selection rules. Photoemission using unpolarized light would, we predict, show a peak at the Fermi level.
In summary, we have shown theoretically that the honeycomb chain-channel reconstruction model for /Si(111)31 is energetically far more favorable than any other model proposed to date. The stability of this model is largely due to the formation of true Si double bonds in the surface layer. For Li:31 and Mg:31, the existence of a mirror-plane symmetry implies that the surface states have definite parity—consistent with the findings of angle-resolved photoemission data. Finally, this model gives a complete accounting of both filled- and empty-state STM data, including the important differences between Li:31 and Ag:31 surfaces.
Enlightening discussions with R.W. Nunes are acknowledged. Computational work was supported by a grant of HPC time from the DoD Major Shared Resource Center ASCWP. S.C.E. is funded by ONR. H.H.W. is funded by NSF under Contract No. DMR-9705246. Oak Ridge National Laboratory is managed by Lockheed Martin Energy Research Corp. for the U.S. Department of Energy under Contract No. DE-AC05-96OR22464.
REFERENCES
- [1] A. A. Baski, S. C. Erwin, and L. J. Whitman, Surf. Sci. 392(1-3), 69 (1997).
- [2] T. Okuda et al., Surf. Sci. 321, 105 (1994).
- [3] K. Sakamoto et al., Phys. Rev. B 50, 1725 (1994).
- [4] G. C. L. Wong et al., Phys. Rev. Lett. 73, 991 (1994).
- [5] H. H. Weitering et al., Phys. Rev. B 49, 16 837 (1994).
- [6] S. C. Erwin, Phys. Rev. Lett. 75, 1973 (1995).
- [7] H. H. Weitering, X. Shi, and S. C. Erwin, Phys. Rev. B 54, 10585 (1996).
- [8] C. Collazo-Davila, D. Grozea, and L. D. Marks, Phys. Rev. Lett. 80, 1678 (1998).
- [9] E. Lottermoser et al., Phys. Rev. Lett. 80, 3980 (1998).
- [10] W. C. Fan and A. Ignatiev, Phys. Rev. B 41, 3592 (1990).
- [11] K. J. Wan, X. F. Lin, and J. Nogami, Phys. Rev. B 46, 13 635 (1992); 47, 13 700 (1993).
- [12] M. Bockstedte, A. Kley, and M. Scheffler, Computer Physics Commun. 107, 187 (1997).
- [13] E. W. Plummer and W. Eberhardt, Adv. Chem. Phys. 49, 533 (1982).
- [14] R. West, M. J. Fink, and J. Michl, Science 214, 1343 (1981).
- [15] J. M. Carpinelli and H. H. Weitering, Surf. Sci. 331-333, 1015 (1995).
- [16] K. S. An et al., Surf. Sci. Lett. 337, L789 (1995).