A Simple Model of Superconducting Vortex Avalanches
Abstract
We introduce a simple lattice model of superconducting vortices driven by repulsive interactions through a random pinning potential. The model describes the behavior at the scale of the London length or larger. It self-organizes to a critical state, characterized by a constant flux density gradient, where the activity takes place in terms of avalanches spanning all length scales up to the system size. We determine scaling relations as well as four universal critical exponents for avalanche moments and durations: , , , and , for the system driven at the boundary.
PACS numbers: 64.60.Lx, 64.60Ht, 74.60Ge
Flux penetrates hard superconductors in the form of quantized vortices that move via over-damped dynamics subject to repulsive interactions from other vortices and to random pinning forces due to inhomogeneities in the material. Vortex interactions, represented by a modified Bessel function , decay with the London length, , that is much larger than either the size of the vortex cores or of the point pinning centers. By slowly increasing the external magnetic field on a thin superconducting shell, vortex avalanches entering the interior have been observed to have a broad distribution of sizes [1], indicating self-organized criticality [2]. Two dimensional molecular dynamics (MD) models [3] of these experiments [4] indicate that vortex motion within the superconductor also takes place in terms of avalanches over all length scales up to the system size. Systems of several thousand vortices corresponding to up to about have been numerically studied with this technique [4].
In order to explore critical behavior in the thermodynamic limit much larger system sizes are required. For this purpose, it would be desirable to study a simpler model in the same universality class. Although it is not known to what extent universality exists in self-organized critical (SOC) phenomena, a broad universality class encompassing one dimensional granular piles [5], interface depinning [6], and earthquake models has been discovered [7]. This lends plausibility to the concept, well known in equilibrium critical phenomena, that simple models can describe the large scale behavior of real physical systems where the microscopic interactions are much more complicated. In particular, a simple model may exist which is in the same universality class as the actual vortex system with avalanches of all sizes. Beyond this point, a conceptual understanding of the interplay between repulsive vortex interactions and random pinning would be aided by a minimal model that captures the essential features of collective vortex dynamics.
With this view, we introduce a coarse grained lattice model to describe a vortex system at the scale of that discards the identification of individual vortices, along with almost all of the microscopic degrees of freedom at scales smaller than . Our model is minimal, incorporating only what may be the essential features of collective vortex dynamics: over-damped motion of vortices, repulsive interactions between vortices, attractive pinning interactions at lattice defects, and to describe the experiment in Ref. [1], boundary driving. One can imagine imposing a grid of cells on the system. In our model, vortices correspond to a vortex number in an extended region () of the actual physical system, and the pinning corresponds to a number of point pins in an extended cell. Each lattice site in our model can hold many vortices, and can have a different, albeit quenched, pinning potential, due to the underlying randomness in the positions and strengths of the microscopic pinning centers. Studying our lattice model numerically, we can readily simulate much larger systems than with MD simulations, giving us a tool to explore scaling and phase transitions in the thermodynamic limit, where the system size, , is large compared to the range of vortex interactions, . A previos lattice model has been proposed by Jensen [8]. Our model differs from his in a number of significant ways. The most important difference is that we allow multiple vortices to occupy each site, consistent with the coarse graining idea [9].
We find that our simple model exhibits self-organized criticality. The observed critical exponents are universal in the sense that they do not vary over a range of parameter values in the model. We drive our system in a manner that represents the experiments of Field et al [1]. As vortices are slowly pumped in at the left end of our system and allowed to leave at the right end, the gradient of the vortex density builds up to a constant value throughout the system, in agreement with the picture of Bean [10]. The vortex model acts like a pile of sand! It is important to note that the vortex pile is not minimally stable (which is a local criterion first suggested by Bean), but it is marginally stable [2]. The minimally stable state is unstable to plastic deformations or avalanches. The actual condition of criticality is a global one where no length scale other than the system size plays any role whatsoever. We find a temporal pattern of intermittent bursts of vortices leaving the system, as well as internal avalanches. We apply finite size scaling methods to the histograms for the sizes and duration of avalanches, determining four critical exponents, which agree with known scaling relations for a boundary driven system. The values of the critical exponents found are close to those of the two dimensional “linear” interface model [6], suggesting a common universality class.

Our model is a coarse-grained representation of the microscopic vortex dynamics in which the force on a vortex is given by given by the over-damped equation of motion , where is the sum of the repulsive forces from other vortices, is the sum of the attractive forces from the pinning centers, and is the velocity of vortex [3, 4]. We consider a two dimensional honeycomb lattice. Each lattice site is occupied by an integer vortices, and has three nearest neighbors. Vortices repel others occupying the same lattice site and, more weakly, those on nearest neighbor sites. There is also an attractive pinning force at random sites. As in the microscopic case, both of these coarse-grained forces are the gradient of a potential. The force on a vortex at a site in the direction of a nearest neighbor site is calculated by taking a discrete gradient of the sum of those two potentials,
| (1) | |||
| (2) |
where , , and are the nearest neighbors of , and , , and are the nearest neighbors of . The scale of the problem is set so that strength of the on-site force is unity, and strength of the nearest neighbor force is . The strength of the quenched random pinning potential at , , is chosen to be with probability , and 0 with probability . Thus, the density of pinning centers is , and there are three parameters in the model: , , and . In the figures shown here we use the parameters . We have also simulated systems with , and . In all four cases, the critical exponents remained unchanged within numerical errors.
A vortex moves one lattice site in a direction when the force in that direction is greater than zero. Thus, even sites with can pin vortices. If there is more than one unstable direction for a vortex to move in, one direction is picked at random. All lattice sites are updated in parallel, and only one vortex can move from each site on a particular update. As in experiments, any vortex that reaches the right edge of the system is removed. Vortices are forbidden to move off the left edge of the system [11]. Periodic boundary conditions apply at the top and bottom of the lattice. We use approximately square systems so that the avalanches do not wrap around on themselves.
An avalanche is initiated by adding a vortex to a stable configuration at a randomly chosen site on the left, or loading, edge of the lattice. The avalanche continues by repeatedly updating the lattice until there are no longer any unstable directions for a vortex at any lattice site, and the configuration is again stable. The limit of slow driving is achieved by adding a vortex to the loading edge only after the previous avalanche has ended.
Initially, the vortex pile is empty. As it fills up with vortices, eventually a chain reaction of sliding events leads to one or more vortices leaving the system at the output edge. The global cascade of events (topplings) is due to the local repulsive interactions of vortices. An avalanche constitutes a type of generalized branching process because a toppling at one site can only affect its nearest and next nearest neighbors at the next time step. This fact allows an efficient list algorithm to be used to simulate the system, checking only sites on the list of possibly active sites for instability. Eventually for every vortex added, one on average leaves the system. In this stationary state, the average vortex density acquires a constant gradient throughout the system. The vortices form a vortex pile, with fluctuations about an average slope much like a sand pile.
In Fig. 1, we show a time series of the activity in the stationary state for a system with . The activity takes place intermittently with bursts over all temporal scales up to a cutoff that grows with system size. When a given bursts ends, at a time , the activity reaches zero and another vortex is added at the loading edge. Fig. 1(a) shows the number of vortices that fall off the right edge as a function of time. It has a similar qualitative appearance to that seen in experiments [1]. Figs. 1(b) and 1(c) show the number of moving vortices as a function of time. These signals are qualitatively similar to what is seen in MD simulations [4]. Within each avalanche there are “bursts within bursts”.
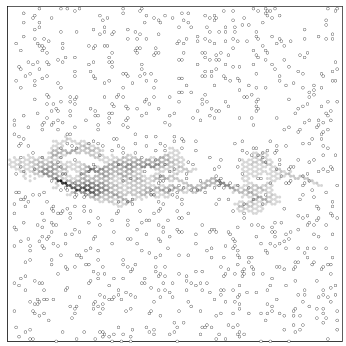
The spatial behavior of an avalanche in the stationary state is shown in Fig. 2. The number of topplings at a given site is represented by a grey scale. Qualitatively, the avalanche has an inhomogeneous behavior, with holes where there is no activity inside a region of activity. One can characterize an avalanche by the maximum extent of its penetration in the direction of flow, , the total number of topplings in the avalanche, , its duration, , and , among other quantities. Because the mass of the avalanche represents the time integral over the sequence of topplings, , as in other models of SOC. The scaling dimensions of these variables are defined for avalanches as and [12].
In analogy with other models of SOC [12], as well as other critical phenomena, we use the following scaling ansatz for the probability distribution to have an avalanche of size in a system of linear extent :
| (3) |
This scaling ansatz is confirmed for our vortex model by numerical simulations as shown in Fig. 3. The avalanche dimension, , and the distribution exponent, , are not independent for our boundary driven system. In the stationary state, every row, on average, must transfer one vortex to the right. In this case, the average avalanche size size where is some constant. We find , slightly larger than one since some toppling events occur counter to the average flow. (For the one dimensional Oslo model [5] exactly [7].) We have checked to see that the actual moment of the sliding has the same dimension as the total number of topplings; so that the back topplings are not significant. The requirement leads to . We align the cutoff regime in the data collapse plot to determine and choose to give a flat plateau in the data collapse over four orders of magnitude in . These values agree perfectly with the above scaling relation.

A similar scaling ansatz is used for the probability distribution to have an avalanche of duration in a system of linear extent :
| (4) |
where the dynamical exponent determines the system size cutoff in durations . Conservation of probability gives an additional scaling relation , where is the histogram exponent for the spatial penetration of avalanches [12]. Here . Since for every avalanche, its size is greater than or equal to its duration, and . In Fig. 4, we use the position of the cutoff region to find and choose to give a flat plateau in the data collapse. These values obey the scaling relation above.
Note that the values for and are very close to those measured for the “linear” interface depinning model in two dimensions, where and [6, 12]. The histogram exponents differ when these models are driven uniformly, rather than at the boundary. For uniform driving .
The distribution of fall off events can be determined by measuring the total number of vortices, , that leave the system in each avalanche. This distribution is broad up to a cutoff that diverges with system size as , but it does not appear to show power law behavior for . However, since the system is driven at the opposing boundary, only the few avalanches that cross the system make any vortices fall off the output edge. Thus the statistics for the fall off data are not as good as that of the quantities characterizing internal avalanches. Also, to our knowledge, there is no reason to expect that the fall off distribution should be a power law, even though the internal avalanche size distribution is itself a power law. Experiments have measured fall off distributions from time series involving about avalanches in a system with . Both the value of the cutoff and the apparent power law appeared to depend on the magnitude of the external magnetic field. This dependence could be consistent with our results. The problem of interpreting fall off data exists in many other SOC systems as well [13].

Ideally, experiments to measure internal avalanches could be devised. For example, Yeh and Kao [14] attached a SQUID to a superconducting sample and were able to measure fluctuations associated with the flux flow. In order to compare with our results an array of SQUIDs could be used. Alternatively, it may eventually be possible using Lorentz microscopy techniques [15]. MD simulations do provide some points of comparison for scaling behavior of internal avalanches. Those results, however, have not been cast using collapse techniques due, presumably, to the finite size limitations in . In any event, the exponent in Ref. [4] varied for different parameter values over a range . We suspect that this variation is a finite size effect. Nevertheless our value falls within this range [16]. We propose that the scaling relation for the average moment would also hold for the MD simulations, and for the real physical system, as well.
Although the SOC behavior we observe in the vortex lattice model is robust, having universal critical exponents over a range of parameters, it is possible that the behavior changes for parameters outside the range we have reported here. For example, for a sufficiently rugged pinning landscape, the vortex motion may be locked into isolated channels, introducing a scale in the avalanche distribution [4, 17], consistent with the experiments of Zieve et al [18]. Similarly, for a sufficiently flat pinning potential the avalanches become very wide and may have a characteristic size as well. We are currently investigating both of these situations. It would be interesting to study other properties of vortex dynamics using our model. These include magnetic relaxation [19], hysteresis, aging, using a vortex weakened pinning potential to take into account interstitial pinning, driving the system at a finite rate, or in a different manner that would correspond to applying an electrical current.
We thank G. Reiter, F. Nori, and P. Bak for helpful discussions.
REFERENCES
- [1] S. Field, et al., Phys. Rev. Lett. 74, 1206 (1995).
- [2] P. Bak, C. Tang, and K. Wiesenfeld, Phys. Rev. Lett. 59, 381 (1987); Phys. Rev. A. 38, 364 (1988); for a review see P. Bak, How Nature Works: The Science of Self-Organized Criticality, (Copernicus, New York, 1996).
- [3] H. J. Jensen, et al., Phys. Rev. Lett. 60, 1676 (1988); Phys. Rev. B 38, 9235 (1988).
- [4] C. J. Olson, et al., Phys. Rev. Lett. 80, 2197 (1998); Phys. Rev. B 56, 6175 (1997); Physica C 290, 89 (1997).
- [5] K. Christensen, et al., Phys. Rev. Lett. 77, 107 (1996).
- [6] H. Leschhorn, Physica A 195, 324 (1993).
- [7] M. Paczuski and S. Boettcher, Phys. Rev. Lett. 77, 111 (1996).
- [8] H. J. Jensen, Phys. Rev. Lett. 64, 3103 (1990).
- [9] Also, our model driven in a different way, with a different dynamical update rule.
- [10] C. P. Bean, Rev. Mod. Phys. 36, 31 (1964).
- [11] The forces on the vortices at sites on the left edge of the lattice are calculated by assuming that their nearest neighbor sites just off the lattice are occupied by the same number of vortices as that site had the last time a new vortex was added to the lattice at that site.
- [12] M. Paczuski, et al., Phys. Rev. E 53, 414 (1996).
- [13] V. Frette, et al., Nature 379, 49 (1996).
- [14] W.J. Yeh and Y.H. Kao, Phys. Rev. Lett. 53, 1590 (1984).
- [15] T. Matsuda, et al., Science 271, 1393 (1996).
- [16] It is important to note, however, that the distribution of avalanche lifetimes do not compare well. Ref. [4] reports a critical exponent for ( in their notation) which not only is smaller than some of their reported values for , violating , but also considerably smaller than our . Note that our exponent corresponds to in Ref. [4].
- [17] O. Pla, et al., Europhys. Lett. 33, 297 (1996).
- [18] R. J. Zieve, et al., Phys. Rev. B 53, 11849 (1996).
- [19] C. M. Aegerter, Phys. Rev. E (in press).