Multiple scattering of classical waves: from microscopy to mesoscopy and diffusion
Abstract
A tutorial discussion of the propagation of waves in random media is presented. In first approximation the transport of the multiple scattered waves is given by diffusion theory, but important corrections are present. These corrections are calculated with the radiative transfer or Schwarzschild-Milne equation, which describes intensity transport at the “mesoscopic” level and is derived from the “microscopic” wave equation. A precise treatment of the diffuse intensity is derived which automatically includes the effects of boundary layers. Effects such as the enhanced backscatter cone and imaging of objects in opaque media are also discussed within this framework. In the second part the approach is extended to mesoscopic correlations between multiple scattered intensities which arise when scattering is strong. These correlations arise from the underlying wave character. The derivation of correlation functions and intensity distribution functions is given and experimental data are discussed. Although the focus is on light scattering, the theory is also applicable to micro waves, sound waves and non-interacting electrons.
Contents
toc
I Introduction
Transport of waves through opaque media is a subject of interest in daily life. Examples are light transported through fog, clouds, milky liquids, white paint, paper, and porcelain, but also electromagnetic waves transported through stellar atmospheres and interstellar clouds. Nowadays transport of visible light through human tissue is being used as a noninvasive technique to detect, for instance, breast cancer.
Some basic properties of diffuse light are well known. On a cloud-less day we see the immediate radiation from the sun. When a cloud passes in front of the sun, the light first becomes weaker and diffuse. When the cloud has become thick enough, the sun becomes invisible; this happens when the cloud thickness is of the order of a mean free path. On a cloudy day there is no direct view of the sun, but there is still light: it is diffuse light coming from many directions. It has propagated diffusely through the cloud and leaves it in random directions, partly in the direction we are looking.
The study of diffuse wave transport was started by astrophysicists. They wanted to understand how radiation created in the center of stars is affected when it traverses an interstellar cloud. Well-known books in this field were written by ?) and ?). For more mundane applications, such as the detection of a school of fish using acoustic waves, see ?).
It is the purpose of this review to present a comprehensive, self-contained text intended for laboratory applications of diffuse wave transport. We explain how the transfer equation follows from the wave equation and how radiative corrections can be calculated. Though the approach can be applied to any geometry, we shall focus mainly on slab geometries.
In Sec. II we discuss some general aspects of wave scattering, such as diffusion and Anderson localization. In Sec. III we recall the basic concept of the radiative transfer equation. Next we begin a detailed analysis in section IV with the underlying wave equation in the scalar approximation. We explain the notions of matrix and cross section. In Sec. V we consider the amplitude or dressed Green’s function. We discuss how extinction is related to the self-energy. Next we consider propagation of intensity via the Bethe-Salpeter equation. We use the simplest case, the ladder approximation, to derive a transport equation equivalent to the radiative transfer equation. This equation then describes not only diffusion in the bulk, but also the precise behavior at the boundaries. Various experimentally relevant situations are considered in detail: transport in a bulk medium,through very thick (semi-infinite), and through finite slabs; the enhanced backscatter cone; exact solutions of the Schwarzschild-Milne equation; the regime of large index-mismatch; semiballistic transport; and imaging of objects hidden in opaque media (sections VI-XIII).
With these ingredients we consider in the second part correlations of intensities. This leads to three kinds of observable correlation functions, the angular correlation function , the correlation of total transmission , and the correlation of the conductance . We explain how these functions are calculated and next we consider correlations between three intensities (third cumulants) and the full distribution of intensities.
A Length scales
The diffuse regime is formulated in the three inequalities [kavehvanhaeringen],
| (1) |
where is the wavelength, the mean free path, the sample size, the absorption length (for optical systems), and the incoherence length (for electronic systems). The first inequality ensures that localization effects (see below) are small; the second inequality implies that many scatterings occur if the wave transverses the system; the third inequality ensures that not all radiation is absorbed.
The description of radiation transport can occur on roughly three length scales:
-Macroscopic: On scales much larger than the mean free path the average intensity satisfies a diffusion equation. The diffusion coefficient enters as a system parameter that has to be calculated on mesoscopic length scales.
-Mesoscopic: On length scales of the mean free path , the problem is described by the radiative transfer equation or Schwarzschild-Milne equation. This is the Boltzmann-type equation for the system. At this level one needs as input the mean free path and the speed of transport , which should be derived from microscopics. In the diffusive regime this approach leads to the diffusion coefficient .
-Microscopic: The appropriate wave equation, such as Maxwell’s equations, the Schrödinger equation, or an acoustic wave equation, is used on this length scale. The precise locations and shapes of scatterers are assumed to be known. Together with the wave nature they determine the interference effects of scattered waves. In light-scattering systems the scatterers often have a size in the micron regime, comparable to the wavelength , which could lead to important resonance effects. The mesoscopic or Boltzmann description follows by considering the so-called ladder diagrams.
The microscopic approach will be the starting point for this review. Fundamental quantities, such as the self-energy and the Hikami box, can only be calculated on this level. The drawback of the microscopic approach is that it is too detailed. In practice the precise shape and positions of the scatterers often are not known and a mesoscopic or macroscopic description is necessary.
B Weak localization, closed paths and the backscatter cone.
The diffusion equation is a classical equation that fully neglects interference effects inherent to wave propagation. At this level of description there is no difference between diffusion of particles and of wave intensity. Whereas a transmission pattern of monochromatic (laser) light through an opaque medium is known to consist of speckles (bright spots on a dark background), the diffusion equation and the radiative transfer equation only describe the average intensity.
The wave nature of light immediately leads to a reduction in transmission due to interference effects. Following ?) we suppose that the transmission amplitude for a certain experiment is composed of many terms arising from physically different interference paths .
Some paths have closed loops, i.e. loops that return to the same scatterer. When such loops contain two or more common intermediate scatterers, they can be traversed in two directions. Let us consider one of such loops , and denote the contribution of the second, reversed loop by . Summing over all paths we have
| (2) |
The intensity is
| (3) |
When applied to electrons, quantum mechanics tells us that the and terms are probabilities, while and terms are interference contributions. Naively, one expects the second and third term to be small. Thus in Boltzmann theory only probabilities are taken into account, that is to say, the first term.
However, if there is time-reversal invariance, the second term will be equally large: there is a factor of for each closed loop. As a result, for the wave intensity there is a larger probability of return.
In optics there is a simply measurable effect due to this, namely the enhanced backscatter cone. When the incoming and outgoing light are in exactly the same direction, the light path may be considered closed. As predicted by ?) and detected by several groups [kuga, albada3, wolf] the average intensity in the backscatter direction has a small cone of height almost one and angular width . This observation has given an enormous push to the research of weak localization phenomena in optics.
This effect is a so-called weak localization effect. These effects occur if and are precursor of the so-called strong localization effects which occur if . These effects are also known as “mesoscopic,” indicating length scales between macroscopic (the diffusion equation) and microscopic (individual scattering events). Indeed, in electron systems these effects only show up in rather small samples due to inelastic scattering. For optical systems there is no such size restriction. The study of mesoscopic effects started in the field of electronic systems, and we shall use many results derived there.
For electronic systems weak localization effects were first analyzed by ?) in order to explain the Sharvin-Sharvin fluctuations of a resistance as function of the applied magnetic field [sharvin]. These so-called “magneto-fingerprints” show a seemingly chaotic conductance as the applied field is varied, but are perfectly reproducible as they are solely determined by the location of the scatterers. (Only at very low temperatures electron scattering is dominated by impurity scattering; at higher temperature scattering mainly arises from phonons.)
C Anderson localization
If scattering is very strong, the “weak localization” effects become of order unity, i.e., ( is of the order of 0.001-0.01 for visible light in standard laboratory situations). According to the criterion of ?) the diffusion constant will tend to zero at that point. The scattering process that causes the enhanced backscatter also reduces the diffusion constant. The amplitudes that make up the intensity, split and one of the amplitudes visits some of the scatters in reverse sequence, thus forming a loop. The diffusion constant is lowered by these processes. (The loop is somewhat similar to the renormalization of the effective mass in field theories.) If scattering is increased, the contribution of these loops becomes more and more important. It is not simply that the diffusion constant tends linearly to zero as scattering increases. Rather, the return probability of the intensity becomes higher and higher, reducing the diffusion constant in a stronger fashion. The diffusion constant can thus become zero at finite scatterer strength, meaning that the wave can no longer escape from its original region in space. This is the transition to the well-known Anderson localization [anderson].
In the Anderson localization regime there are only localized states. In the delocalized regime there exist extended states, responsible for diffusion. In the localized regime the intensity typically decays exponentially over one localization length, whereas in the diffuse regime the wave function extends up to infinity. There are thus two different phases, the diffuse, metallic regime and the localized, insulating regime. In three dimensions a phase transition from the extended to the localized state can occur. In one and two dimensions the states are always localized, provided the waves are non-interacting (for electrons also spin-orbit scattering has to be absent). Yet for a finite sample the localization length can be much larger than the system size, in which case the states appear to be extended and the conductance does not vanish. Note that the localization is solely the result of the interference of the waves scattered by the disorder. (This is not the only scenario for a metal-insulator transition in electron systems. Due to their fermionic nature and interactions, electron systems allow for a whole range of possible transitions between the conducting and insulating regimes; see ?)). Anderson localization is also called strong localization.
The precise behavior near and at the transition is not fully understood. The standard diagrammatic perturbation technique, which we use, works well for the description of diffusion and low order corrections, but it is not suited for the study of the transition. Therefore various techniques have been developed to study behavior near the transition and the phase transition itself.
An important step was the scaling theory of localization put forward by ?), which states that near the localization the only parameter of importance is the dimensionless conductance (the conductance measured in units of ). The scaling of as a function of sample size was studied earlier [thouless1, thouless2, wegner2]. Abrahams et al. extended those ideas and derived renormalization-group equations. They concluded that in one and two dimensions there is no real phase transition; the states are always localized. In three dimensions a phase transition can occur.
Classical diffusive transport is described by the ladder diagrams. The so-called maximally crossed diagrams are the next most important diagrams in the diffuse regime. They describe the leading interference terms responsible for the backscatter cone and reduction of the diffusion constant. Vollhardt and Wölfle summed self-consistently combinations of the ladder diagrams and the maximally crossed ones in the diffuse regime [vollhardt1, vollhardt2, vollhardt3]. They found that the diffusion constant vanishes at strong enough scatterer strength, thus providing a microscopic picture of the Anderson transition. As the maximally crossed diagrams yield loops of intensity, the approach can be seen as a self-consistent one-loop summation. Although a self-consistent approach will certainly not include all diagrams of higher order, the method works fine even close the transition [kroha1, kroha2], because the first few higher order correction terms vanish.
Another approach is to perform an exact average over the disorder within a field-theoretic approach. Next, one integrates over the fast fluctuations and is left with the slow variables of the system. This technique yields the so-called nonlinear sigma model [wegner, hikami, efetov1, altshulerboek]. With the resulting action it is possible to generate systematically all corrections to the diffusion process (in dimensions), allowing for an explicit foundation of the scaling theory.
A recent approach is that of random matrix theory. The basic assumption here is that the total scattering matrix of the system, although very complicated, can be described just by random matrix elements respecting the symmetries of the system. Surprisingly, this method works well, and just from the assumption of the random ensemble it predicts many features of the systems correctly and in a simple way. Its is, unfortunately, only applicable to quasi one-dimensional situations. An overview of the theory and applications of random matrix theory is given by ?) and ?).
Although some years ago there was hope that the Anderson transition might soon be reached for light scattered on disordered samples, it was not observed when this review was written. One did observe that in time resolved transmission measurements the average transmission time became very long. This was interpreted as an indication that the mean free path was very small, which would mean that the light was close to localization. It turned out, however, that the long transmission times arise since the light spends much time inside the scatterers. This meant that the Anderson localization was still out of reach [albada2].
D Correlation of different diffusons
Another interaction effect is the interference of a diffuse intensity with
another that has, for instance, a different frequency or position.
In this work we
shall concentrate on such processes which, lead to correlations in,
for instance, the transmitted beams. There are advantages to studying the
correlations above the loop-effects. The correlations can be measured more
accurately and easily in experiments than can renormalization effects.
Secondly,
it is an interesting feature of optical systems that there are three different
transmission measurements:
- Coming in with a monochromatic beam in one direction (this we call “channel ”) one can measure the intensity in the outgoing direction and define the angular transmission coefficient . Its correlation function is called the correlation and is of order unity, describing the large intensity difference between dark and bright transmission spots.
- One can also measure all outgoing light. In practice one uses an integrating sphere. This leads to the measurement of the total transmission,
| (4) |
Its correlation function is called the correlation function.
- Finally, one can also add the results of coming in from all possible directions, either by repeating the experiment under many different incoming angles or by using diffuse incoming light. This leads to a quantity
| (5) |
In analogy with electronic systems it is called the conductance. Its fluctuations are called fluctuations in optics. In electronics (where, for instance, the magnetic field is varied), they are called universal conductance fluctuations (UCF). Notice that these fluctuations are not temporal but static, since the scatterers are fixed. Both and correlations are low order corrections in , which acts as the small parameter giving the relative strength of the interference effects.
There are various books and proceedings on localization and mesoscopics in electron systems [nagaoka, ando, physicaa, vanhaeringen, vanhaeringen2, altshulerboekgeheel, hankeboek] and classical waves [kirkpatrick, sheng, kretaboek]. Many aspects of the Anderson transition have been discussed by ?).
II Macroscopics: the diffusion approximation
A Transmission through a slab and Ohm’s law
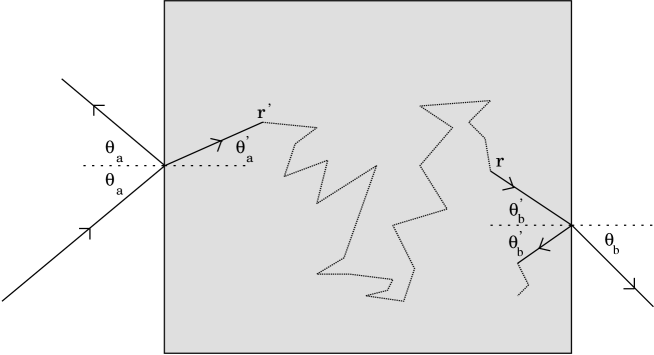
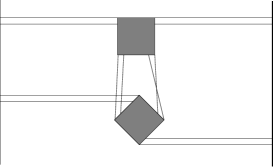
Consider the propagation of light through a slab of thickness (“plane parallel geometry”). As indicated in Fig. 1 a plane wave impinges on the surface of an opaque medium at an angle . The index of refraction of the medium is , and that of the surroundings is . The ratio of the indices of refraction,
| (6) |
is larger than unity if a dry substance is placed in air (). If the substance is placed in a liquid, one may have . If the refracted beam inside the medium will have an angle different from .
Due to multiple scattering the incoming beam decays exponentially,
| (7) |
where the cosine is a geometrical factor expressing the total path length in terms of . This exponential decay is known as Lambert-Beer law. It describes the decay of the direct sunlight in clouds or of headlights of cars in fog. The light source becomes invisible when the thickness of the diffuse medium is greater than one mean free path. The decay of direct light intensity occurs because it is transformed into diffuse light.
The scattering of the incoming beam into diffuse light occurs in a skin layer with characteristic thickness of one mean free path. Later on this will be discussed in greater length when we solve the Schwarzschild-Milne equation. In the diffusion approach one simply assumes that the incoming beam is partly reflected and partly converted into a diffuse beam in the skin layer. Next one assumes that effectively diffuse intensity enters the system in a trapping plane located at distance outside the scattering medium. The value of is phenomenological, but a precise analysis of the Schwarzschild-Milne equation reveals that this picture is valid. One usually takes , the exact value for isotropic point scattering of scalar waves. ?) investigated many possible cross sections and numerically always found values very close to this. ?) considered the limit of very strong forward scattering and found that lies only above the quoted value for isotropic scattering.
Once the light has entered the bulk, the diffuse intensity obeys the diffusion equation
| (8) |
In the steady state the time-derivative vanishes and the diffusion coefficient plays no role. For a slab geometry with plane waves there is no dependence, and we have to solve . The trapping plane boundary conditions are , . The solution is a linear function of ,
| (9) |
The transmitted intensity is essentially equal to this expression at (at a distance from the trapping plane at ) and equal to times the derivative at that point; this estimate will turn out to be qualitatively correct
| (10) | |||||
| (11) |
Without having paid attention to details we find the behavior , equivalent to Ohm’s law for conductors. Generally a conductor has conductance per channel. Here there are channels, of which a fraction is open. This yields the conductance
| (12) |
B Diffusion propagator for slabs
In the presence of absorption the diffusion equation reads
| (13) |
where is a source term, the second term on the right-hand side describes absorption, and the absorption length is . In a bulk system the solution with initial conditions and reads
| (14) |
Its Fourier-Laplace transform
| (15) |
takes the form
| (16) |
For these expressions diverge in the limit . This divergency is called the “diffusion pole” or “diffuson”.
For a slab geometry there will only be translational invariance in the plane. Suppose we have a source . Denoting the perpendicular wave vector by we have for diffusion from to
| (17) |
with the “mass” defined by
| (18) |
is the inverse depth at which a given intensity contribution of an incoming beam has decayed by a factor , due to spatial de-phasing of the amplitudes (encoded in ), temporal de-phasing (expressed by ) or absorption (expressed by .)
By realizing that the diffusion equation Eq. (17) is just a wave equation with complex frequency, one sees that the solutions to the diffusion equation are a linear combination of hyperbolic sines and cosines. (The solution can also be obtained using the method of “image charges” known from electrostatics.) The diffuse intensity propagator has the form [zhu, lisyansky]
| (19) |
where
| (20) |
In the stationary limit in the absence of absorption (, ), Eq. (22) reduces to a tent-shaped function,
| (21) |
The propagator describes the diffuse propagation from one point in the slab to another. With roughly equal indices of refraction inside and outside the sample, the extrapolation length is a few mean free paths and thus the terms involving yield contributions of order . For optically thick samples (), this is negligible and one has
| (22) |
.
The diffusion equation does not hold if the intensity gradient is steep, i.e., if . It can therefore not describe properly the diffuse intensity near the surface of the medium. Nevertheless, in a heuristic manner one often makes the following assumptions in the diffusion approach [ishimaru]: (1)The diffuse intensity from an outside plane-wave source is assumed to be given by substituting in Eq. (19), as if all diffuse intensity originated from this plane. Likewise, the coupling outwards is obtained by taking . In this way two extra propagators, the incoming (, ) and the outgoing (, ) are constructed from the internal diffuson (). (2) The boundary conditions are [zhu]
| (23) |
The form Eq. (19) fulfills these conditions. The extrapolation length is determined by the reflectance at the surface. In the following we calculate it precisely.
III Mesoscopics: the radiative transfer equation
The study of multiple light scattering was initiated in astrophysics with the goal to derive, on the basis of energy conservation, the radiative transfer equation. This is the “Boltzmann” transport equation of the problem (i.e., the mesoscopic balance equation that neglects all memory effects). It has been solved in particular for slabs (plane-parallel geometries). This approach has been described in the books by ?) and ?). It will be shown below that the radiative transfer equation can also be derived from the ladder approximation to the Bethe-Salpeter equation. In other words: there exists a microscopic derivation of the radiative transfer equation. Once this is shown, more details can be incorporated in the microscopics and more subtle effects, such as backscatter and correlations, can be derived microscopically in a way closely related to the radiative transfer equation.
A Specific intensity
The specific intensity is defined as the radiation density emitted at position in direction in a system with density of scatterers. Let be the radiation energy in a given frequency interval , transported through a surface in directions lying within a solid angle centered around , during a time interval . This energy is related to the specific intensity as [chandrasekhar]
| (24) |
where is the angle between the director of the emitted radiation and the normal of . The energy depends in general on the position , the direction , the frequency , and the time .
We are mainly interested in stationary, monochromatic situations for a slab with axial symmetry. Then depends only on and , where is the angle between the axis and the direction of emitted radiation. We consider propagation in a medium with density of rotationally symmetric scatterers with extinction cross section and phase function . Thus is the fraction of radiation entering inside a narrow cone of width around incoming direction and leaving inside a narrow cone around . For spherically symmetric scatterers is a function of .
If radiation propagates over a distance , there is a loss of intensity due to scattering into other directions and due to absorption (both are incorporated in ),
| (25) |
There is also a gain term with the source function ,
| (26) |
describes the radiation arriving at in direction and scattered there in direction . The radiative transfer equation expresses the net effect of the gain-loss mechanism
| (27) |
Here it is derived from phenomenological considerations, later we will provide a microscopic derivation.
The loss term leads to the Lambert-Beer law. Indeed, for a unidirectional beam , simple integration yield scattered. Which is again the Lambert-Beer law with scattering mean free path
| (28) |
B Slab geometry
For homogeneous illumination of a slab , physical quantities depend only on the depth . It is useful to introduce the “optical depth”
| (29) |
The optical thickness of the slab is then
| (30) |
Let be the angle between the direction of radiation and the positive axis, and its angle with respect to the positive axis. This allows us to introduce the dimensionless form of the radiative transfer equation,
| (31) |
where
| (32) |
For a plane wave with intensity incident under an angle on the interface , the boundary condition is , where .
1 Isotropic scattering
The radiative transfer equation (31) can be written as an integral equation. For a slab this is usually called the Schwarzschild-Milne equation or, for short, the Milne equation. Let us consider a semi-infinite medium. For Eq. (31) yields for the radiation in the direction (backward direction)
| (33) |
while for the specific intensity in the direction satisfies
| (34) |
Of special interest is the case of isotropic scattering or -wave scattering for which
| (35) |
Isotropic scattering occurs for electron scattering from small impurities. For isotropic scattering does not depend on and . It is common to introduce the dimensionless intensity
| (36) |
which here equals . Combining the last two equations yields for a plane wave incident in direction
| (37) |
This Boltzmann equation will also be found from the ladder approximation to the Bethe-Salpeter equation, which provides a microscopic foundation. Corrections to the ladder approximation then yield the limit of validity of the Boltzmann approach.
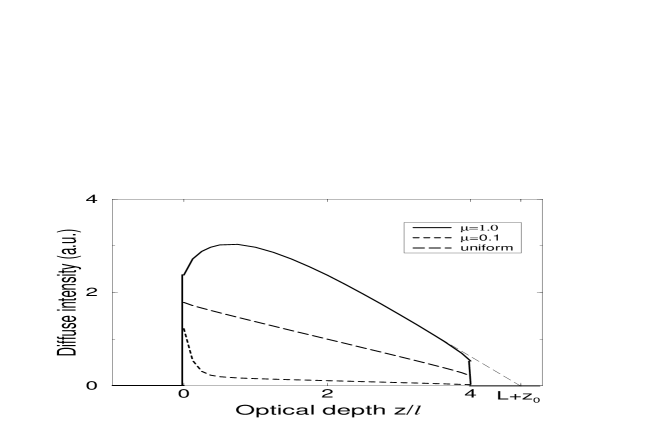
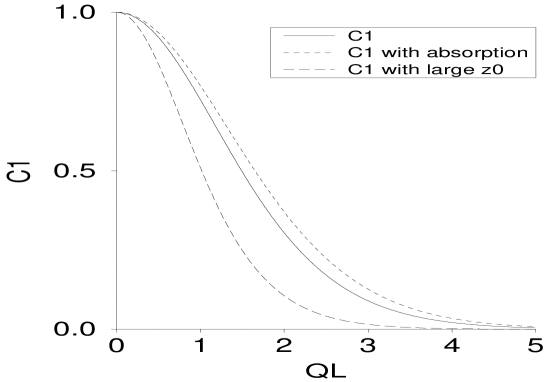
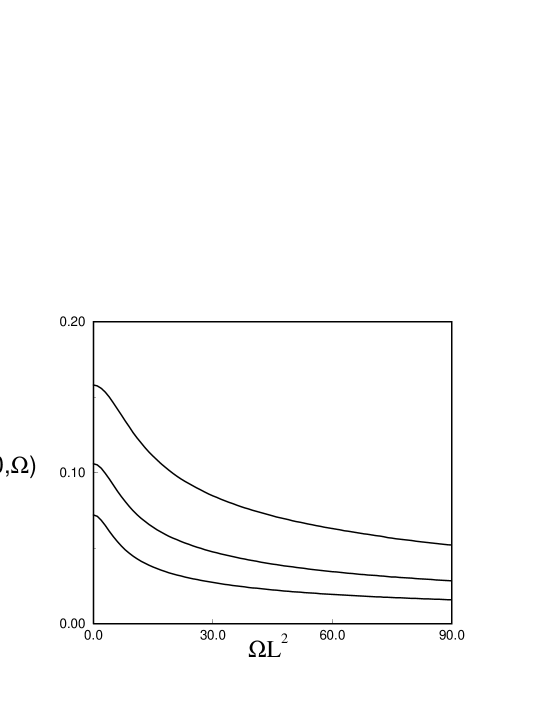
The precise solution of Eq. (37) can be obtained numerically. See ?) and ?) for details. We have plotted it in Fig. 2 for a relatively thin slab (), using the data from Table 17 in ?). The albedo is unity, and no index mismatch. The form of the solution near the incoming surface is quite different for the three cases drawn: , or perpendicular incidence; (angle with the axis is 84 degrees); and diffuse incidence uniformly distributed over all angles. At the outgoing surface all solutions are alike: there is only a small deviation from the straight line crossing zero at .
2 Anisotropic scattering and Rayleigh scattering
For acoustic or electromagnetic waves scattered from particles much smaller than the wavelength there is no -wave scattering. Instead one has to leading order the dipole-dipole or -wave scattering. It is expressed by the phase function for Rayleigh scattering,
| (38) |
Scattering from spherically symmetric particles is usually anisotropic, but cylindrically symmetric with respect to the incoming direction. For arbitrarily shaped scatterers this symmetry holds only after averaging over their possible orientations. In such situations the phase function depends only on , and the average over can be carried out. This leads to the projected phase function, with ,
| (39) |
For Rayleigh scattering one has, using the equality ,
| (40) |
Because of the form of the integral, it is useful to introduce
| (41) |
The radiative transfer equation yields the coupled integral equations
| (42) | |||||
| (43) |
Here we introduced the exponential integrals ,
| (44) |
and the product
| (45) |
Eqs. (43) involves two coupled functions and represent the simplest extension of isotropic scattering. They have been analyzed by ?).
3 The transport mean free path and the absorption length
We have discussed how unscattered intensity decays exponentially as a function of the distance from the source. This occurs because more and more light is scattered out of the direction of the beam. The characteristic distance between two scattering events is the scattering mean free path . Now suppose that scattering is rather ineffective, so that at each scattering the direction of radiation is not changed much. The diffusion constant must then be large. In other words, the factor in the identity cannot be the scattering mean free path. Intuitively one expects that is the distance over which also the direction of radiation gets lost. This length scale is called the transport mean free path. We show now how it follows from the radiative transfer equation.
The time dependent radiative transfer equation has the form
| (46) |
where is the mean time between two scatterings. We can now introduce the local radiation density and the local current density as
| (47) |
Integration of Eq. (46) yields the continuity equation
| (48) |
Here we introduce the albedo (from the Latin albus, white), the whiteness of the scatterer,
| (49) |
For there is no absorption. If we multiply Eq. (46) by and integrate over we obtain
| (50) |
If scattering is (on the average) spherically symmetric, the integral can only be proportional to . If one takes the inner product with , one finds the average cosine of the scattering angle,
| (51) |
Therefore Eq. (50) can be written as
| (52) |
The right-hand side depends on and . If one assumes that the intensity distribution is almost isotropic, then the current is much smaller than the density. This allows one to make the approximation [ishimaru]
| (53) |
since higher order terms are smaller. Under these approximations it follows that
| (54) |
For processes that change slowly in time we thus find
| (55) |
When inserted in the continuity equation, Eq. (55) leads to the wanted diffusion equation for the density. Thus under the above assumptions the radiative transfer equation leads to the diffusion equation,
| (56) | |||||
| (57) |
The diffusion constant is given by
| (58) |
where is the transport speed. We wish to stress that in principle has two contributions: the time to travel from one scatterer to the next and the dwell time spent in the neighborhood of one scatterer[albada2]. In Eq. (58) the transport mean free path occurs
| (59) |
It is the mean distance after which the direction of radiation gets lost. For strongly forward scattering will be close to unity so that the transport mean free path becomes large. In this excercise we also found an explicit expression for the absorption length and the inverse absorption length
| (60) |
C Injection depth and the improved diffusion approximation
In the previous section we avoided the problem of how an incoming plane wave becomes diffusive inside the medium. We introduced a “trapping plane” at the injection depth . The precise statement is that the solution of the transfer equation, or Milne equation, of a semi-infinite medium starting at behaves as for ; formally this expression vanishes at outside the medium. This can also be expressed as
| (61) |
If there is an index mismatch between the system and its surroundings, the walls of the system will partially reflect the light. Therefore the light will remain longer in the system. The transmission coefficient will become smaller by a factor of order unity. This effect is of practical importance, as the scattering medium usually has a different index of refraction from its surroundings, usually air or liquid. Only in the special case of index matched liquids the mismatch is minimized.
The first to point out the importance of internal reflections were ?). They also noted that changes. For a one-dimensional medium they give the expression
| (62) |
in which is the mean reflection coefficient.
For the three-dimensional situation, an analogous result was worked out by ?): For a system in which only the dependence is relevant, Eq. (53), relating the specific intensity to the radiation density and the current density , reads
| (63) |
with velocity , where is the scattering time. It follows that
| (64) |
From this one reads off that the radiation current per unit of solid angle equals
| (65) |
The total radiation at depth in the positive direction is thus
| (66) | |||||
| (67) | |||||
| (68) |
where the diffusive current (55) has been inserted.
In the absence of internal reflections must vanish for all . If we impose that vanishes and if we compare with Eq. (61), we obtain
| (69) |
For isotropic scattering this expression is not far from the exact value that follows from the radiative transfer equation, see Sec. X.
Let us now assume that the refractive index of the scattering medium differs from that of its surroundings . The ratio
| (70) |
exceeds unity for a dry medium in air, but can be smaller than unity if the medium is in between glass plates with a high refractive index. In both cases internal reflections will appear at the interface. The reflection coefficient is given by
| (71) |
equals unity in the case of total reflection, namely, when the argument of the square root becomes negative. We can now calculate the current that is internally reflected at the interface :
| (72) | |||||
| (73) |
where
| (74) |
By equating this angular average to the angular average (66), Zhu, Pine and Weitz derive Eq. (61) with
| (75) |
It was later pointed out by ?) that this result becomes exact in the limit of large index mismatch ( or ). The reason is that then the interfaces are good mirrors, so that the outer world is not seen and hence also close to the mirrors the intensity is diffusive.
In the derivation of Eq. (75) the phase function has only been used in the expression for the diffusion coefficient. This led to the occurrence of the transport mean free path. One would therefore expect that Eq. (75) remains valid for arbitrary anisotropic scattering in the limit of large index mismatch. This can be explained as follows: The interfaces act as good mirrors. Therefore many scatterings also occur close to the wall before the radiation can exit the medium. After many scatterings the radiation has become isotropic anyhow. Evidence for this point will be given in Sec. X D.
IV Microscopics: wave equations, matrix, and cross sections
A Schrödinger and scalar wave equations
Light scattering is described by the Maxwell equations. The vector character of the amplitudes leads to a tensor character of the intensity. In regard to sound waves or Schrödinger waves, this introduces extra complications, that we do not address here. For discussions of the vector case see, e.g., ?), ?), ?), and ?). The vector character is especially important in case of multiple scattering of light in a Faraday active medium in the presence of a magnetic field. For fundamental descriptions, see ?) and ?). This field also includes the so-called photonic Hall effect, a light current that arises, under these conditions, perpendicular to the magnetic field. From studies of the diffuse intensity ?) imagined such a mechanism to exist. This was indeed shown by ?), and confirmed experimentally by ?). Another interesting application is multiple scattering of radiation emitted by a relativistic charged particle in a random environment, see ?) for diffusion, and ?) for enhanced backscatter.
Acoustic waves and spinless electrons are described by scalar waves and this turns out to be a good approximation for light as well. The Schrödinger equation reads in units in which
| (76) |
As potential we choose a set of point scatterers.
| (77) |
Here is the bare scattering strength and are the locations of the scatterers.
Acoustic waves are described by the classical wave equation
| (78) |
where is the normalized local mass density and is the speed of sound in a medium with . We shall apply the same equation to light, thereby neglecting its vector character. is then the dielectric constant, and is the speed of light in vacuum where . For monochromatic waves the time derivatives are replaced by frequency . In practice this applies to a stationary experiment with a monochromatic beam. For classical waves we can also introduce point scatterers by setting , where is the polarizability of the scattering region that we approximate by a point. The Schrödinger equation and the scalar wave equation then both take the form
| (79) | |||||
| (82) |
Many static results can be derived without specifying which kind of waves are discussed. However, the dynamics of acoustic waves will be different from those of Schrödinger waves due to the frequency dependence of .
B The matrix and resonant point scatterers
To elucidate the notion of the matrix, we start the microscopic description with a simple example: scattering of an incoming beam from one scatterer in one dimension. The quantum-mechanical wave equation in with a scatterer in reads
| (83) |
Assuming that a wave comes in from , we look for a solution of the form
| (86) |
The constants and are determined by the continuity of and the cusp in at . The solution can then be represented as
| (87) | |||||
| (88) |
The first term is just the incoming wave. The second term represents the wave at the scatterer in , where it picks up a scattering factor ,
| (89) |
and is transported to by the medium without scatterers. The Green’s function in the medium without scatterers, defined as , reads
| (90) |
Note that we have chosen the sign of such that the Fourier representation of the pure Green’s function reads .
C The matrix as a series of returns
In the above example Eqs. (89) and (90) show that the matrix can be expressed as
| (91) |
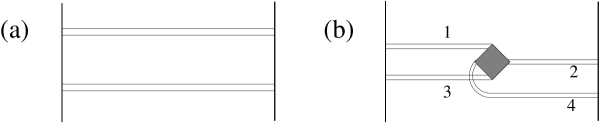
Expansion in powers of yields the “Born series”, a series that have a clear physical interpretation: the term of order describes waves that arrive at the scatterer, return to it times, and then leave it for good:
| (92) | |||||
| (93) |
The curved lines in the figure indicate that scattering occurs from the same scatterer (so far there is only one). The matrix is indicated by a circle in the figure. For an extended scatterer this expression reads
| (95) | |||||
Except for the case of point scatterers, this iterative solution of the single scatterer problem is not very helpful. The problem of vector wave scattering from a sphere was solved by ?), but the result is quite involved, too involved for our multiple scattering purposes. The approach shows, however, that the matrix depends on the Green’s function , which describes propagation in the medium without that scatterer. However, the Green’s function will depend on further details of the scattering medium, such as the presence of walls or other scatterers. Generally, it cannot be taken from the literature but has to be calculated for the problem under consideration: the matrix describes scattering in a local environment. The standard infinite-space matrix found in the literature only applies to that specific situation.
D Point scatterer in three dimensions
In three dimensions the Green’s function reads
| (96) |
which is closely related to the Yukawa potential for hadron-hadron interactions. The divergence at will cause some problems in taking the point limit.
1 Second-order Born approximation
For weak scatterers one often truncates the Born series. A complication is that the Green’s function in three dimensions diverges for , which makes the Born series (92) ill defined for point scatterers. In reality these divergences are cut off by the physical size of the scatterer, so they play no role for weak scattering. One thus keeps the first-order term and the imaginary part of the second-order term; the regularized real part of the second-order Born term will be small compared to the first-order term. This leads to the second-order Born approximation
| (97) |
For the system under consideration this becomes
| (98) |
The fact that signifies that matrix still describes scattering [see Eq. (123)]. More detailed aspects of the scatterer, such as resonances, are not taken into account. For electrons the second order Born approximation is often applied. Instead of working with point scatterers one usually considers a Gaussian random potential with average zero and correlation . This leads exactly to . For light, however, the second-order Born approximation is less applicable if resonances occur.
2 Regularization of the return Green’s function
For finite-size scatterers the divergence of the Green’s function at coinciding points is not a severe problem. The physical scatterer always has some finite radius, , that cuts off any divergency. When we wish to consider point scatterers, the divergence does cause a mathematical problem. In contrast to high energy physics, cutoffs in condensed matter physics represent physical parameters. Indeed, we shall identify as an internal parameter of the point scatterer, that fixes the resonance frequency.
The return Green’s function resulting from (96) diverges. It should be regularized as
| (99) |
Another method, often used in quantum field theory, is to introduce a large momentum cutoff,
| (100) | |||||
| (101) | |||||
| (102) |
This subtraction is also possible if there are other scatterers or walls. Different regularization schemes define different point scatterers. The physical result is largely insensitive to such details.
3 Resonances
If we insert the regularized return Green’s function in Eq. (91), we can write the matrix in the same form as in the d=1 case, by introducing the effective scattering length ,
| (103) | |||||
| (104) | |||||
| (105) |
where
| (106) |
For Schrödinger waves, the regularization brings just a shift in as compared to the second-order Born approximation. This has no further consequences, since and are constants, and so is . For scalar waves there is an important difference, since then is frequency dependent [c.f. Eq. (79)] : . Let us call the wave number at resonance. If we identify***That can be done provided , that is to say, when . , we get
| (107) | |||||
| (108) |
One sees that for . Then becomes equal to . As this shows resonance with strong scattering: the effective scattering length is much larger than the physical size of the scatterer .
The resonance is an internal resonance of the scatterer, comparable with the s-resonance of a Mie sphere. It is strongly influenced by the environment in which the sphere is embedded. For small frequencies , leading to the Rayleigh law for .
4 Comparison with Mie scattering for scalar waves
We compare the above result of regularization with an exact result. The matrix for scalar s-wave scattering reads (see, e.g. ?), page 238).
| (109) |
where is the radius of the sphere and the ratio between refractive indices of the sphere and the outside. The first resonance occurs at wave number . It becomes sharp if one takes small , large , such that remains fixed. For close to one gets
| (110) |
For our point scatterer (105) we have
| (111) |
where the scattering length is
| (112) |
In the limit of small this becomes . Comparing Eq. (110) with Eq. (111) we find the prefactors and . The difference is a factor , thus the results coincide within 2%. In Eq. (99) we called a measure of the radius of the scatterer. We find, if ,
| (113) |
Indeed is a good measure of the radius. We have thus found a simple expression for the matrix which incorporates the essential physics near the s-wave resonance. Finally, we mention that Mie scatterers absorb radiation if the refractive index has a small imaginary part. For point scatterers absorption is described by giving a small negative imaginary part.
E Cross sections and the albedo
In the literature several cross sections are encountered. Here we discuss the three most important. Let a plane wave be incident in direction . As mentioned above, the total wave scattered from one scatterer is
| (114) |
with a real-space representation of the matrix [see Eq. (95]. Its Fourier transform is called the off-shell matrix,
| (115) |
Let us assume that the center of the scatterer is located at the origin. Far away it holds that
| (116) |
We insert this in Eq. (114) and with (115) we find that the scattered wave has the form
| (117) |
The scattering cross section is defined as the scattered intensity integrated over a sphere, normalized by the incoming intensity
| (118) |
Notice that the matrix is only needed for momenta (“far field”, “on the mass shell”, “on shell matrix’‘). One often denotes it by . An isotropic point scatterer thus has scattering cross section
| (119) |
The second important quantity is the extinction cross section. It tells how much intensity is lost from the incoming beam. Let us assume that a plane wave is incident along the axis from . We consider the intensity in a small solid angle around the axis for large positive . Because then , the total wave is given by
| (120) |
The intensity for large is
| (121) |
We integrate this over and inside an area perpendicular to the -as. The condition that and be much smaller than makes the integrals Gaussian, after which the dependence disappears:
| (122) |
The extinction cross section is the surface over which the incoming beam has to be integrated to collect an equal amount of intensity. It is equal to
| (123) |
For a point scatterer one has . The albedo of the scatterer is the ratio of scattered and extinct intensity,
| (124) |
For pure scattering ; this is called the optical theorem. If absorption is present the absorption cross section can be defined as The albedo then equals
| (125) |
For an extended spherical scatterer the extinction cross section is angle dependent. One defines the earlier encountered phase function in terms of the matrix as
| (126) |
with
| (127) |
Note that, because of the far-field construction, the optical theorem cannot be applied immediately in a system with many scatterers. Instead one has to impose the Ward identity, which is its generalization.
V Green’s functions in disordered systems
After our microscopic treatment of a single scatterer, we now consider scattering from many scatterers. The Green’s function of a given sample depends on the realization of disorder: the location and the orientation of scatterers. Averaged over disorder it is called the amplitude Green’s function. It describes, on the average, unscattered propagation, such as an incoming beam or the wave scattered from any given scatterer. It should be contrasted with the diffuse intensity, which is the (multiple) scattered intensity that will be discussed below. For a introduction to Green’s functions in disordered systems see ?).
A Diagrammatic expansion of the self-energy
The amplitude Green’s function is related to two important concepts: the density of states and the self-energy. Let us consider waves with frequency . It will be seen that the presence of many scatterers will change the “bare” wavenumber into the “effective wavenumber”
| (128) |
This describes a phase velocity .
For an electron in a random potential the definition of the amplitude Green’s function is
| (129) |
with
| (130) |
The effect of the random potential is to introduce in the bare Green’s function the self-energy ,
| (131) |
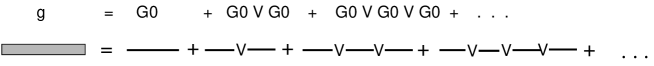
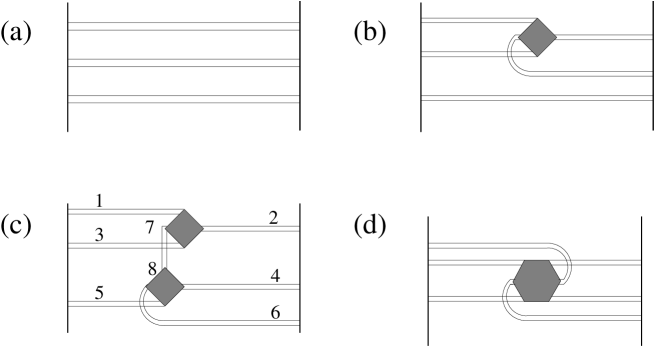
Exact averaging over the disorder is only possible in particular cases in one dimension and cannot be done in general. †††Exactly solvable models exist in one dimension. B.I. Halperin considers Gaussian white noise potential on a line [halp]; Th.M. Nieuwenhuizen considers exponential distributions on a 1D lattice [thmn6, thmn7]. Therefore, we employ a diagrammatic approximation to calculate the self-energy. Suppose that we have a system with randomly located strong scatterers (water drops in fog, lipid particles in milk, TiO2 particles in a liquid or solid sample). In the limit of point scatterers the potential becomes . The Green’s function of this problem is represented diagrammatically in Fig. 3.
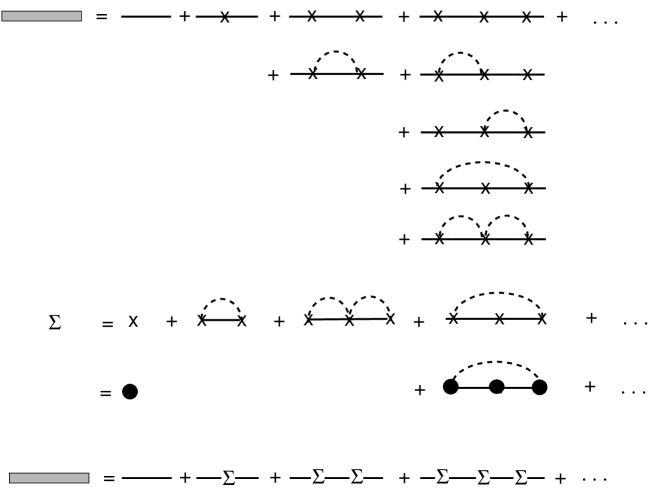
denotes a bare propagator, that is to say, the propagator in the medium without scatterers. The quantity needed is , the Green’s function of the random medium, also called dressed propagator. To calculate all diagrams would amount to solving the problem exactly, which is usually not possible. We shall therefore assume that the density of scatterers is small. This will allow us to set up a perturbative expansion of . We average over all disorder configurations, that is to say, all positions (and orientations) of the scatterers in the volume . We sort the diagrams (see Fig. 4) and get
| (132) | |||||
| (133) | |||||
| (134) |
The relation (133) is the Dyson equation. The lowest order approximation to was already calculated in Sec. IV, as it is proportional to the matrix. Due to the averaging over the scatterer positions, there is a also a density dependence, which can already be calculated from the first order Born term,
| (135) |
The same argument holds for all orders in the Born series, so one obtains to
| (136) |
This lowest order approximation is also known as the independent- scatterer approximation. In Fig. 4 it corresponds to the approximation . The effective wave number is extracted by comparing the dressed and bare propagators
| (137) |
which leads to the complex index of refraction
| (138) |
B Self-consistency
It is impossible to calculate all diagrams. Often it is feasible, however, to take into account, without much extra effort, all higher order contributions of a certain type. In the case of the self-energy we can take , instead of . This is called a self-consistent approach. Now the last diagram in the series for of Fig. 4 is included. Similar terms with any number of intermediate dots are also accounted for. (One has to be careful to avoid overcounting of diagrams, however). Nevertheless, some two-scatterer diagrams have still been neglected at this self-consistent one-scatterer level.
Physically the self-consistent method is very natural: it describes that propagation from one scatterer to another does not happen in empty space, but in a space filled with other scatterers. Therefore self-consistency is a fundamental concept, and it will serve to satisfy conservation laws (Ward identities). Indeed, without self-consistency there is no exact cancellation in the Ward identities. For instance, in the second-order Born approximation one will derive Eq. (147) with , formally describing absorption or even creation of intensity, in situations where intensity should be strictly conserved. In order to work with such approaches one must neglect terms. In the more physical self-consistent approach such ad hoc manipulations are not needed and not allowed.
The self-consistent matrix in the independent scatterer approximation,
| (139) |
can lead to a real value of . This amounts in this approximation to a gap in the density of states [polishchuk]. Probably there is no real gap, but still a small density of states, which may lead to Anderson localization [polishchuk].
VI Transport in infinite media: isotropic scattering
Just as the amplitude Green’s function follows from solving the Dyson equation, the intensity follows from solving the Bethe-Salpeter equation. In this section we restrict ourselves to an approximate form of this equation: the so-called ladder approximation. It will be seen that this is corresponds to the independent scatterer approximation at the intensity level. The ladder approximation allows a microscopic derivation of the radiative transfer equation discussed in Sec. III.
In infinite media there are no boundaries which simplifies the analysis. In practice this situation applies to cases where the distance to boundaries is many mean free paths, so in the bulk of the multiple scattering medium. We first consider this situation and derive the diffusion equation from microscopics. In doing so, we find expressions for the diffusion coefficient and the speed of transport.
A Ladder approximation to the Bethe-Salpeter equation
For the transport of energy we must consider the intensity. We have to multiply the Green’s function by its complex conjugate. In other words, we must multiply the retarded Green’s function by the advanced one. This must be done before averaging over disorder. We indicate this in Fig. 5 by drawing the expansion for (first line) and drawing the one for below it.
When scattering from a certain scatterer occurs more than once, we indicate this again by dashed lines. Visits to scatterers are included in or , as before, but it may also happen that both and scatter from a common scatterer. This leads to the connection lines between the upper and lower propagators in the figure.
Of special importance are the ladder diagrams, depicted in Fig. 5(a), which describe the diffuse intensity in the independent scatterer approximation. They lead to the classical picture of propagation of intensity from one common scatterer to another. As the intermediate propagation takes place in a medium with many other scatterers, each intermediate or line visits many new scatterers: they are the dressed propagators of the previous section.
Alternative names for the ladder diagrams are: ladder sum, diffuson, particle-hole channel. They are constructed in three steps: (i) Sum all immediate returns to the scatterers. As was explained in Sec. IV, this replaces the bare scattering potential by the matrix. (ii) Keep only those diagrams in which and visit a certain series of common scatterers once and only once and in the same sequence. The intensity propagates from one scatterer to another. (iii) Use the dressed Green’s function as intermediate propagator. As a result in between the common scatterers both and visit any amount of other scatterers.
Let denote the intensity arriving at point . According to Fig. 5 it can be decomposed into terms without scattering, terms with one common scattering, term with two, etc:
| (140) | |||||
| (141) |
which can be written as an integral equation
| (142) |
where . The ladder propagator is the intensity that leaves point after being scattered.
In the second-order Born approximation the same scatterer is at most visited twice consecutively, with the result that the matrices in the above ladder equations are replaced by the scattering potentials .
B Diffusion from the stationary ladder equation
In the bulk, that is to say far from boundaries, the source term in the ladder equation vanishes. Eq. (142) therefore takes the form
| (143) |
Now assume that varies slowly on the scale of one mean free path and expand
| (144) |
where denotes a tensor contraction. Inserting this in Eq. (143) yields three contributions. The first term is
| (145) |
In the prefactor we have recognized the albedo (see Sec. IV). The second term vanishes due to symmetry. The third term yields
| (146) |
Inserting this in Eq. (143) yields the stationary diffusion equation
| (147) |
in agreement with eqs. (54) and (60), since for isotropic scattering it holds that .
C Diffusion coefficient and the speed of transport
Here we give a simple derivation of the nonstationary diffusion equation. In doing so, we automatically encounter the speed of transport. We again consider isotropic scatterers. In an infinite system it is useful to consider the Fourier-Laplace transformed ladder equation
| (148) | |||||
| (149) | |||||
| (150) |
where is the transformed source term; its precise form is of no interest here. We introduced
| (151) |
The parameters and are “internal” or “fast” variables, which involve one period of the wave. and are macroscopic or slowly varying parameters. They describe variations over distances much larger than the wavelength and times much larger than the oscillation period.
At , the bulk kernel has the property
| (152) |
We want to know the behavior for large distances and times, so for small and . We expand to orders and . Denoting , it holds that
| (153) | |||||
| (154) |
Inserting this in Eq. (150) implies for the kernel
| (157) | |||||
Here we have defined the integrals
| (158) |
They are calculated in the appendix. Inserting their values yields
| (159) |
As discussed by ?), has two contributions,
| (160) |
The first term is the “scattering time” or “time of travel” . The explicit expression for the “dwell time” follows as
| (161) |
We insert the -matrix of a point scatterer, Eq. (105), yielding
| (162) | |||||
| (163) |
Notice that the terms without have compensated each other. This cancellation follows more generally from a Ward identity [albada2]. For electrons in a random potential therefore vanishes.
For acoustic waves and light waves the situation is more interesting. Since depends explicitly on frequency, does not vanish. Both terms are additive, leading to a finite dwell time . Using Eq. (108) this yields at resonance
| (164) |
This dwell time becomes longer when the coupling to the environment, that is, the normalized scattering strength , becomes weaker. Therefore this is an important experimental effect. The speed of transport,
| (165) |
can be substantially smaller than the speed of light when realistic values of are inserted in this formula.
For resonant atoms at fixed positions, the reduction of speed may be as large as [VdovinGalitskii, thmn11]. As a final result the diffusion coefficient reduces, as is observed experimentally. For the general situation and for more details, see ?) and ?).
With this result for we find for the ladder propagator (150) at small
| (166) |
involving the reduced external frequency
| (167) |
This is exactly the propagator of Sec. II with absorption length .
One often considers the Schwarzschild-Milne equation with stationary source, . In the diffusion approximation this yields
| (168) |
This form is commonly called the “diffuson.”
VII Transport in a semi-infinite medium
In this section we consider in detail the transport equation for a very thick slab. We follow the approach of ?). We shall also consider the case of a mismatch in refractive index between the medium and the outside.
A Plane wave incident on a semi-infinite medium
In many situations the index of refraction of the scattering medium differs from that of its surroundings. An example is TiO2 particles suspended in a liquid. Boundaries between media of different indexes act partly as mirrors. They cause a direct reflection of the incoming light and re-inject part of the multiple scattered light that tries to exit the system. As long as the system is optically thick, they lead to effects of order unity, no matter how small the ratio , thus they are important in a quantitative analysis.
We shall calculate the angular resolved intensity profile for the case of a plane wave incident on a perfectly flat interface. This will create a specular reflection at the interface. The situation of nonspecular reflections from nonideal interfaces also has some practical relevance.
Consider a semi-infinite medium. For there is a scattering medium with refractive index . For there is a dielectric with index . Our notation is indicated in Fig. 1. The system is governed by Eq. (79). We first determine the incoming wave in the scattering medium. We consider a system with scatterers in the half-space . We replace the action of the scatterers by a self-energy term. The average wave equation reads, after Fourier transformation of the transverse vector to ,
| (169) | |||||
| (170) | |||||
| (171) |
A plane wave of unit amplitude, incident from , causes a reflected wave for and a refracted wave for :
| (172) | |||||
| (173) |
The prefactors in Eq. (172) follow from the requirement of continuity of and its derivative. To lowest order in the density we find for the real and imaginary parts of
| (174) |
where is the angle of the refracted incoming wave with respect to the axis.
The source term in the scattering medium, the unscattered incoming intensity, can be written as
| (175) |
Inside the random medium the unscattered intensity is damped exponentially (Lambert-Beer law). To leading order in ,
| (176) |
where is the angular reflection coefficient for scalar waves, and for total reflection, which occurs when . For vector waves the same equation applies in the -wave channel [amic2]. In this expression for the imaginary part of , of order , has been neglected. It has been shown by ?) that we must neglect this to ensure flux conservation.
We use the optical depth (not to be confused with the average time per scattering ) and introduce as
| (177) |
is the diffuse intensity per unit of intensity entering inside the medium. In terms of the ladder equation becomes dimensionless
| (178) |
where follows from the square of the amplitude Green’s function. In contrast to Eq. (37) now consists of two terms for : a direct term and a term involving reflection for the boundary :
| (179) |
We shall later need for , for which
| (180) |
Inside the random medium, thus has four terms. The cross terms oscillate quickly and can be omitted. We thus keep the previous bulk contribution to the kernel and the new layer kernel , . For the bulk kernel we find
| (181) |
It holds that
| (182) |
Since
| (183) |
one gets
| (184) | |||||
| (185) |
yielding for the bulk kernel [cf, Eq.(37)]
| (186) |
where is an exponential integral. In the same fashion the layer term is
| (187) | |||||
| (188) |
It consists of three effects: exponential decay of intensity that goes from the point with angle towards the wall having an optical path length ; a reflection factor ; a further decay over an optical path length between the wall and the observation point .
We now calculate the angular resolved reflection. For a plane wave incidence the solution of Eq. (142) is . We can write for the reflected intensity at point with
| (189) |
Here is related to via and Eq. (177).
It is useful to consider first a finite area and to continue this area periodically. We can then integrate out the dependence; later we shall take the limit . Using the periodicity of the surface one can express the Green’s function as
| (190) |
Since the incoming plane wave is infinitely broad, the diffuse intensity does not depend on . The integration over is simple:
| (191) |
The last step holds in the limit . If we denote the outgoing by , we can express as
| (192) |
Inserting Eqs. (192) and (191) in Eq. (189) yields a result that is independent of the observation point ,
| (193) |
where is the direction of the radiation in the medium, that is refracted into the outgoing direction [see Fig. 1]; we also recall that . We finally find for the angular resolved reflected diffuse intensity
| (194) |
Using Eqs. (177) and (171) at , one can express the numerical prefactor of the integral
| (195) | |||||
| (196) |
For the angular resolved diffuse reflection of a semi-infinite medium we thus find
| (197) |
with the generalized bistatic coefficient
| (198) |
In the absence of index mismatch () one has , , so the prefactor in Eq. (197) becomes . Fig. 6 shows numerical results for for perpendicular incidence , see [thmn5].
B Air-glass-medium interface
We now consider a semi-infinite scattering medium, separated from the air by another dielectric, such as glass, of thickness . For there is air, for glass, and for the scattering medium. A plane wave of unit amplitude comes in from with wave vector . The perpendicular component is conserved at the interfaces. We denote by the -component of the wave vectors in the three sectors , where corresponds to the scattering medium, to air, and to glass. The wave numbers in the three media are , ,and , respectively, where is the speed of propagation in the medium . The incoming, refracted, and specularly reflected waves are given by
| (202) |
Here is the reflection amplitude of the system, the transmission amplitude, and . Continuity requirements at and yield and :
| (203) | |||||
| (204) |
The reflection and transmission coefficients of the double interface are
| (205) |
respectively. As we assume the thickness of the glass plate is not smooth within one wavelength, these expressions must be averaged over the spread in thickness. This amounts to averaging over the phase and leads to the average transmission and reflection coefficients
| (206) |
The integrand is of the form . The final result is
| (207) |
We can check this in special cases. Inserting and indeed reduces to previous the result for two media.
We can describe this system by replacing in previous equations by and replacing the reflection coefficient in the Milne-kernel by . As before, is the cosine of the angle between the radiation and the axis.
Specular reflections in the glass have now been taken into account. For a not too narrow beam this is useful for thin glass plates. For a not so broad beam impinging on a medium with thick plates, multiple reflections from the glass interfaces can results in components that fall outside the incoming beam and even outside the medium [ospeck].
C Solutions of the Schwarzschild-Milne equation
We consider properties of the transport equation in a semi-infinite space [thmn5]. The Milne equation (178) has a special solution , while the associated homogeneous equation without source term has a solution . We are interested in the asymptotic behavior of and . Deep in the bulk one expects a slow variation of at the scale of one mean free path () and one can expand
| (208) |
When this is inserted in Eq. (178), one finds for
| (209) |
Here we used that for large
| (210) |
The term vanishes due to symmetry of the -integral. Eq. (209) thus yields again the diffusion behavior . We therefore consider the homogeneous solution and the special solution with the asymptotic behaviors
| (213) |
Corrections occur due to the interface and decay exponentially in . For a numerical solution one may introduce and and integrate them from . The requirement that they vanish there, determines and . The constant depends only on the index ratio , while also depends on the direction of the incoming beam.
We define the Green’s function as the solution of the inhomogeneous equation
| (214) |
subject to the boundary condition . This function is symmetric, , and has the limit
| (215) |
The latter equality can be proven by taking the limit in Eq. (214). The delta function vanishes and the remaining equation is the same as the one for . Therefore is proportional to . The multiplicative prefactor can be fixed by expanding in and inserting this in the right-hand side of Eq. (214). Using Eq. (210) again, one finds for
| (216) |
The solution is in the regime , , . The diffusion coefficient in Eq. (215) reads in reduced units, that is to say, in physical units.
From Eq. (214) it follows that
| (217) |
and, in particular, using eqs. (213) and (215),
| (218) |
The physical interpretation of is the limit intensity () of a semi-infinite medium.
Numerical values of the injection depth , the normalized limit intensity and the normalized bistatic coefficient can be found in Table I for various values of the index ratio .
In ?) it was verified explicitly that in this approach flux is conserved. This derivation will not be reproduced here. We refer the interested reader to the original paper.
VIII Transport through a slab
We now discuss the transmission properties of an optically thick slab with isotropic scatterers. We derive the “ohmic” or diffusive scaling behavior mentioned in Sec. II, and give the full angular dependence of the transmission and reflection. This result is then used to calculate the resistance of an idealized conductor.
A Diffuse transmission
We consider a medium with finite thickness . The medium has optical thickness . For the moment we wish to neglect boundary effects. Therefore we are restricted to positions not too close to the boundary (10 mean free paths is a good measure, as the corrections decay exponentially). The solution for is a linear combination of the special and the homogeneous solutions,
| (219) | |||||
| (220) |
Near the other boundary it holds similarly that
| (221) | |||||
| (222) |
As they have the same functional form, both shapes can be matched in the bulk of the sample. This yields
| (223) |
Inserting this value in Eqs. (219) and (221) gives the intensity anywhere in the slab, expressed in terms of and of the semi-infinite problem. Notice the important role played by the diffusive behavior in the bulk. The Schwarzschild-Milne equation has brought the precise behavior at scales of one mean free path from the boundaries.
To calculate the angular transmission profile, we follow the derivation for the diffuse reflection [see Eq. (197]. The expression for the differential transmission coefficient per unit solid angle of a beam incident under angle is given analogously as
| (224) |
Using the solution for we rewrite the integral
| (225) | |||||
| (226) | |||||
| (227) |
where we used Eq. (218). We have derived the angle-dependent differential transmission coefficient for a slab of optical thickness ,
| (228) |
As the intensity at the side of incidence (), equals , it is clear that the transmission term arises at the cost of the reflection. Therefore also flux conservation is also satisfied for an optically thick slab.
In Fig. 7 we show , the normalized angular resolved transmission for perpendicular incidence , for several values of the index ratio .
B Electrical conductance and contact resistance
For metallic conductors in the mesoscopic regime the conductance is given by the Landauer formula [landauer]
| (229) |
where is the quantum unit of resistance. This equation simply counts the weight of the channels that contribute to transmission. In the above description the wave number can be replaced by the Fermi wave number vector . The analog of the contrast in refractive index is now the potential difference between the conductor and the contact regions (. In our formalism the conductance is given by
| (230) |
with . Herewith one gets
| (231) |
where and is the “Boltzmann” value for the bulk conductivity. We distinguish a bulk resistance and a contact resistance ,
| (232) |
The number of modes can be estimated as . The above expression shows that is proportional to the dimensionless thickness and inversely proportional to the number of channels. The nontrivial part is coded in . It depends on the potential drop , but not on the density of scatterers. Because
| (233) |
we can make an analogy with light scattering by putting :
| (234) |
IX The enhanced backscatter cone
So far we have seen mainly effects that are largely diffusive and that could to some extent also be derived from particle diffusion. The enhanced backscatter cone is the clearest manifestation of interference due to the wave nature of the light. The wave character manifests itself most clearly in loop processes. The advanced and retarded waves can go around in two ways, in the same direction and in the opposite. This leads to an enhanced return to the origin, which is the basic mechanism for Anderson localization (Sec. I).
The optical enhanced backscatter in the exact backscatter direction has the same characteristics as a closed loop. It brings two possibilities, thus a factor of 2, for all scattering series involved. For Faraday active media it will be suppressed in a magnetic field. Away from the backscatter direction there is partial extinction.
A Milne kernel at nonzero transverse momentum
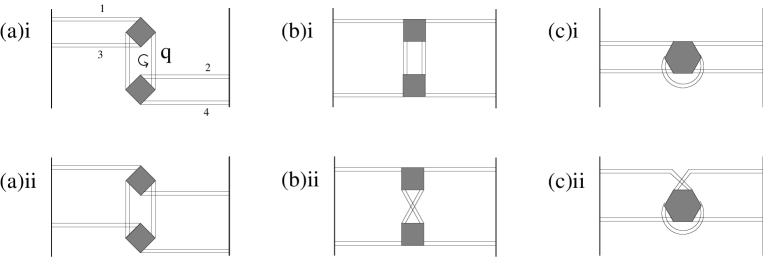
We follow the discussion of ?). The backscatter diagrams are closely related to the standard ladder diagrams. The only difference is the crossed attachment of the incoming and outgoing lines to the first and last scatterers. These diagrams are called maximally crossed diagrams (Fig. 9).
Let the incoming wave be denoted by and the outgoing wave by . Their wave vectors have components . The product of incoming and outgoing waves at the first scatterer is
| (235) |
with . We define the transverse wave vector
| (236) |
For perpendicular incidence one has (; ). We consider the regime of angles close to the backscatter direction (). Then it holds that so that
| (237) |
Consider the diffuse intensity in the backscatter cone. It is given by
| (238) |
Notice that -dependence occurs only in the source term of this integral equation. Inserting yields the Milne equation for ,
| (239) |
with the Q-dependent Milne cone kernel
| (240) |
The normalized intensity of the maximally crossed diagrams satisfies
| (241) | |||||
| (242) |
The Milne kernel again has a bulk and a layer term,
| (243) |
Inserting yields
| (244) |
In terms of the variables and , where is the angle between and the axis, we find that
Inserting this in Eq. (244) yields
| (245) | |||
| (246) |
where J0 is the zeroth-order Bessel function. A similar analysis yields for the layer term
| (247) |
This form is useful at small and large .
B Shape of the backscatter cone
The intensity in the backscatter direction consists of two parts: a diffuse background , discussed in Sec. VII and a contribution from the maximally crossed diagrams. In the case of perpendicular incidence we have found for the background contribution Eq. (197)
| (248) |
where the normalized bistatic coefficient is given by
| (249) | |||||
| (250) |
The contribution of the maximally crossed diagrams, normalized by the diffuse background, is given by
| (251) |
where is the amplitude of the paths that are identical to their time reversed analogs. Such paths do not yield a time-reversed contribution, and this should thus be subtracted from the first term. For low scatterer density, consists of the single scattering event (in, scatter, out). This process yields [cf. Eq. (198)]
| (252) |
The nontrivial term is defined as
| (253) |
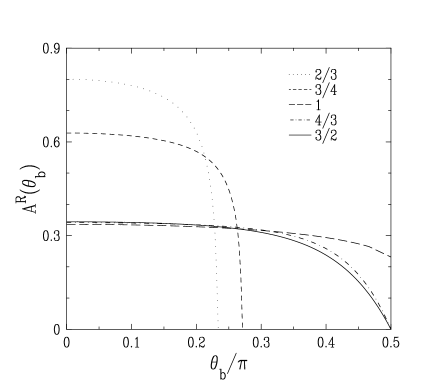
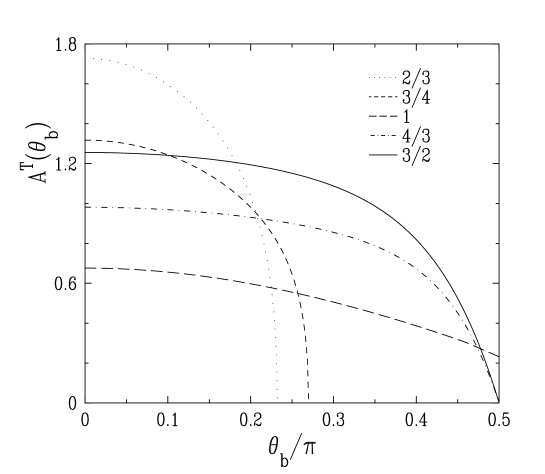
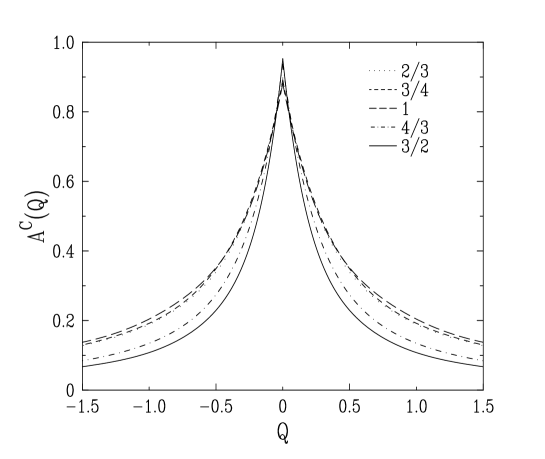
where is the solution of Eq.(241) with source instead of and vanishing for . In Fig. 10 we present the numerical results for for several values of the index ratio .
C Decay at large angles
From Eqs. (246) and (247) it follows that and decay quickly as functions of when is large. Physically this happens because the enhanced backscatter is suppressed at large angles due to dephasing. For large angles we can therefore restrict Eq. (253) to low order scattering. To second-order we have . This yields
| (254) |
For the bulk term
| (255) | |||||
| (256) | |||||
| (257) |
Inserting Eq. (247) yields for the layer term in Eq. (254)
| (258) | |||||
| (259) | |||||
| (260) |
The integrand decays quickly for large values of . Setting we obtain for the layer term
| (261) |
This yields finally
| (262) |
for large . The effect of the layer term is essentially the square of the bulk term. This is because the paths involved are essentially twice as long (Fig. 11)
D Behavior at small angles
Assuming a linear dependence, we expand around
| (263) |
Inserting this in Eq. (241) and subtracting the terms yields, to leading order in ,
| (264) |
As this is a homogeneous equation, it holds that ,so that Eq. (263) becomes
| (265) |
Deep inside the scattering medium () the diffusion approximation holds, implying
| (266) |
Matching this for small with Eq. (265) one finds . Using Eq. (249) this yields finally
| (267) | |||||
| (268) |
where we used Eq. (218) with . The normalized opening angle is
| (269) |
Note that . The linearity of the peak of the cone is a result of diffusion, that is to say, of long light paths. The complicated expression for the opening angle shows that the skin layer plays an important quantitative role. The reason hereto is obvious: the light has to traverse it.
X Exact solution of the Schwarzschild-Milne equation
Some useful formulae were given in previous sections for calculation of the diffuse intensity. However, the Schwarzschild-Milne equation can be solved exactly in the absence of internal reflections [chandrasekhar]. We summarize the approach of ?) here and generalize the Schwarzschild-Milne equation to include internal reflections.
A The homogeneous Milne equation
The starting point of this analysis is the integral form of the radiative transfer equation, i.e., the Schwarzschild-Milne equation, Eq. (178). In the absence of internal reflections, , the remaining kernel depends only on the difference , giving the Milne equation the structure of a convolution equation. Because of its half-space geometry the problem is still nontrivial.
We consider first the homogeneous Milne equation. Its solution has the asymptotic behavior [Eq. (213)]. We define the Laplace transforms of and of as
| (270) | |||||
| (271) |
In the case of isotropic scattering the Milne kernel Eq. (184) leads to
| (272) |
The small- behavior of
| (273) |
determines the dimensionless diffusion constant .
It turns out that the problem can be solved for any symmetric Milne kernel. The homogeneous Milne integral equation is equivalent to
| (274) |
with , and the asymptotic behavior Eq. (213) is equivalent to
| (275) |
Equation (274) can be solved in closed form, for an arbitrary bulk kernel. Let us consider first the following “rational case,” where is a finite superposition of decaying exponentials, namely,
| (276) |
with weights and decay rates (inverse decay lengths) . We then have
| (277) |
By comparing with Eq. (273), we obtain the normalization conditions , . Equation (274) can be evaluated by means of residue calculus. It loses its integral nature and becomes
| (278) |
In order to solve Eq. (278), we first write the rational function in factorized form,
| (279) |
The zeros of in the variable have been denoted by , with , for . The normalization of Eq. (279) has been fixed by using .
An alternative expression for the diffusion constant is derived by setting zero in Eq. (279) and comparing with Eqs. (273) and (277). We get
| (280) |
The solution of Eq. (278) is of the form
| (281) |
with a polynomial of degree , which can be determined as follows. Consider the value : we have , whereas is finite. Equation (281) shows therefore that is a zero of the polynomial . Since there are exactly such values, the solution Eq. (281) is determined up to a normalization, which can be fixed by using Eq. (275). We thus obtain
| (282) |
This equation can be recast for as
| (283) |
The sum over the poles and zeros of the function , with positive real parts, can be rewritten as the following complex integrals:
| (284) |
This result gives the solution of the problem for an arbitrary bulk Milne kernel.
The thickness of the skin layer can be evaluated by comparing the results Eqs. (282) and (284) with the expansion (275). We get
| (285) |
The value for the case of point scattering is obtained by inserting into Eq. (285) the expression for coming from Eq. (272). By making the change of variable , we get
| (286) |
We recover a well-known numerical value [chandrasekhar, vanderhulst2, vanderhulststark].
B The inhomogeneous Milne equation
The above method can be generalized to the inhomogeneous situation [thmn5]. For point scattering one obtains the result
| (287) |
This quantity is maximal at normal incidence , where it assumes the somewhat simpler form
| (288) |
C Enhanced backscatter cone
Exact results can also be derived for the backscatter cone in the absence of internal reflections. Consider, for the sake of simplicity, the enhanced backscatter of a normally incident beam . The dependent Milne equation (241) can be solved by means of the Laplace transformation.
In the case of point scattering, one gets for the backscatter amplitude [gorod]
| (290) |
For small values of the reduced wave vector , the result Eq. (290) assumes the general form Eq. (267), corresponding to the triangular shape of the backscatter cone. The value for reads
| (291) |
in agreement with Eq. (289). In agreement with Table I, one has [see Eq. (267)].
We end this section by mentioning the expression for the backscatter cone amplitude for isotropic scattering by point scatterers with an arbitrary albedo,
| (292) |
This result shows that, as soon as the scattering albedo is smaller than unity the backscatter amplitude is an analytic function of , i.e., the cusp at disappears. This confirms the physical intuition that the triangular shape of the cone is due to the existence of arbitrarily long diffusive paths. It is therefore a characteristic of the problem with unit albedo, i.e. with no absorption, in a half-space geometry. When the reduced wave vector and the strength of absorption are both small, we observe the following scaling behavior:
| (293) |
The denominator of this expression is not reproduced quantitatively by the diffusion approximation [see for example Eq. (71) of ?)], although it pertains to the long distance physics of the problem. We also notice that the prefactor of the square root is nothing but the reciprocal of the value (269) of . Indeed, Eq. (289) yields , by which Eq. (269) reduces to .
D Exact solution for internal reflections in diffusive media
The solution for internal reflections, , can be simply expressed in the solution without internal reflections, . Let us look at , the homogeneous solution for the situation with index ratio . If we define
| (294) |
then we get from the homogeneous version of Eq. (178)
| (295) |
We observe that comparison with Eq. (178) immediately gives the solution
| (296) |
Using the definition Eq. (294) we have to solve the inhomogeneous equation
| (297) |
where we used the identities [thmn5]
| (298) |
| (299) |
In a similar fashion we find for the special solution
| (300) |
with
| (301) |
Following the same steps we obtain the enhanced backscatter intensity. We must solve
| (302) | |||||
| (303) |
where [luckup]
| (304) |
involves
| (305) |
We find the following expressions for the dimensionless injection depth , the limit intensity , the differential reflection , and , the intensity of the backscatter cone normalized to the diffuse background, at outgoing angle coded in :
| (306) | |||||
| (307) | |||||
| (308) | |||||
| (309) | |||||
| (310) | |||||
| (311) |
respectively. The subtracted term in comes from single scattering, which does not contribute to enhanced backscatter.
Equations (297), (301), and (302) can be solved numerically. In many cases only a few iterations are needed. For close to unity the leading corrections for and are given by the first term in the equation for the ’s.
Explicit results can be obtained in the limit of large index mismatch [thmn5]. The point is that for the integral kernel becomes , which has a unit eigenvalue with right eigenfunction and left eigenfunction . For a large index mismatch this eigenvalue will bring the leading effects. The results will be discussed in the next section.
E Exact solution for very anisotropic scattering
As discussed in Sec. III the main effect of anisotropic scattering is that the scattering mean free path is replaced by the transport mean free path . As a result, the injection depth decomposes as ; likewise the opening angle of the backscatter cone is proportional to .
For anisotropic scattering the transport equation cannot be solved exactly in general. Several special cases were discussed by ?). He found that in absence of index mismatch the effects of anisotropy are typically not very large. ?) showed that the limit of strongly forward scattering can be solved exactly. This extremely anisotropic case is expected to set bounds for more realistic anisotropic scattering kernels. The approach of ?) goes along the lines of previous sections. However, certain constants occurring there are replaced by functions of an angle, which are only partly known. For details of the lengthy derivation we refer the reader to the original paper. The main results are presented in Table II, compared with the case of isotropic scattering.
We can compare the universal results in the very anisotropic scattering regime, for some of the quantities listed in Table II, with the outcomes of numerical approaches. ?) has investigated the dependence of various quantities on anisotropy for several commonly used phenomenological phase functions, including the Henyey-Greenstein phase function
| (312) |
The data on the skin layer thickness show that, as a function of anisotropy, varies from 0.7104 (isotropic scattering) to 0.7150 (moderate anisotropy), passing a minimum of 0.7092 (weak anisotropy); see ?). The trend shown by these data suggests that the universal value 0.718211 is actually an absolute upper bound for . Numerical data concerning is also available. ?) has extrapolated two series of data concerning the Henyey-Greenstein phase function which admits a common limit for very anisotropic scattering . This limit reads in our notation , whereas ?) gives the two slightly different estimates and . The agreement is satisfactory, although one cannot entirely exclude that the observed 0.8% relative difference is a small but genuine nonuniversality effect. Indeed, the Henyey-Greenstein phase function might belong to another universality class than appropriate for the approach of ?). The same remark applies to a less complete set of data [vdHulstNotes] concerning the intensity of reflected light at normal incidence.
In the presence of index mismatch the very anisotropic scattering limit can be solved exactly along the same lines as for isotropic scattering. The formalism becomes very heavy, however. In the limit of a large index mismatch the leading behaviors are expected to be the same as for isotropic scattering. The reason is that a large mismatch implies that the radiation that has entered the scattering medium will often be reflected internally before it can exit the medium. Therefore it undergoes many scatterings, so it loses the nature (anisotropic or not) of the individual events. This was verified explicitly by ?)
XI Large index mismatch
We have seen that the occurrence of internal reflections complicates the solution of the Schwarzschild-Milne equation. Yet in the limit of a large index mismatch the boundaries will act as good mirrors. They re-inject the radiation so often that it is also diffusive close to the boundaries. It turns out that, to leading order, the radiative transfer problem is greatly simplified.
Following ?) we consider the Schwarzschild-Milne equation in the regime of large index mismatch ( , or ). In both cases the reflection coefficient is close to unity and the effect of is small. We can thus expand in powers of . We first consider the Green’s function of the Schwarzschild-Milne equation Eq. (214) and write the kernel as
| (313) | |||||
| (314) | |||||
| (315) |
where is of order . This allows an expansion of Eq. (214) in powers of . If (which happens for or ), the kernel has unit eigenvalue, and Eq. (214) has eigenfunction , showing that for a medium with perfect mirrors the intensity inside is independent of the conditions outside. For small the value of will depend sensitively on . Let us write, for , the Green’s function as
| (317) | |||||
We insert this in Eq. (214):
| (320) | |||||
Comparing terms of equal order yields
| (321) | |||||
| (323) | |||||
| (325) | |||||
where we have neglected terms of order . Integrating these results over yields an expression for and a compatibility condition to ensure that has a unique solution:
| (326) | |||
| (327) |
We can simplify the expression for by introducing the angular averaged flux-transmission coefficient :
| (328) | |||||
| (329) |
where
| (330) |
Note that stands for the projection factor of flux in the direction. The expression for can be worked out explicitly using
| (331) |
For we introduce
| (332) |
When we substitute this becomes
| (333) | |||||
| (334) | |||||
| (335) |
Using
| (336) |
we find . This yields
| (337) |
The leading behavior for could have been found more quickly by taking the leading behavior of the numerator and denominator of Eq. (332).
| (338) |
Now we do the same for . We must not forget the Brewster angle: for there occurs total reflection. We now introduce and carry out the integration from to :
| (339) | |||||
| (340) |
The leading behavior for large could again have been found by keeping leading terms:
| (341) |
Further we notice that for , as it should be.
A Diffuse reflected intensity
We can now derive simply the leading behavior of the generalized bistatic coefficient:
| (342) | |||||
| (343) | |||||
| (344) |
We can use this to find an approximation for the reflected intensity in the case .
| (345) |
When , (since cannot exceed the Brewster angle, which is small at large ), implying
| (346) |
B Limit intensity and injection depth
The limit intensity of a semi-infinite space can also be calculated. From Eq. (218) it follows that
| (347) | |||||
| (348) | |||||
| (349) | |||||
| (350) |
The injection depth can also be calculated. If we take the (diffusion) approximation and insert it in the above equality we find
| (351) | |||||
| (352) |
Just as in the calculation of we can write the homogeneous solution as the sum of three parts:
| (354) | |||||
We further require that behaves as for . The constant is a correction to . For we can use definition Eq. (315) and that since the Brewster angle is small:
| (355) |
Inserting this in the equation for and comparing terms up to order , we obtain
| (356) |
while the equation for yields the compatibility relation
| (357) |
These equations cannot be solved analytically. Numerical analysis yields [thmn5], implying
| (358) |
In the limit the transmission coefficient is uniformly small, . Therefore the term of Eq. (214) arising from the kernel , defined in Eq. (315), becomes equal to
| (359) | |||||
| (360) | |||||
| (361) |
The diffusive shape is the exact solution of this equation, with . This leads to
| (362) |
In Fig. 12 numerical values of , , and have been plotted as a function of . The solid line is , while the dashed line is Eqs. (358)+(362). Notice that these asymptotic expressions work quite well up to .
C Comparison with the improved diffusion approximation
We can compare the exact results for with the improved diffusion approximation of Sec. III C For we can approximate and [see Eq. (74)] as
| (363) |
From Eq. (75) it follows that
| (364) |
which is very close to the exact value in Eq. (358). Notice that the same result follows when one inserts the diffusion approximation (for all ) in Eq. (357).
For deviations from the diffusion approximation show up only to second order in ,
| (365) |
To find corrections terms in powers of is essentially as complicated as solving the Milne equation at finite . For (no internal reflections), the exact value is known: . This can be compared with the result for the diffusion approximation found in Sec. III C,
| (366) | |||||
| (367) |
D Backscatter cone
We now determine the shape of the backscatter cone in the presence of strong internal reflections, in the regime . We have to solve
| (369) | |||||
For small the solution will have the form
| (370) |
Integrating Eq. (369) over , using that the bulk-kernel has an eigenvalue , and neglecting the dependence of , we find
| (373) | |||||
| (374) |
yielding
| (375) |
In passing, we have recovered the triangular shape of the backscatter cone.
Recently the width of the backscatter cone has been determined experimentally [denouter2]. The index ratio was varied using several types of glass containers. The measurements have been compared with the theoris of ?), of ?) and of ?). The first two results have already been discussed in Sec. III C. The experiments confirmed the theories of Zhu, Pine, and Weitz and of Nieuwenhuizen and Luck.
At first sight it may look strange that an experiment with light (vector waves) can be described by a scalar theory. ?) pointed out, however, that for large only diffusive aspects survive. More subtle properties, such as anisotropic scattering and the vector character lead to subdominant effects. The latter was verified explicitly by ?), indicating why the experiments of ?) are described so well by scalar theories.
XII Semiballistic transport
Wave propagation through waveguides, quantum wires, films, and double-barrier structures with a modest amount of disorder can be considered within the same approach. The so-called semiballistic regime occurs when in the transverse direction(s) there is almost no scattering, while in the long direction(s) there is so much scattering that the transport is diffusive. Various applications were noted by [thmn12] and discussed in detail by ?) The scattering has been considered both in the second order Born approximation and beyond that approximation. In the latter case it was found that attractive point scatterers in a cavity always have geometric resonances, even for Schrödinger wave scattering.
In the limit of long samples, the transport equation has been solved analytically including geometries such as: waveguides, films, and tunneling geometries such as Fabry-Pérot interferometers and double barrier quantum wells. The agreement with numerical data and with experiments is quite satisfactory. In particular, the analysis proved that the large, gate-voltage independent resonance width of GaAs double-barrier systems, observed by ?) can be traced back to scattering from the intrinsically rough GaAs-AlGaAs interfaces.
In the analysis of these systems, the Schwarzschild-Milne equation is decomposed on the cavity modes, thus becoming an evolution equation in the -direction for a matrix. The very same ideas as explained above are used in the solution. Due to the complication of the formalism we shall not present details here. We refer the reader to the original works and the references therein.
XIII Imaging of objects immersed in opaque media
A field of much current interest is the imaging of objects immersed in diffuse media for the purpose of medical imaging. The advantage of imaging with diffuse light is that it is non-invasive and as opposed to conventional X-ray tomography it does not cause radiation damage. One application is the detection of breast cancer, another application is the location of brain regions damaged by stroke (a lot of blood, hence more absorption) or affected by Parkinson’s disease (less than average blood level, hence more transparency). In these cases one can shine light at many locations, and measure the scattered light at many exit points. This information can in principle be used to determine the structure of the scattering medium and to detect possibly abnormal behavior. It is therefore important to know the scattering properties of idealized objects hidden in opaque media. We shall discuss here some instructive cases.
For light waves human tissue is a multiple scattering medium like the ones discussed so far. (Yet the absorption length is short, typically a few tenths of a millimeter). The diffuse transmission through tissue must already have been noticed by our early ancestors when they held their hands in front of a candle. On distances much larger than the mean free path, light transport is diffusive and is therefore governed by the Laplace equation. This observation brings a deep analogy with electrostatics: an object deep inside an opaque medium is analog to a charge configuration at large distance. It is well known that the latter can be expressed in terms of its charge and dipole moment, while higher multipole moments are often negligible. A similar situation occurs in an opaque medium: small objects far from the surface can be described adequately by their charge (which vanishes if there is no absorption) and dipole moment (which describes to leading order scattering from the object). At large distances the effect of, for instance, a charge will depend on the geometry of the system. As in electrostatics, mirror charges and mirror dipoles can be used in simple geometries. However, to solve the boundary problem of complicated geometries like a head is a hard problem. Close to the object, say, within a few mean free paths, the full radiative transfer is needed, making the problem more complicated than diffusion theory.
?) studied the diffuse image of an object embedded in a homogeneous turbid medium and found that it is well described by the diffusion approximation. This framework leads to a prediction of the diffuse image of the object, i.e., the profile of diffuse intensity transmitted through a thick slab near the embedded object. The shapes of the predicted profiles are universal since they depend only on large distance properties of the problem, and were convincingly observed experimentally for the case of a pencil (absorbing cylinder) and a glass fiber (transparent cylinder). Further results on imaging of objects within the framework of the diffusion approximation can be found in ?), ?), ?), and ?).
A Spheres
In the diffusion approximation the problem is straightforward. Close to the object (though still many mean free paths away) the intensity can be written as
| (376) |
where is the intensity profile in the absence of the object. ?) have introduced the following notation for the disturbance of the intensity
| (377) |
is called the “charge” and the “dipole moment” of the object. The linearity of the problem and the isotropy of the spherical defect imply that the charge is proportional to the local intensity in the absence of the object, while the dipole moment is proportional to its gradient. We therefore set
| (378) |
is called the capacitance of the spherical object, and its polarizability. These two parameters are intrinsic characteristics of the object. The capacitance is non-zero (and positive) only if the sphere is absorbing.
For plane wave incidence on a slab geometry one has the familiar expression . A double set of mirror charges is needed to make vanish at and for all :
| (379) | |||||
| (380) |
The intensity transmitted through the sample, and emitted on the right side at the point , is proportional to the normal derivative of the diffuse intensity at that point:
| (381) |
When there is no embedded object, the transmission is uniform . In the presence of an object one finds
| (382) | |||||
| (383) |
The information on the type of scatterer is coded in its capacitance and polarizability . In experiments on pencils and fibers, analogs of these profiles have been clearly observed experimentally [denouter]. In the same fashion the reflected intensity can be estimated by taking the derivative in Eq. (381) at . The rest of this section is devoted to determining and in idealized situations. This amounts to solving the scattering problem with the radiative transfer equation in the presence of an object placed at .
For large objects the diffusion theory can be used which simplifies the problem. Following ?) we consider a macroscopic object of radius , having diffusion coefficient and inverse absorption length , while the medium is nonabsorbing and has diffusion coefficient . At the boundary of the object one has
| (384) | |||||
| (385) |
Near the object one has
| (386) |
where sinhcsinh. Matching the solutions gives
| (387) |
For a totally absorbing sphere () the result follows immediately by requiring in Eq. (376) that . The polarizability reads
| (388) |
In the absence of absorption this reduces to
| (389) |
?) consider the limit of small objects: a point scatterer with scattering cross section , extinction cross section , and albedo . If diffuse intensity hits the scatterer once, but does not return to it, and read
| (390) |
where . The intensity can also return an arbitrary number of times to the scattererer. For point scatterers this boils down to a geometric series expansion for and .
| (391) |
where and are integrals describing the propagation of the diffuse intensity through the medium and the effect of hitting the scatterer another time. These integrals are actually divergent in the limit , which leads to introduce extra internal parameters of the point scatterer.
As opposed to extended objects, for point scatterers the maximally crossed diagrams also contribute. The reason is that exit and return point coincide, so there is no de-phasing. The analysis finally yields
| (392) |
which retains the structure of Eq. (391). Note that there is an additional factor 2, except for the diagrams with one intermediate common scatterer, an effect that is accounted for by subtracting . This is very similar to the fact that the single-scatterer diagram does not contribute to the enhanced back scatter cone, see eq. (251). ?) also considered more realistic situations in an approach involving a partial wave expansion.
For extended objects it is a highly non-trivial task to go beyond the diffusion approximation. ?) considered the application of the radiative transfer equation to such cases. One thus has to solve the analog of the scattering problem of quantum mechanics, for this transfer equation. This is generally a hard and still unsolved problem. However, there are three cases where the inside of the scatterer plays a trivial role: a totally absorbing (black) object (having ), a transparent, non-absorbing object (having , ), and a totally reflecting, non-absorbing object (having ). For spheres and cylinders of these types, the scattering problem can be reduced to an integral equation in one variable, which is solved exactly in the limits of small and large objects. In the latter case the results of diffusion theory are recovered, and the first order corrections to diffusion theory were found, see Table III and Figs. 13 and 14. The same approach can be extended, in principle, to more general cases.
B Cylinders
The use of the radiative transfer approach can be extended to other objects [luck98]. Consider a cylinder with radius with its axis parallel to the -axis. Assume the sample is infinitely long in the x-direction, so that both and the disturbance depend only on the two-dimensional perpendicular component . Eq. (377) is replaced by
| (393) |
The length scale , requested by dimensional analysis, is determined by conditions at the boundaries of the sample, so that it is in general proportional to the sample size. This sensitivity of to global properties of the sample arises because the logarithmic potential of a point charge in two-dimensional electrostatics is divergent at long distances. As a consequence, the capacitance is not intrinsic to the cylinder. An intrinsic quantity is its effective radius , defined by the condition that the cylindrically symmetric part of the total intensity, including the charge term, vanishes at a distance from the axis of the cylinder. We thus have , hence, with ,
| (394) |
We observe that and have the dimension of a length, while the polarizability has the dimension of an area. As a consequence, the orders of magnitude and can be expected for a cylinder of radius . For the same physical situations as above, more accurate predictions can be found in Table III. For a cylinder in a slab geometry the transmitted intensity finally reads in terms of and
| (395) |
where
| (396) |
is indeed of order , but also depends non-trivially on the aspect ratio . These shapes have been observed in the experiments of ?).
XIV Interference of diffusons: Hikami vertices
So far our discussion has focused on the intensity aspects of wave transport. We now consider interference effects, which are due to the inherent wave nature of the problem. First we have to introduce the concept of interference vertices. These vertices describe the interaction between diffusons. The vertices are named after Hikami, who used them in 1981 [hikami] for the calculation of weak-localization corrections to the conductance. Their original introduction dates back two years earlier to the work of ?). Remember that each diffuson consists of two amplitudes. The vertices describe the exchange of amplitudes between diffusons, which leads to correlations between the diffusons. It is also possible to represent these processes using the standard impurity technique diagrams, as described for instance by ?), but the interference vertices prove to be more convenient.
A Calculation of the Hikami four-point vertex
We start with the simplest vertex: the four point vertex, in which two diffusons interchange an amplitude. The technique for calculating the vertex by means of diagrams is well known [abrikosov]: First, draw the diagrams; second, write down a momentum for each line and use momentum conservation at each vertex; and finally, integrate over the free momenta. The first step, writing down all leading diagrams, requires some care. In Fig. 15 we have drawn the diagrams in the Hikami box to second-order Born approximation. It is important to include all leading diagrams, as there will be a cancellation of leading terms. These cancellations are imposed by energy conservation. In the second-order Born approximation one neglects scattering more than twice from the same scatterer; the (dashed) interaction line indicates that the propagators scatter once on the same scatterer. Scattering processes involving just one propagator were already included, as the propagators are dressed. We have not drawn all diagrams, one can imagine. First, the box is attached to a diffuson ending with a scatterer (which is consistent with the way we have defined the diffusons). As a result, common scatterings between propagators on the same leg are not allowed in the vertex as they are already included. Secondly, diagrams with two or more scatterers and parallel dashed lines are subleading. They contain loops with two propagators of the same type, i.e., integrals like , which turn out to be of higher order in . Third diagrams with two crossed dashed lines are also subleading. Finally, we again work in the independent-scatterer approximation.
As an example we calculate the second right hand side diagram of Fig. 15. As usual in the diffusion approximation, the diffuse intensity is assumed to be slowly varying, which allows us to expand the Green’s functions as
| (397) | |||||
| (398) |
with the shorthand notation . The momenta, numbered according to Fig. 15, point towards the vertex. We number the Green’s functions also according to the figure. Note that this particular diagram is a product of two loops. To lowest order in we have
| (400) | |||||
| (402) | |||||
where the are the momenta of the diffusons, the are the frequency differences of the diffusons, and is the scatter potential. The integrals are given in Appendix A. We take absorption terms into account to lowest order, i.e., only in the leading contributions, the terms. This yields
| (403) |
Here we made use of the fact that in second order Born approximation .
A similar calculation gives and . Defining the reduced frequencies of the legs as , , and , we find for the sum of the three diagrams
| (404) | |||||
| (405) |
This is the main result of this section. Note that the leading, constant terms proportional to have canceled, which is closely related to the current conservation laws [kane].
In Eq. (405) it is important to keep track of the terms. When the vertex is attached to a diffuson, the terms together with and yield according to the diffusion equation, . The constant factor in the right-hand side corresponds to a delta function in real space. If we attach external diffusons to the Hikami box, this delta function is nonzero at roughly one mean free path from the surface and its contribution can be neglected, as its effect is of order . As a result, the absorption part and the frequency-dependent part vanish:
| (406) |
where we have denoted . In most calculations, however, we use a Fourier transform in the direction, because in our slab geometry the representation is the most convenient. Then the terms become differentiations:
| (407) |
The differentiations work on the corresponding diffusons and afterwards should be set . Formally one has
| (408) | |||||
| (409) |
but we just write this as . Note that the vertices yield the spatial derivatives of the diffusons, that is, their fluxes. This observation is helpful in estimating the influence of internal reflections, which reduce the spatial derivatives of the diffusons.
B Six-point vertex:
We shall also need a second order diagram the six-point vertex . Six diffusons are connected to this diagram (Fig. 16). This diagram was calculated by ?). Again, the dressings of the diagrams have to be added to the bare diagrams. Taking rotations of the depicted diagrams into account, there are 16 diagrams in the second-order Born approximation. (It is not allowed to dress the bare six-point vertex with a scatterer that connects two opposite propagators. This dressing gives a leading contribution also, but the resulting diagram is the same as a composed diagram with two four-point vertices. Therefore, it should not be included here, but it will enter in diagrams with two vertices.) One finds
| (411) | |||||
Apart from the frequency and absorption terms included here, Hikami’s original expression can be derived from Eq. (411) using momentum conservation.
C Beyond the second-order Born approximation
Going beyond the second-order Born approximation in the calculation of the diffuson diagrams, meant that in the diagrams the matrix replaced the potential . This resulted in a replacement of the mean free path: it became instead of . However, for the vertices the situation is more subtle. In the previous calculations we worked to second-order of the scattering potential, thus neglecting diagrams with more than two scatterings on the same scatterer. Including all orders there are eight diagrams, Fig. 17.
The calculation is very similar to that of the second-order Born approximation above. The only difference is that instead of , the matrices and occur ( on ’s, on ’s). After summing the expressions for the eight diagrams, one finds the same result for the Hikami box as was found previously in second order Born approximation, Eq. (405). However, the definition of the mean free path is different: instead of . We conclude that, although extra diagrams were present, only the mean free path was renormalized in extending from second-order Born to the full Born series. This can also be shown on a much more generally in the nonlinear sigma model [lernerprive]. For the six-point vertex it was not checked explicitly whether the second and full Born approximations give the same result (there are at least 64 diagrams), but we have no doubt they will.
D Corrections to the conductivity
In the original works of Gor’kov et al. and Hikami, the vertices were introduced to calculate weak-localization corrections to the conductivity. We have already mentioned that the maximally crossed diagrams give the largest correction to the conductivity, increasing the return probability of the intensity. In the Hikami vertex formalism these diagrams are drawn in Fig. 18. The correction to the diffusion constant diverges with the sample size in one and two dimensions. This divergence indicates the absence of extended states in one and two dimensions no matter how small the disorder. In three dimensions, however, there is a transition to a localized state at a finite level of disorder. In this work we do not consider such loop effects. We suppose that we are far from localization, so that we can restrict ourselves to the leading processes, and the vertices show up only in the interaction between different diffusons.
XV Short range, long range, and conductance correlations: , , and
A nice feature of optical mesoscopic systems, as compared to electronic systems, is that they permit to measure certain parts of the transmission signal separately. Depending on whether integration over incoming or outgoing directions is performed, one measures fundamentally different quantities. In electronic systems one usually measures the conductance of the sample. This is done by connecting incoming and outgoing sides to a clean electron “bath.” All electrons are collected and all angular dependence is lost. In contrast, in optical systems one usually measures the angular resolved transmission, but angular integration is possible. The correlation functions of the different transmission quantities, their magnitudes, their decay rates, and the underlying diagrams are all very different.
In this section we discuss correlation functions for all three transmission quantities. See also the review by ?) for the physical meaning of the correlations. We try to provide all quantitative factors relevant for an experiment. In later sections the same approach will be extended to higher order correlations.
A Angular resolved transmission: the speckle pattern
If a monochromatic plane wave shines through a disordered sample, one sees large intensity fluctuations in the transmitted beam, so-called “speckles.” The speckle pattern is wildly fluctuating (as a function of the frequency of the light or the outgoing angle). The typical diameter of a speckle spot on the outgoing surface is . We are interested in the correlation between speckle patterns of two different beams. The beams may have different incoming angles, different frequencies, or different positions.
We denote the transmission from the incoming channel (wave coming in under angles ) to the outgoing channel (waves transmitted into angles ) as . There are short, long, and “infinite” range contributions to the correlation function of the speckles. The frequency correlation functions can be classified as
| (412) |
?) originally put this expression forward as an expansion in , where was of order one, of order , and of order . We return to this expansion below. We present a sketchy picture of the diagrams of the different correlations in Fig. 19. The largest contributions to transport are from the independent diffusons, yet correlations are present, mixing diffusons with different frequencies or angles.
The unit contribution in Eq. (412) just comes from the uncorrelated product of average intensities. The -term in the correlation function is the leading correlation if the angular resolved transmission is measured. It is unity if the two incoming directions and are the same, the outgoing directions and are the same, and is zero. If one changes the frequency of the incoming beam, the speckles of the outgoing beam deform and eventually the correlation vanishes exponentially. This effect is the short ranged contribution. Also of interest is the case of the angular correlation with the frequency fixed: If the angle of the incoming beam is changed, the speckles change due to two effects. First, the speckle follows the incoming beam. This is also known as the memory effect, which one can even see by the naked eye. Secondly, the speckle pattern also deforms, i.e. it de-correlates, this is again the correlation. The correlation is a sharply peaked function nonzero only if the angle of the incoming and outgoing channel are changed by the same amount. Diagrammatically, the factorizes in two disconnected diagrams, see Fig. 19.
Theoretical studies of were first done by ?). Experimental work on as function of angle, explicitly showing the memory effect, was done by ?). ?) studied the frequency dependence of . Later, the effects of absorption and, especially, internal reflection were studied [freund2, skin].
B Total transmission correlation:
The correlation stands for the long range correlations in the speckle pattern. Consider again a single-direction-in single-direction-out experiment. Again the two incoming angles are the same (), yet this time we look at the cross correlation of two speckles far apart. As there is an angle difference in the outgoing channel, but not in the incoming beam, the term is now absent. Instead there is a much weaker correlation. As the frequency shifts, this correlation decays algebraically. This is the contribution. It describes correlations between speckles far apart. In a single-channel-in single-channel-out experiment it is only possible to see the weak effects of these higher order correlations in very strongly scattering media, i.e., if the system is rather close to Anderson localization. This type of experiment was done by ?). The term can be measured more easily in a setup using one incoming channel and integrating over all outgoing channels. In an experiment the outgoing light is collected with an integrating sphere. Therefore, one measures the total transmission . In this setup the correlation function, which has a much smaller peak value but is long ranged, contributes for all outgoing angles. The term is now the leading correlation as the sharply peaked term is overwhelmed, a precise estimate of the contribution in was given in [t3pre]. Only outgoing diffusons with no transverse momentum and no frequency difference in their amplitudes are leading in the total transmission, as then the phases of the outgoing amplitudes cancel. From Fig. 19 one sees indeed that it holds for the diagram (outgoing lines of similar style pair), but not for the diagram. The long range character of the arises due to interference of the diffuse light paths. It is of order and corresponds to a diagram where the two incoming diffusons interact through a Hikami vertex, where the diffusons exchange amplitudes.
The long range correlation function was first studied by ?). Zyuzin and Spivak introduced a Langevin approach to simplify the calculation of correlation functions [zyuzin1]. ?) applied this method to calculate the correlation functions of light transmitted through and reflected from disordered samples. The correlation functions were measured in several experiments. For optical systems Van Albada et al. performed measurements [albada1, deboer]. Microwave experiments were performed by ?) and ?). In several papers effects of absorption and internal reflections were studied, see ?), ?), ?), and ?). It was shown that absorption and internal reflection, neglected in the earliest calculations, significantly reduce the correlations.
C Conductance correlation:
Finally, the term in Eq. (412) is dominant when the incoming beam is diffuse, and one collects all outgoing light. Experimentally one could do this using two integrating spheres. Then one measures, just as in electronic systems, the conductance . In that measurement contributions to the correlation are dominant, where the angles and are arbitrary far apart. Though is of order , it dominates over the and terms as it has contributions from all incoming and outgoing angles. Therefore it is sometimes called the “infinite” range correlation. In contrast to the term, now also the amplitudes of the incoming diffusons must have opposite phases. This occurs in a diagram where the two incoming diffusons interact twice. Note that a loop occurs, see Fig. 19. Apart from the normalization to the average, equals the Universal Conductance Fluctuations, or UCF.
The UCF were an important discovery in the study of mesoscopic electron systems. The electronic conductance of mesoscopic samples shows reproducible sample-to-sample fluctuations. This was observed in experiments on mesoscopic electronic samples by ?). The theoretical explanation was given by ?) and by ?). For reviews on the subject see ?) and the book edited by Altshuler et al. [altshulerboekgeheel]. The discovery of these fluctuations showed that interference effects are important in electronic systems, even far from the localization transition. The variance of the fluctuations is independent of the sample parameters such as the mean free path, the sample thickness and, most remarkably, the average conductance. Therefore, the fluctuations are called universal conductance fluctuations. The conductance fluctuates when the phases of the waves in the dominant paths change. This happens, of course, if one changes the position of the scatterers, e.g. by taking another sample. One also may keep the scatterers fixed but apply a magnetic field or vary the Fermi energy. In all these cases one modifies the phases of scattered waves, so that different propagation paths become dominant. The fluctuations are much larger than one would obtain classically by modeling the system by a random resistor array, in which interference effects are neglected. A classical approach is valid only on a length scale exceeding the phase coherence length, where the fluctuations reduce to their classical value.
Unfortunately, despite some advantages of optical systems, the analog of the UCF has not yet been observed in optical systems. Such experiments turn out to be difficult. Although the magnitude of the fluctuations is universal, they occur on a background of order , where is the dimensionless conductance (in optical experiments one typically has ). The relative value of the fluctuations to the background is thus , so that the correlation function is of order , typically of order . For electrons this problem is absent as smaller values of are achievable. In the electronic case there have been many observations of the universal conductance fluctuations.
A promising candidate for measuring is the microwave experiment of ?). In such a set up one always has good control over the channels. Moreover, one is able to study materials with large disorder, i.e. down to .
In principle the and correlations are present as a sub-leading term in the angular correlation function, but there are also other contributions of order and , respectively, to the correlation Eq.(412). The weak localization correction, see Sec. XIV D, is an example of a contribution to . We have drawn a contribution to in Fig. 20. Such corrections are studied by ?). Therefore, the interpretation of the ’s as an expansion in is misleading. Rather we define the , , and as the leading term in the correlation of , , and , respectively. Equivalently, contains disconnected diagrams; incoming and outgoing amplitudes automatically have the same pairing. The term contains connected diagrams swapping the initial pairing, and contains all connected diagrams in which incoming and outgoing pairings are identical.
XVI Calculation of correlation functions
A Summary of diffuse intensities
For the calculation of interference effects it is often too complicated to take the precise behavior near the boundaries into account. We therefore approximate the diffuse intensity with tis bulk behavior, yet we will use the prefactors and angular dependence, i.e. especially and , found with the radiative transfer approach.
The diffuse intensity created from a beam impinging in direction is
| (413) |
For uniform illumination of the sample the source term in the transport equation becomes
| (414) |
Using this source term in the Schwarzschild-Milne equation gives the diffuse intensity for a uniform illuminated sample
| (415) |
Defining
| (416) |
and comparing the pre-factors, one has
| (417) |
Finally, for diffuse propagation between two points in the slab one has
| (418) |
with the solution
| (419) |
For angular resolved measurements the outgoing intensity in a certain direction is, in analogy with Eq. (417),
| (420) |
The angular transmission coefficient reads
| (421) |
The total transmission coefficient is
| (423) |
The conductance reads, cf. Eq. (230)
| (424) | |||||
| (425) | |||||
| (426) |
B Calculation of the correlation
The calculation of is rather simple as it is just the product of two independent diffusons with exchanged partners. Both diffusons consist of one amplitude from one beam and one complex conjugated amplitude from the other beam. Due to momentum conservation in each diffuson, the perpendicular momentum difference of the two incoming beams, , is equal to the difference of the outgoing momenta. Therefore, the is only nonzero if incoming and outgoing angles are shifted equally during the experiment.
We calculate the normalized product of a diffuson with “squared mass” and the complex conjugated diffuson. This yields:
| (427) | |||||
| (428) |
In Fig. 21 this function is drawn for various situations. In thick samples where and no absorption is present, the result reduces to [feng]
| (429) |
For large angle or frequency difference (), decays exponentially, as . The spatial correlations of beams can be extracted from the Fourier transform of the angular correlation function.
C Calculation of the correlation
The diagram of the long range correlation is depicted in Fig. 22. Remember that is zero if incoming and outgoing angles are changed unequally, but is connected, allowing momentum flow from one diffuson to the other, therefore it is nonzero if one changes incoming and outgoing angles by a different amount. stems from the interaction between two diffusons, which exchange partners somewhere inside the slab. The Hikami box describes this exchange. (For an estimate of correlations a -type experiment see ?).) We have
| (430) |
We have labeled the incoming diffusons with odd numbers and the outgoing diffusons with even numbers, a convention used throughout this work. Attaching diffusons to the Hikami box allows a simplification of the expression for the box. We calculate by inserting , . In the coordinate representation the box reads, see Sec. XIV,
| (431) |
The above calculation for is similar to the one obtained in the Langevin approach, as one can see by comparing Eq. (39) of [pnini2] to Eqs. (431) and (430) in this section. In the Langevin approach one assumes that there is a macroscopic intensity, which describes the average diffusion, and an uncorrelated random noise current superposed. In our approach we have a slowly varying diffuse intensity, while the point-like, uncorrelated random interactions originate from the Hikami box.
We discuss some simplified cases. Consider first the case of angular correlations and no absorption but taking the boundary effects into account:
| (432) |
in which we define the dimensionless function
| (435) | |||||
which decays like for large (i.e. for large angles). However, it still should hold that , else we probe essentially interference processes within one mean free path from the surface, which is beyond this approach. Neglecting boundary effects, , one recovers [pnini1]
| (436) |
with . In Fig. 23 we have plotted the function for various situations.
We have studied the correlation as function of the two-dimensional momentum . Similarly, we can study the real space correlations. The functional form in real space is of roughly similar shape as Fig. 23, with typical decay length in the direction [stephen1]. One can also obtain frequency correlations. Without absorption, neglecting boundary effects, one finds [deboer]
| (437) |
Of special interest is the top of the correlation function. By definition the top of the correlation function corresponds to the second cumulant, or second central moment, of the total transmission distribution function. With a plane wave as incoming beam, all transverse momenta are absent, we also neglect absorption. These assumptions correspond to all being equal zero in Eq. (430). The diffusons are simple linear functions, given by Eq. (413) and (420). Neglecting internal reflections, one obtains for the second cumulant [stephen1]
| (438) | |||||
| (439) | |||||
| (440) |
where double brackets denote cumulants normalized to the average. The correlation is thus proportional to . The inverse power of counts the number of four-point vertices, this power can be looked upon as the chance that two intensities interfere.
One obtains a general expression for by inserting the appropriate diffusons and the Hikami box Eq. (431) into Eq. (430). The result is rather lengthy and was given in ?).
1 Influence of incoming beam profile
We now study the influence of the beam profile on the correlation. In experiments the beam is often focused to a small spot in order to minimize the dimensionless conductance and therefore to maximize the correlations. Physically it is clear that the correlations increase if the two incoming channels are closer to each other, i.e., if the beam diameter is smaller. If the spot of the incoming beam is finite, amplitudes with different angles, i.e. different transverse momenta, are present. They can combine into incoming diffusons with perpendicular momentum. We suppose that the incoming beam has a Gaussian profile. We decompose it into plane waves defined in Eq. (173) (for convenience we assume the average incidence perpendicular)
| (441) |
where is the beam diameter. In order to have two diffusons with a momentum and , we find that the four incoming amplitudes combine to a weight function
| (442) |
We get the correlation function by integrating the dependent correlation function over the momentum with the corresponding weight. Neglecting boundary layers we find for the top of the correlation [deboer]
| (443) |
with as in Eq. (436). If the incoming beam is very broad, , only the term contributes and one recovers the plane wave behavior . The second cumulant decreases as at large . At smaller beam diameters the top of the correlation is proportional to , and diverge in this approximation, in which .
2 Reflection correlations
Similar to transmission correlations, reflection correlations were studied. We have seen that the transmission corresponds to the diffusons, but in reflection there are two intensity diagrams: the diffusons bring a constant background, the maximally crossed diagrams yield the enhanced backscatter cone, which is only of importance if incoming and outgoing angles are the same. This leads to more diagrams and to more peaks in the reflection correlation than in the transmission correlation. For the one can pair diffusons and maximally crossed diagrams [berkovits4]. Indeed in optical experiments two peaks were seen by ?). The term in reflection was treated by ?). Measurement of in reflection by collecting all reflected light is tricky as it is hard not to interfere with the incoming beam. Nevertheless, measurement may be possible as a long range component in the angular resolved reflection (this however requires quite small values of ). For both and in reflection one does not expect a very good agreement with theory, the problem is that the precise behavior of the diffuson near the surface is important. The diffusion approximation is not valid anymore, in particular if the indices of refraction match (then the intensity gradient near the surface is the largest). The calculation of is probably easily extended, yet for one also would need the Hikami box beyond first order in .
D Conductance Fluctuations:
One could be tempted to think that the calculation of the or UCF in the above Landauer approach is also straightforward. However, the calculation in the Landauer approach is quite cumbersome, as on short length scales (of the order of the mean free path) divergences show up when one treats the problem on a macroscopic level using diffusons. As an alternative, the Kubo approach is often used in mesoscopic electronic systems [altshuler2, lee, lee2]. The results for the conductance obtained by either Kubo or Landauer formalism should be identical, see ?) and ?). Yet the Kubo approach cannot be applied directly to optical systems when absorption is to be included. Studies of in the Landauer approach were undertaken by ?), ?), and by the present authors [c3pre] where it is shown explicitly that all divergences cancel.
The correlation function, defined in Eq. (412), involves incoming diffusons , and outgoing ones . Due to the factorization of the external direction dependence, see Eqs. (417), (420), and (426), this dependence on external parameters cancels from . We can write
| (444) |
where is the -dimensional transverse momentum. The function is the main object to be determined in this section. We thus calculate it at fixed and with external diffusons for diffuse illumination and , Eqs. (415) and (420). Depending on dimension we have
| (445) | |||||
| (446) | |||||
| (447) |
In contrast to and , as a result of the integral, will depend on the dimensionality of the system.
Let us work out the long range diagrams of , roughly depicted in Fig. 19, in more detail. For all diagrams there are two incoming advanced fields, which we momentarily term and , and two retarded ones, and . Consider an optical experiment with integrating spheres at incoming and outgoing sides. The incoming diffusons cannot have a momentum or frequency difference, and the pairing must be and . In Fig. 24(a) the incoming diffusons interfere somewhere in the slab. In a diagrammatic language the diffusons interchange a propagator so that the pairing changes into and . Propagation continues with these diffusons, which, due to the different pairings can have nonzero frequency difference and nonzero momentum. Only the outgoing diffusons without a momentum or frequency difference are dominant. Therefore, somewhere else in the slab a second interference occurs. Again exchanging an amplitude, the original pairing, and , is restored and the two diffusons propagate out, see Fig. 24(a)i. Other contributions occur as well, yet the incoming and outgoing pairings are always and . In Fig. 24(a)ii the first incoming diffuson meets an outgoing diffuson and exchanges amplitudes. These internal diffusion lines meet at a second point where the original pairings are restored. Clearly in this process the intermediate paths are traversed in time reversed order. Due to time-reversal symmetry they give a contribution similar to Fig. 24(a)i. In Fig. 24(b)i a diffuson breaks up such that one of its amplitudes makes a large detour, returns to the breaking point and recombines into an outgoing diffuson. The second incoming diffuson crosses the long path of the amplitude, and one of its amplitudes follows the same contour as the first diffuson. Finally, Fig. 24(c) depicts the situation where only one internal diffuson occurs. Its endpoints must lie within a distance of a few mean free paths. Because of the local character this class does not show up in the final result; we need it, however, since it contains terms that cancel divergences from the other two classes.
E Calculation of the correlation function
The diagrams for the conductance fluctuations contain a loop; the two internal diffusons have a free momentum, over which one has to integrate. In Fig. 24(a) we denote this momentum . Physically, one expects important contributions to the conductance fluctuations if the distance between the two interference vertices ranges from the mean free path to the sample size. Yet the integral diverges for large momentum, i.e. when the two interference processes are close to each other. The standard picture of diffuse transport with diffusons and interference described by Hikami vertices, that works so well for loop-less diagrams such as the correlation function (section XV), and the third cumulant of the total transmission (section XVII), becomes spoiled by these divergences.
As an example we calculate the diagram presented in Fig. 24(a)i. This diagram was first depicted by ?) and considered in detail by ?). These authors pointed out that a short distance divergency appears. They found a cubic divergency in three dimensions, and in general, a -dimensional divergency in dimensions. Let us see how it appears. For simplicity we consider a quasi one-dimensional system for which frequency differences and absorption are absent, therefore the decay rate vanishes, i.e. for all diffusons. From Fig. 24(a)i one directly reads off its corresponding expression
| (448) |
After performing some partial integrations and using the diffusion equation Eq.(418) one finds
| (452) | |||||
were the spatial derivative of was denoted . The divergency is clearly present in the , it comes about as follows: For the case of zero external momenta, the Hikami box yields , while the internal diffuson has the form . Omitting the external lines, the diagram leads to
| (453) |
We label the expressions according to the diagrams in Fig. 24, , and and sum them. For the 1D case we find
| (454) |
The second term in Eq.(454) is exactly equal to the well known result for the UCF in one dimension. (Note that the pre-factors of the diffusons and the Hikami boxes have canceled precisely. This is a manifestation of the universal character of conductance fluctuations.) But a singular part is annoyingly present. The term is a linear divergency. In the three-dimensional case one has to integrate over the transverse momenta yielding a cubic divergency.
The cancellation of this divergence is involved and requires a number of special short range diagrams which resist a general classification or treatment [c3pre]. Here we only use that finally the special short range diagrams cancel the divergences, yet they give no long range contribution. The nondivergent part of the diagrams of Fig. 24 is the only remainder. It reads
| (456) | |||||
| (458) | |||||
in which again . The upper line of (458) corresponds to the diagrams of Fig. 24(a), whereas the lower line corresponds to the diagrams of Fig. 24(b). Finally, with Eq. (447) the value at vanishing transverse momentum gives the variance of the conductance in one dimension, whereas integration over the transverse momentum yields the correlation in two and three dimensions.
Using Eqs. (458) and (447) and inserting inserting the appropriate diffusons, various cases can be studied. Consider the case of fully transmitting surfaces; neglecting absorption and frequency differences one finds
| (459) |
which decays for large momenta as , thus converging in three or less dimensions. The subsequent integration over the loop momentum finally yields
| (460) | |||||
| (461) | |||||
| (462) |
in which is Riemann’s zeta function. These values are for wide slabs. For cubic samples ?) find in 2D that and in 3D a value of (the value in 1D is of course the same). One can also determine the frequency dependency of the correlation using (458), which is of importance as it determines the frequency range of the light needed to see the fluctuations [c3pre]. By inserting the appropriate diffusons one can also study the case of partial reflection at the surfaces of the sample. It is physically clear that the internal reflections lead to a less steep diffuse intensity in the sample as a function of the depth. The fluctuations are proportional to the space derivatives and thus reduce. We present the results in Fig. 25 where we have plotted the correlation function for various values of the ratio between extrapolation length and sample thickness. One sees that the correlation is lower than without internal reflections. We note that neither the variance (the value at vanishing ), nor the form of the correlations are fully universal.
XVII Third cumulant of the total transmission
So far we considered correlations between intensities defined as
| (463) |
The , , and correlation functions describe correlations between two intensities. By definition their value at zero frequency and zero momentum difference, i.e. the peak value, is the second cumulant of the distribution functions of the transmission quantities. An obvious question is how higher cumulants behave. The size of the fluctuations and the shape of the distribution relates to the “distance” from the localization transition. Far from localization, diffusion channels are almost uncorrelated and fluctuations are small (except the optical speckle pattern in the angular resolved transmission). The correlation between the channels increases if localization is approached. The relevant parameter is the inverse dimensionless conductance , which can be interpreted as the chance that two channels interfere. Close to Anderson localization approaches unity, and fluctuations increase.
A Cumulants of the probability distribution
We first study the third cumulant of the total transmission. The total transmission is a constant superposed with fluctuations. To first order in the fluctuations have a Gaussian distribution [deboer, kogan]. The relative variance of this distribution, the top of , is proportional to , it is thus a factor larger than for the conductance fluctuations. This sensitivity of the total transmission to interference processes and its simple limiting behavior (as compared to the angular resolved transmission) make it an ideal quantity to study mesoscopic effects in its distribution. The third cumulant of the distribution was determined in very precise experiments by ?). In this section we calculate its theoretical value. Using the diagrammatic approach we relate the third cumulant normalized to the average total transmission, , to the normalized second cumulant .
The moments of the probability distribution can be extracted from the distribution as
| (464) |
In a diagrammatic approach the -th moment can be represented by a diagram with diffusons on both incoming and outgoing sides. The term is the average total transmission , as given by the Schwarzschild-Milne equation in Eq.(423), it corresponds to a single diffuson and is thus independent of channel-to-channel correlations. The second moment can be decomposed in the first two cumulants:
| (465) |
where the double brackets denote cumulants normalized to the average. Diagrammatically we depict the second moment in Fig. 26. The decomposition in cumulants proves useful as each cumulant corresponds to a different number of interactions between the diffusons. The first term, Fig. 26(a) contains no interference; it factorizes in the average transmission squared. The second term, Fig. 26(b), is the second cumulant . It gives the variance of the fluctuations. This is just a special case of the correlation function, .
Likewise, one can distinguish three different contributions to the third moment,
| (466) |
We have drawn the corresponding leading diagrams in Fig. 27. The first term, Fig. 27(a), again corresponds to the transmission without interference. The second term, Fig. 27(b), is the product of a single diffuson and a second cumulant diagram. From the figure it is clear that this decomposition can be done in three ways which determines the combinatorical prefactor of in Eq. (466). The third contribution stands for the third cumulant of the distribution and expresses the leading deviation from the Gaussian distribution. This is the term we are mainly interested in. It consists of two related diagrams: Fig. 27(c+d). The three intensities can interfere twice two by two, or the intensities can interact all three together, with a Hikami six-point vertex. Both contributions will prove to be of the same order of magnitude. The strength of the effect can be easily estimated using the interpretation of as an interaction probability. By looking at the diagram, the third cumulant is proportional to the chance of two diffusons meeting twice, thus of the order . We have thus found the estimate
| (467) |
Finally, we note another that there is another contribution to both second and third cumulant. Because there is only a finite number of channels in an experiment, the intensity distribution will always have non-zero width. We have verified that this effect brings a negligible contribution to the measured second cumulant and the third cumulant [t3pre].
B The calculation of the third cumulant
Two processes contribute to the third cumulant. One with two four point vertices, that we term and one with a six point vertex , where we have chosen the subscripts according to Fig. 27.
Interference via two four point vertices
First consider the diagram in Fig. 27(c). We have labeled to incoming diffusons with odd numbers, the outgoing ones with even numbers. Two incoming diffusons, and , meet at a position , in a Hikami box they interfere into and an internal diffuson . propagates out, whereas interferes again at with the incoming diffuson into two outgoing ones, and . Apart from this process, also three other sequences of interference are possible. This means that the diffusons can also be permuted as: . We denote the sum over these permutations as . As the diagrams can also be complex conjugated, there is also a combinatorial factor 2 for all diagrams. (Note that this is different from the calculation; the second cumulant diagram is identical to its complex conjugate and thus there is no such factor.) The expression for the diagram of Fig. 27(c) is now
| (469) | |||||
In turns out that it is useful to rewrite the form of the Hikami boxes as introduced in Eq.(405) into an equivalent expression, using momentum conservation . In real space the use of momentum conservation corresponds to partial integration. The Hikami box is again simplified using the fact that there are no transverse momentum terms, or terms, for the outgoing diffusons. Using the numbering in Fig. 27, we obtain
| (470) |
Source terms, i.e., terms of the incoming and outgoing diffusons were again neglected, but the source term of the diffuson between the vertices is important. As one sees with the diffusion equation (418), it brings
| (471) |
The contribution from the source term, i.e. , , is
| (472) |
Although this corresponds to a local process (just one coordinate is involved), it is of leading order. Together with the expression coming from , proportional to , we find for the total contribution of the process in Fig.27(c)
| (476) | |||||
where denotes the derivative of . Calculated for a plane wave, one finds
| (477) |
which is indeed proportional to , as predicted.
Contribution of the six-point vertex
The other diagram contributing to the third cumulant is depicted in Fig. 27(d). The hexagon is again the Hikami six point vertex . It can be thought of in the following way: the use of the Hikami box assumes that the outgoing legs scatter at least once before they propagate out or interfere again. This is a reasonable assumption for the outgoing diffusons, but for the internal diffuson it is also possible that coming from it directly, i.e., without scattering, interferes again at . This process was not yet included in the calculation of the previous subsection but has to be studied separately. The unscattered intensity decays exponentially over one mean free path, therefore this process is only important if and are within one mean free path. As the diagrams can also be complex conjugated, there is also a factor 2 for all diagrams.
After a Fourier transformation in the direction the six-point vertex yields a contribution to the third cumulant
| (479) | |||||
were again the notation of Eq. (409) is implied. We used the fact that all outgoing diffusons have zero transverse momentum. Therefore all -terms are absent. In case of an incoming plane wave we find a contribution to the third cumulant . The contribution from the source term, i.e. Eq.(472) of the previous subsection, exactly cancels the contribution from the six-point vertex. The cancellation seems plausible as one does not expect short distances properties to be important in the total process. Nevertheless, this cancellation depends on the precise form of the Hikami four-point vertex in Eq.(470). If we use other equivalent forms of the Hikami box the contributions of the single and double integral in Eq.(476) shift with respect to each other and a full cancellation is not present. Of course, neither the result for Eq.(476) nor the final result for relies on this choice. One obtains for the third cumulant
| (480) | |||||
| (482) | |||||
C Influence of incoming beam profile
Now that we know the leading interference processes, inserting the diffusons gives the final value of the third cumulant. We first consider the simple case of incoming plane waves. As there can be no transverse momentum difference in the incoming amplitudes, all vanish. As a result all diffusons are linear functions of . We find from Eq. (482)
| (483) |
In practice, however, one often deals with a Gaussian beam with limited spot size, influencing the cumulants in two ways. First, if the spot size decreases to values comparable to the sample thickness we have to convolute over a range of incoming momenta, just like we did when calculating the second cumulant. Second, the Gaussian profile brings an extra geometrical factor as will be shown below. The expression for the diagrams with diffusons with arbitrary momentum is calculated as follows. Because of momentum conservation and phase condition on the outgoing diffusons, the transverse momentum of the diffuson connecting the two four-boxes must equal . The integration over the possible momenta results again in a Gaussian weight function . The third cumulant is obtained by inserting the momentum dependent diffusons into Eq.(482). This gives
| (484) |
with
| (489) | |||||
We study again the behavior if the beam diameters are wide. In the limit of large beam diameter () one finds , this means for the third cumulant , or
| (490) |
which differs by a factor from the plane wave limit Eq.(483). This is a geometrical effect, depending on the profile of the incoming beam. In a real space picture one understands this effect easiest: The correlation depends on the distance, it is strongest if the incoming beams are close together. Therefore it is not surprising to see the influence of their overlap. In next section we calculate this geometrical factor also for higher cumulants. For the experimental relevant case that the beam diameter is roughly equal to the thickness, it turns out that the behavior of Eq.(490) is found for a large range of beam diameters. The increase of the correlation for smaller beams turns out to be roughly the same for both the third cumulant and the second cumulant squared.
In ?) theory was extensively compared with the experiment reported in [t3prl]. Apart from the correction for the finite beam diameter, as discussed above, two other experimental corrections were included: Internal reflections and contributions from disconnected diagrams. All corrections to (490) turn out to be relatively small. By presenting the results as the ratio between the second cumulant squared and the third cumulant, errors in the sample thickness and the mean free path cancel. For the experimental data it was found that , in good agreement with Eq. (490).
?) performed microwave scattering on systems with values of approaching unity. In that case the plane wave prediction applies. They found , indeed in good agreement with Eq. (483).
The extension of the calculation to higher cumulants is straightforward. The -th cumulant will contain Hikami four-point vertices. So the contribution is . But it is clear that the calculation becomes laborious at large . We follow another approach to this problem in Sec. XVIII.
D Third cumulant of the conductance
The reader will not be surprised to learn that the third cumulant of the conductance can also be calculated using a diagrammatic approach [g3]. This third cumulant has the particular behavior that it vanishes in one dimension[macedo]. We already saw that in the mesoscopic regime the conductance shows universal fluctuations (UCF). The conductance being a random variable showing large fluctuations, one should consider its full distribution. It was soon clear that the first higher cumulants of the conductance are proportional to [altshuler3]
| (491) |
Here is the mean conductance at the scale . In the metallic regime far from localization, where , the higher cumulants are probably small, and the distribution of the conductance is roughly Gaussian. However, for the decrease in magnitude of cumulants as described by Eq. (491) is changed into a very rapid increase (). This leads to log-normal tails of the distribution [altshuler3]. With increasing disorder, the log-normal tails become more important. The full conductance distribution at the threshold of localization () is at present unknown, yet it is quite plausible that the whole distribution crosses over to a log-normal shape in the strongly localized regime (see Refs. [shapiro2] and [altshulerboek] for a discussion). Indeed, it is well known that in the strongly localized regime in one dimension the conductance is given by the product of transmission amplitudes, yielding a log-normal distribution [anderson2, abrikosov2, melnikov, economou2].
Although higher order cumulants govern the tails of the distribution, they do not affect it near the center. A deviation from the Gaussian distribution near the center is revealed, first of all, in the lowest nontrivial cumulants. An important step in this direction was the calculation of the third cumulant of the distribution using random matrix theory by ?). He found for the orthogonal () and symplectic ensemble () that the third cumulant of the conductance is proportional to , thus the leading term given by Eq. (491) vanishes (see for instance [metha] for the definitions of the ensembles). For the unitary ensemble () even this sub-leading term vanishes, and the behavior is [macedo]. The physical reason behind this is not clear. (We recently learned that the same result in quasi one dimension was found ?) by the scaling method described in [tartakovski].) However, random matrix theory is only valid in quasi one dimensional systems. Therefore, it was not known whether such a cancellation also occurs in higher dimensions. If this is indeed the case, this might indicate an overlooked symmetry of the system. That this might be the case is also suggested by the fact that the leading order contribution to the third cumulant of the density of states vanishes in two dimensions [altshuler3]. The question we thus wish to consider is whether or not a cancellation occurs for the third cumulant of the conductance in two and three dimensions.
We rewrite Eq.(491) into a relation for the relative cumulants: . The inverse powers of on the right hand side can be interpreted as the number of Hikami four-boxes in the diagrams. Thus the third cumulant diagram contains four Hikami four-boxes. Indeed, it proves impossible to draw diagrams with three boxes. Diagrams with more boxes are sub-leading as they are of higher power in . The diagrams are represented in Fig. 28. In the figure there are diagrams of the same order with one six-box and two four-boxes. They can be obtained by contracting one diffuson in the diagrams with four-boxes. In physical terms the six-box diagrams correspond to processes where after an interference process, the amplitudes do not combine into a diffuson. Instead, the amplitudes interact again directly without being scattered.
The diagrams were evaluated using a Kubo approach, the advantage being that no divergences emerge; treatment of absorption is difficult though, as indicated in the discussion on . The evaluation of the diagrams is a painful but straightforward exercise. The diagrams have two or three free momentum loops, of which one is eliminated due to momentum conservation. In one dimension, where the diffusons are simple linear functions, the diagrams can be evaluated analytically. Numerical evaluation of the integrals in and yield
| (492) | |||||
| (493) | |||||
| (494) |
Thus the leading contribution to the third cumulant in one dimension vanishes. This confirms the random matrix theory result [macedo] diagrammatically. It is seen that there is no cancellation in higher dimensions. The results for rectangular samples are given in Fig. 29, where we multiplied the third cumulant by the average of the dimensionless conductance. The third cumulant for wide slabs () is proportional to . In the figure, due to the multiplication by , there is proportionality to for wide slabs. Note that the third cumulant passes through zero when going from 2D to 3D at a sample size of . For very narrow slabs the correct quasi 2D limit is recovered.
The random matrix result that the third cumulant vanishes in one dimensions is thus also found in the diagrammatic approach. In two and three dimensions, however, the cancellation is not present; the leading contribution to the third cumulant is negative in two dimensions and positive in three dimensions. The fact that the third cumulant changes sign is surprising. The third cumulant is also known as the skewness of a distribution. In analogy with the third cumulant of the total transmission, or if the distribution would be tending to log-normal, one would have expected a positive third cumulant of the conductance. Instead, we find that all possible values occur: negative, positive and zero. Experiments measuring the conductance distribution could enlighten this point.
XVIII Full distribution functions
In this section we calculate the full distribution of the total transmission and the angular resolved transmission; both can be mapped on the eigenvalue distribution of the transmission matrix. Before we discuss the distribution in the mesoscopic regime, let us first discuss the ’classical’ situation, which is the limit of large . The correlations between intensities are now absent. Here the angular resolved transmission, or speckle intensity, is distributed according to the Raleigh’s law [goodmanboek],
| (495) |
Anyone who ever saw a laser speckle pattern on the wall will remember the wild pattern with both bright and dark spots. This is due to the Rayleigh’s law. Rayleigh’s law can be derived in the context of the ladder diagrams [shapiro]. The th moment of the speckle intensities is made up of amplitudes and complex conjugated amplitudes. As stated before, there is no restriction on the pairing of two amplitudes into a diffuson for this type of measurement. Therefore the amplitudes have possibilities to pair with the amplitudes . Thus
| (496) |
which corresponds with Rayleigh’s law. Yet, as we know from the example of a laser beam reflecting from a rough wall, multiple scattering is not essential for Rayleigh’s law. Indeed, Rayleigh’s original derivation goes as follows [goodmanboek]: The field at a given position on the outgoing side is the sum of many fields, and therefore the real and imaginary part each have a independent Gaussian distribution. The intensity is the amplitude squared and has thus an exponential distribution
| (497) |
Thus reflection from a rough wall will also do.
?) addressed the question of the speckle statistics of (optically) very thin samples. In optically very thin samples a considerable part of the light does not scatter at all, but is transmitted coherently. In the limit of zero thickness, i.e. only coherent light, the distribution becomes a delta-function. In the intermediate regime a simple counting argument yields the distribution, which interpolates between the delta distribution and Rayleigh’s law. In the opposite case of strong scattering, the mesoscopic regime, interferences modify the speckle distribution. The leading correction was derived by ?). Genack and Garcia observed a deviation from Rayleigh’s law at large intensities [genack2, garcia2]. A crossover to stretched exponential behavior was derived by ?).
For the total transmission and the conductance the distributions are similar in the large limit. For both quantities the outgoing diffusons are frequency and momentum independent as we explained in Sec. XV. As there is no interaction between the diffusons in this limit, only one type of pairing is possible for both quantities. This yields in principle a delta-distribution if one probes an infinite number of channels. In practice of course only a limited number of channels is probed, and the law of large numbers predicts a narrow Gaussian distribution.
A Eigenvalues of the transmission matrix
In mesoscopic systems the observables are random quantities and are therefore not always characterized by their mean values, but their entire distribution function is of interest. This is particularly prominent in the distribution of eigenvalues of the transmission matrix. Assuming that all eigenvalues contribute equally to the conductance, one expects a Gaussian distribution. As there are eigenmodes, the eigenvalue distribution should be peaked around . But this picture proves wrong, as was first put forward by ?) and later also by ?). Not the eigenvalues but the inverse localization lengths are uniformly distributed, see ?) and ?). As a result the eigenvalues have a “bimodal” distribution peaked around 0 and 1. The eigenvalues of the transmission matrix can be expressed as
| (498) |
implying that
| (499) |
This distribution is plotted in Fig.30. The first derivations of the distribution used random matrix theory and were therefore valid in quasi-1D only [mello2]. However, ?) showed that it is not only true in quasi-1D, but under very general conditions. Note that the normalization of the distribution is ill-defined, the distribution should be understood in the sense that all its moments are defined. This problem can be avoided by adjusting the lower boundary of the integral instead of 0. The minimal value corresponds to the decay of unscattered intensity, therefore , normalizing the distribution Eq. (499). Although this cutoff is important for the normalization of the distribution, its influence on the momenta is very small and we refrain from it. The distribution Eq. (499) is valid only in the regime where is not too small. Loop effects near the Anderson transition, where , will change it, as we will discuss below.
The concept of open and closed channels explains the physical meaning of this curious distribution function. An eigenmode of the transmission matrix is, according to this distribution, either essentially blocked or, with a much smaller probability, essentially conducting. This picture was confirmed in various computer simulations [pendry, pendry2, oakeshott]. The eigenvalue distribution also provides us with a nice picture explaining why the correlations in mesoscopic systems are so large. If all the channels are equally conducting, fluctuations of the channels average out by the law of large numbers. Yet if only a few channels are conducting, fluctuations in one channel will be clearly seen. Using these concepts the probability distribution of the total transmission and deviations from Rayleigh’s law will be explained below.
We should point out that for the UCF the same argument goes wrong. The variance in the conductance is caused by the finiteness of the number of channels . In the picture of either closed or open channels the number of open channels equal roughly . The conductance would thus fluctuate according the law of large numbers with a variance: . However, this is incorrect as we know that , see Sec. XVI D. For the UCF the interaction between the eigenmodes is essential.
In practice it is difficult, if not impossible, to measure the eigenmodes and eigenvalues directly. As they are the eigenmodes of the very large random transmission matrix, they have a very complex structure. Nevertheless, the eigenvalue distribution has observable consequences. It was shown by ?) that the shot noise of electronic conductors universally reduces by a factor 3 because of this distribution. Shot noise only occurs in electronic systems and is thus not of much interest for us. Instead, we will show that the total transmission and speckle intensity distribution function are related to the eigenvalue distribution function.
B Distribution of total transmission
We first calculate the probability distribution of the total transmission. From the distribution without interference effects we saw that it has a simpler distribution (in the sense of cumulants) than the speckle distribution. We neglect corrections as absorption, skin layers, and disconnected diagrams. Consider again an incoming plane wave in direction ( denotes again the cosine with respect to the axis). The wave is transmitted into outgoing channel with transmission amplitude and transmission probability . The speckle and total transmission factorize as and .
We consider the cumulant of . In a diagrammatic approach this object has transmission amplitudes and an equal number of Hermitian conjugates . The explicit calculation of the second cumulant (Sec. XV), and third cumulant (section XVII) showed that the leading diagrams are connected and have no loops.
Let us fix the external diffusons in the term . Contributions to the sum over only come from diagrams with outgoing diffusons that have no transverse momentum. These are the diagrams where the lines with equal pair into diffusons. We indicate this pairing of the outgoing diffusons with brackets
| (500) |
The outgoing diffusons are now fixed. At the incoming side it is convenient to keep for instance the ’s fixed, while the ’s are permuted among them. This leaves possibilities for the incoming side in total, but of these only permutations correspond to connected diagrams (these diagrams contain Hikami boxes. The diagram contained one box, the third cumulant diagram two boxes). Next we factor out the incoming and outgoing diffusons and group the remainder of the diagrams into a skeleton . Making use of Eq. (417) we obtain:
| (502) | |||||
The integral just describes
| (503) | |||||
| (504) |
There is only one way to attach incoming and outgoing diffusons to . The sums over the indices lead exactly to the total flux diffusons in Eq. (502). One finds the following important relation between the moments of the eigenvalue distribution and the connected total transmission diagrams
| (505) |
Normalizing with respect to the average, we introduce . The generating function of the connected diagrams is easily calculated
| (506) | |||||
| (507) |
Since the cumulants are solely given by connected diagrams, the distribution of follows as [probprl]
| (508) |
Let us examine some properties of the distribution. For limiting values of we use a saddle point analysis. The saddle point is found by the condition . Thus we find
| (509) |
The r.h.s. of Eq.(509) diverges if approaches (from above) and decreases monotonically for larger . Thus for large , we find the saddle point near . By inserting the saddle point one finds a simple exponential tail
| (510) |
The saddle point also dominates the shape for small (and large ). One finds essentially a log-normal growth:
| (511) |
In Fig. 31 the full curves depict the distribution Eq. (508) for some values of . At moderate we clearly see the deviation from a Gaussian. In interesting, recent experiments on quasi 1D microwave scattering, ?) measured the total transmission distribution for conductances as low as . Although one would expect important loop contributions for such low values of , excellent agreement with the above prediction is found. To obtain the fit, the value of had to be extracted from the variance of the distribution rather than from the measured conductance. This adjustment is probably necessary because of the strong absorption occurring in waveguides. The effect of absorption was calculated by ?) for a waveguide. For strong absorption the total transmission has a log-normal distribution, while the ratio of becomes 3.0 instead of 2.4.
C Influence of beam profile
Above we have considered the case of an incoming plane wave. Again in optical systems a Gaussian intensity profile is more realistic. For the third cumulant we saw a nontrivial dependence on the incoming beam profile, suggesting that also higher cumulants are sensitive to this effect. For perpendicular incidence the incoming amplitude is , where is the plane wave of Eq. (173), and where
| (512) |
We consider the limit where the beam is much broader than the sample thickness () but still much smaller than the transverse size of the slab (). With a smaller beam diameter, the incoming transverse momenta, which are of order , are of the order of . The diffusons will then become the well-known functions, Sec. XVI A. Here the momentum dependence of the diffusons can be neglected; apart from a geometrical factor, the diffusons are identical to the plane wave case. Due to the integration over the center of gravity, each diagram involves a factor . In the order term there occurs a factor
| (513) | |||||
| (514) |
For a plane wave we have , and . For our Gaussian beam we obtain
| (515) |
It is thus convenient to identify with the effective area of a Gaussian beam. (This definition is different from the one used in previous sections, were ). As compared to the plane wave case, the order term is smaller by a factor for a Gaussian profile. This implies for the generating function of the connected diagrams
| (516) |
For small (and large ), there is again a log-normal saddle point. For large , the dominant shape of the decay is given by the singularity at and again yields . The shape of the distribution is quite similar to the plane wave case. Expanding the generating function we recover the results for the second and third cumulant obtained in Secs. XV and XVII.
D Speckle intensity distribution
We apply the same method to obtain the distribution of the angular transmission coefficient. The angular and total transmission distributions can be related to each other in a fairly simple way, because the interference processes are dominated by the same type of diagrams: the loopless connected diagrams. The different distribution for total transmission and speckle is the consequence of a counting argument only. In the plane wave situation the average angular transmission reads . Let us count the number of connected loopless diagrams that contribute to . Now not only massless outgoing diffusons, but all pairings into outgoing diffusons contribute. This yields an extra combinatorial factor in the moment:
| (517) |
For the normalized angular transmission coefficient , we define the generating function of the connected diagrams as [probprl]
| (518) |
with given by Eq. (507) for plane wave incidence and by Eq. (516) for a broad Gaussian beam, respectively. In contrast to the total transmission distribution, the cumulants are not only given by the connected diagrams. ?) showed that the extra summation of the disconnected diagrams corresponds to an additional integral, which finally yields a Bessel function:
| (519) |
The integral can be evaluated numerically. The speckle intensity distribution is shown in Fig. 32 for an incoming plane wave.
For large and moderate , one has and we recover Rayleigh’s law: . The leading correction is found by expanding in
| (520) |
A similar equation was derived previously by ?).
For obtaining the tail of the distribution, one can again apply steepest descent, which yields
| (521) |
This stretched exponential tail of the distribution was also seen in experiments. Already in 1989 Garcia and Genack observed it in microwave experiments. But unfortunately their dynamic range was rather small. The fit of stretched exponential is therefore rather unprecise. The maximum intensity was 5 times the average where one does not expect to see the tail behavior, rather one observes a cross-over behavior. Using Eq. (516) one easily derives the speckle distribution due to an incoming beam with Gaussian profile; it leads to a different distribution with the same asymptotic behavior.
E Joint distribution
It turns out that the speckle distribution and the total transmission distribution of a certain incoming direction are related. This is not surprising as a large total transmission for a given incoming direction will also be reflected in the individual speckles. The moments of the joint distribution are
| (522) |
The combinatorial factor is for the speckle pattern, the factor is the number of possible pairings of incoming beam. Defining as , one obtains with . Thus . This shows that and are independent variables. Nevertheless, and are dependent. Their joint distribution is
| (523) |
Integration over or yields again the distribution , or , respectively. This is somewhat surprising. Indeed, as the right hand side of Eq. (523) contains only connected diagrams, the same holds thus for the left hand side. This seems to contradict our earlier remark that contained both connected and disconnected diagrams. However, in deriving Eq. (523) we have tacitly performed analytic continuation for negative values. By performing the integration over we find the correct expression for .
In conclusion we derived the full distribution function of both total transmission and angular transmission coefficient by mapping it to the distribution of eigenvalues of . But at least for the lowest cumulants one can use this mapping the other way around. First, experiments on the distribution functions thus confirm the eigenvalue distribution. Secondly, from our detailed evaluation of the low order diagrams, i.e. the second and third cumulant, insight in the eigenvalue distribution can be obtained. It is clear from those calculations that also the eigenvalue distribution is based on loopless connected diagrams.
The effect of absorption has been neglected here. Our explicit calculation of second and third cumulants and the experimental data show that the effects of absorption and skin layers can be incorporated to a large extent by considering the normalized cumulants, such as . Indeed, also in the presence of strong absorption it was seen that these dimensionless ratios are similar to the values calculated without absorption [stoytchev]. A theoretical analysis of absorption effects was carried out by ?).
The distribution of the conductance cannot be calculated using the above technique. The correlations in the conductance correspond to correlations in the eigenvalues. These correlations were not included, as we only used the distribution of a single eigenvalue, and not the joint distribution of multiple eigenvalues.
ACKNOWLEDGMENTS
We have been stimulated by the continuous interest in our work of A. Z. Genack, H. C. van de Hulst, I. V. Lerner, J. M. Luck, and G. Maret. We gained many insights from discussion and collaboration with our co-workers on this subject: E. Amic, M. P. van Albada, B. L. Altshuler, J.F. de Boer, A. L. Burin, Zh.S. Gevorkian, E. Hofstetter, Yu. M. Kagan, A. Lagendijk, D. J. Lancaster, I. V. Lerner, J. M. Luck, R. Maynard, A. Mosk, P. N. den Outer, M. Schreiber, G. V. Shlyapnikov, B. A. van Tiggelen, and R. Vlaming.
Further we like to thank: C. W. J. Beenakker, P.W. Brouwer, the late S. Feng, J. J. M. Franse, N. N. Garcia, E. Kogan, Yu. Nazarov, M. Nieto-Vesperinas, I. Ya. Polishchuk, J. Ricka, J. J. Saens, R. Sprik, M. Stoytchev, A. Tip, P. de Vries, and G. H. Wegdam.
This research was supported by the EEC HCM-Network ERBCHRXCT930373 and by NATO (grant nr. CRG 921399).
A Loop integrals
The same loop momentum integrals recur often in the diagram calculations:
| (A1) |
where . For the simplest integral, we find
| (A2) |
where . The sum of the residues yields , and without absorption the optical theorem gives
| (A3) |
Therefore
| (A4) |
The general integral can be found from the integral using
| (A5) |
For example, and . We shall also use
| (A6) |
where the factor comes from the angular integral. If absorption is present , thus
| (A7) |
In general there is a prefactor
| (A8) |
where we have assumed that . However, this prefactor needs only to be included for terms not proportional to or , as we work to first order of .
REFERENCES
- [1]
- [2] [] Abrahams, E., P. W. Anderson, D. C. Licciardello, and T. V. Ramakrishnan, 1979, Phys. Rev. Lett. 42, 673.
- [3]
- [4] [] Abrikosov, A. A., 1981, Solid State Commun. 37, 997.
- [5]
- [6] [] Abrikosov, A. A., L. P. Gor’kov, and I. E. Dzyaloshinski, 1963, Methods of quantum field theory in statistical physics (Dover, New York).
- [7]
- [8] [] Altshuler, B. L., 1985, JETP Lett. 41, 648. Pis’ma Zh. Eksp. Teor. Fiz. 41, 530 (1985).
- [9]
- [10] [] Altshuler, B. L., A. G. Aronov, and B. Z. Spivak, 1981, JETP Lett. 33, 94. Pis’ma Zh. Eksp. Teor. Fiz. 33,101 (1981).
- [11]
- [12] [] Altshuler, B. L., P. A. Lee, and R. A. Webb, 1991, Eds., Mesoscopic phenomena in solids, Vol. 30 of Modern problems in condensed matter sciences (North-Holland, Amsterdam).
- [13]
- [14] [] Altshuler, B. L., V. E. Kravtsov, and I. V. Lerner, 1986, Sov. Phys. JETP 64, 1352. Zh. Eksp. Teor. Fiz. 91, 2276 (1986).
- [15]
- [16] [] Altshuler, B. L., V. E. Kravtsov, and I. V. Lerner, 1991, in Mesoscopic phenomena in solids, edited by B. L. Altshuler, P. A. Lee, and R. A. Webb, Vol. 30 of Modern problems in condensed matter sciences (North-Holland, Amsterdam), p. 449.
- [17]
- [18] [] Amic, E., J. M. Luck, and T. M. Nieuwenhuizen, 1996, J. Phys. A 29, 4915.
- [19]
- [20] [] Amic, E., J. M. Luck, and T. M. Nieuwenhuizen, 1997, J. Phys. I 7, 445.
- [21]
- [22] [] Anderson, P. W., 1958, Phys. Rev. 109, 1492.
- [23]
- [24] [] Anderson, P. W., D. J. Thouless, E. Abrahams, and D. S. Fisher, 1980, Phys. Rev. B 22, 3519.
- [25]
- [26] [] Ando, T., and H. Fukuyama, 1988, Eds., Anderson Localization, Vol. 28 of Springer proceedings in physics (Springer-Verlag, Berlin).
- [27]
- [28] [] Barabanenkov, Y. N., 1973, Izv. Vysch. Uch. Zav.-Radiofiz. 16, 88.
- [29]
- [30] [] Beenakker, C. W. J., and M. Büttiker, 1992, Phys. Rev. B 46, 1889.
- [31]
- [32] [] Beenakker, C. W. J., 1997, Rev. Mod. Phys. 69, 731.
- [33]
- [34] [] Berkovits, R., 1990, Phys. Rev. B 42, 10750.
- [35]
- [36] [] Berkovits, R., and M. Kaveh, 1990, Europhys. Lett. 13, 97.
- [37]
- [38] [] Berkovits, R., and S. Feng, 1994, Phys. Rep. 238, 135.
- [39]
- [40] [] Brouwer, P. W., 1997. Phys. Rev B, to appear, available electronically on http://xxx.lanl.gov, cond-mat 9711113.
- [41]
- [42] [] Chandrasekhar, S., 1960, Radiative Transfer (Dover, New York).
- [43]
- [44] [] de Boer, J. F., M. C. W. van Rossum, M. P. van Albada, T. M. Nieuwenhuizen, and A. Lagendijk, 1994, Phys. Rev. Lett. 73, 2567.
- [45]
- [46] [] de Boer, J. F., M. P. van Albada, and A. Lagendijk, 1992, Phys. Rev. B 45, 658.
- [47]
- [48] [] den Outer, P. N., and A. Lagendijk, 1993, Opt. Commun. 103, 169.
- [49]
- [50] [] den Outer, P. N., T. M. Nieuwenhuizen, and A. Lagendijk, 1993, J. Opt. Soc. Am. A 10, 1209.
- [51]
- [52] [] Dorokhov, O. N., 1984, Solid State Commun. 51, 381.
- [53]
- [54] [] Economou, E. N., 1990, Green’s functions in quantum physics (Spinger, Berlin).
- [55]
- [56] [] Economou, E. N., and C. M. Soukoulis, 1981, Phys. Rev. Lett. 46, 618.
- [57]
- [58] [] Efetov, K. N., 1983, Adv. in Phys. 32, 53.
- [59]
- [60] [] Feng, S., C. Kane, P. Lee, and A. D. Stone, 1988, Phys. Rev. Lett. 61, 834.
- [61]
- [62] [] Feng, S., F.A. Zeng, and B. Chance, Appl. Opt. 34, 3826
- [63]
- [64] [] Zhu, X.D., S.P. Wei, S. Feng, and B. Chance, J. Opt. Soc. Am. A 13, 494.
- [65]
- [66] [] Fisher, D. S., and P. A. Lee, 1981, Phys. Rev. B 23, 6851.
- [67]
- [68] [] Freund, I., and M. Rosenbluh, 1991, Opt. Commun. 82, 362.
- [69]
- [70] [] Freund, I., and R. Berkovits, 1990, Phys. Rev. B 41, 496.
- [71]
- [72] [] Freund, I., M. Rosenbluh, and S. Feng, 1988, Phys. Rev. Lett. 61, 2328.
- [73]
- [74] [] Garcia, N., A. Z. Genack, R. Pnini, and B. Shapiro, 1993, Phys. Lett. A 176, 458.
- [75]
- [76] [] Garcia, N., and A. Z. Genack, 1989, Phys. Rev. Lett. 63, 1678.
- [77]
- [78] [] Genack, A. Z., and N. Garcia, 1993, Europhys. Lett. 21, 753.
- [79]
- [80] [] Genack, A. Z., N. Garcia, and W. Polkosnik, 1990, Phys. Rev. Lett. 65, 2129.
- [81]
- [82] [] Gevorkian, Zh.S., Phys. Rev. E 57 , 57
- [83]
- [84] [] Gevorkian, Zh.S., and Th.M. Nieuwenhuizen, Phys. Rev. E, submitted
- [85]
- [86] [] Goodman, J. W., 1975, in Laser speckle and related phenomena, edited by J. C. Dainty, Vol. 9 (Springer, Berlin), p. 9.
- [87]
- [88] [] Gor’kov, L. P., A. I. Larkin, and D. E. Khmel’nitskii, 1979, JETP Lett. 30, 228. Pis’ma Zh. Eksp. Teor. Fiz. 30, 248 (1979).
- [89]
- [90] [] Gorodnichev, E., S. Dudarev, and D. Rogozkin, 1990, Phys. Lett. A 144, 48.
- [91]
- [92] [] Guéret, P., C. Rossel, E. Marclay, and H. Meier, 1989, J. Appl. Phys. 66, 278.
- [93]
- [94] [] Halperin, B. I., 1965, Phys. Rev. A 139, 104.
- [95]
- [96] [] Hanke, W., and Y. V. Kopaev, 1992, Eds., Electronic phase transitions, Vol. 32 of Modern problems in condensed matter sciences (North-Holland, Amsterdam).
- [97]
- [98] [] Hikami, S., 1981, Phys. Rev. B 24, 2671.
- [99]
- [100] [] Imry, Y., 1986, Europhys. Lett. 1, 249.
- [101]
- [102] [] Ioffe, A. F., and A. R. Regel, 1960, Prog. Semicond. 4, 237.
- [103]
- [104] [] Ishimaru, A., 1978, Wave propagation and scattering in random media, Vols. 1 and 2 (Academic, New York).
- [105]
- [106] [] Janßen, M., 1991, Solid State Commun. 79, 1073.
- [107]
- [108] [] Kagiwada, H. H., R. Kalaba, and S. Ueno, 1975, Multiple scattering processes: inverse and direct, Vol. 8 of Applied mathematics and computation (Addison-Wesley, Reading Massachusetts).
- [109]
- [110] [] Kane, C. L., R. A. Serota, and P. A. Lee, 1988, Phys. Rev. B 37, 6701.
- [111]
- [112] [] Kaveh, M., 1991, in Analogies in Optics and Micro-Electronics, edited by W. van Haeringen, and D. Lenstra (Kluwer Academic, Haarlem).
- [113]
- [114] [] Kirkpatrick, T. R., 1985, Phys. Rev. B 31, 5746.
- [115]
- [116] [] Kogan, E., and M. Kaveh, 1995, Phys. Rev. B 51, 16400.
- [117]
- [118] [] Kogan, E., M. Kaveh, R. Baumgartner, and R. Berkovits, 1993, Phys. Rev. B 48, 9404.
- [119]
- [120] [] Kramer, B., and G. Schön, 1990, Eds., Anderson transition and mesoscopic fluctuations, Vol. 167 of Physica A (North Holland, Amsterdam). Special issue of Physica A.
- [121]
- [122] [] Kroha, J., 1990, Physica A 167, 231.
- [123]
- [124] [] Kroha, J., T. Kopp, and P. Wölfe, 1990, Phys. Rev. B 41, 888.
- [125]
- [126] [] Kuga, Y., and A. Ishimaru, 1985, J. Opt. Soc. Am. A 1, 831.
- [127]
- [128] [] Lagendijk, A., and B. A. van Tiggelen, 1996, Phys. Rep. 270, 143.
- [129]
- [130] [] Lagendijk, A., R. Vreeker, and P. de Vries, 1989, Phys. Lett. A 136, 81.
- [131]
- [132] [] Lancaster, D., and T. M. Nieuwenhuizen, 1998. to appear in Physica A.
- [133]
- [134] [] Landauer, R., 1975, Z. Phys. B 21, 247.
- [135]
- [136] [] Lee, P. A., A. D. Stone, and H. Fukuyama, 1987, Phys. Rev. B 35, 1039.
- [137]
- [138] [] Lee, P. A., and A. D. Stone, 1985, Phys. Rev. Lett. 55, 1622.
- [139]
- [140] [] Lee, P. A., and T. V. Ramakrishnan, 1985, Rev. Mod. Phys. 57, 291.
- [141]
- [142] [] Lerner, I. V., 1996. private communication.
- [143]
- [144] [] Lisyansky, A. A., and D. Livdan, 1992, Phys. Lett. A 170, 53.
- [145]
- [146] [] Luck, J. M., 1997, unpublished.
- [147]
- [148] [] Luck, J. M., and T. M. Nieuwenhuizen, 1998. submitted to Phys.Rev.E.
- [149]
- [150] [] Macêdo, A. M. S., 1994, Phys. Rev. B 49, 1858.
- [151]
- [152] [] MacKintosh, F., and S. John, 1988, Phys. Rev. B 37, 1884.
- [153]
- [154] [] MacKintosh, F., and S. John, 1989, Phys. Rev. B 40, 2383.
- [155]
- [156] [] Mehta, M. L., 1967, Random matrices and the statistical theory of energy levels (Academic Press, New York).
- [157]
- [158] [] Mello, P. A., P. Pereyra, and N. Kumar, 1988, Ann. Phys. 181, 290.
- [159]
- [160] [] Mel’nikov, V. I., 1981, Sov. Phys. Solid State 23, 444.
- [161]
- [162] [] Merzbacher, E., 1970, Quantum Mechanics (J. Wiley, New York).
- [163]
- [164] [] Mie, G., 1908, Ann. Phys. 25, 377.
- [165]
- [166] [] Mosk, A., T. M. Nieuwenhuizen, and C. Barnes, 1996, Phys. Rev. B 53, 15914.
- [167]
- [168] [] Mott, N. F., 1990, Metal-Insulator transitions (Taylor and Francis, London).
- [169]
- [170] [] Nagaoka, Y., and H. Fukuyama, 1982, Eds., Anderson localization, Vol. 8 of Solid state sciences (Springer, Berlin).
- [171]
- [172] [] Nazarov, Y. V., 1994, Phys. Rev. Lett. 73, 134.
- [173]
- [174] [] Nieuwenhuizen, T. M., 1983, Physica A 120, 197.
- [175]
- [176] [] Nieuwenhuizen, T. M., 1984, Physica A 125, 468.
- [177]
- [178] [] Nieuwenhuizen, T. M., 1993, Europhys. Lett. 24, 269.
- [179]
- [180] [] Nieuwenhuizen, T. M., 1993, unpublished
- [181]
- [182] [] Nieuwenhuizen, T. M., A. L. Burin, Y. Kagan, and G. V. Shlyapnikov, 1994, Phys. Lett. A 184, 360.
- [183]
- [184] [] Nieuwenhuizen, T. M., and J. M. Luck, 1993, Phys. Rev. E 48, 560.
- [185]
- [186] [] Nieuwenhuizen, T. M., and M. C. W. van Rossum, 1995, Phys. Rev. Lett. 74, 2674.
- [187]
- [188] [] Oakeshott, R. B. S., and A. MacKinnon, 1994, J. Phys.: Condens Matter 6, 1513.
- [189]
- [190] [] Ospeck, M., and S. Fraden, 1994, Phys. Rev. E 49, 4578.
- [191]
- [192] [] Paasschens, J.C.J. and G.W. ’t Hooft, submitted to J. Opt. Soc. Am.
- [193]
- [194] [] Pendry, J. B., A. MacKinnon, and A. B. Pretre, 1990, Physica A 168, 400.
- [195]
- [196] [] Pendry, J. B., A. MacKinnon, and P. J. Roberts, 1992, Proc. R. Soc. London Ser. A 437, 67.
- [197]
- [198] [] Peters, K., 1992, Phys. Rev. B 46, 801.
- [199]
- [200] [] Pnini, R., and B. Shapiro, 1989, Phys. Rev. B 39, 6986.
- [201]
- [202] [] Pnini, R., and B. Shapiro, 1991, Phys. Lett. A 157, 265.
- [203]
- [204] [] Polishchuk, I., A. L. Burin, and L. A. Maksimov, 1990, JETP Lett. 51, 731. Pis’ma Zh. Eksp. Teor. Fiz. 51, 644 (1990).
- [205]
- [206] [] Rayleigh, J. W. S., 1880, Phil. Mag. 1 p. 491. ( in Scientific papers I, p.53 (1964) Dover, New York).
- [207]
- [208] [] Rikken, G.L.J.A. and B.A. van Tiggelen, 1996, Nature 381, 54.
- [209]
- [210] [] Schotland, J.C. and J.C. Haselgrove, and J.S. Leigh, Appl. Opt. 32, 448
- [211]
- [212] [] Shapiro, B., 1986, Phys. Rev. Lett. 57, 2168.
- [213]
- [214] [] Shapiro, B., 1990, Phys. Rev. Lett. 65, 1510.
- [215]
- [216] [] Sharvin, Y., and Y. Sharvin, 1981, JETP Lett. 34, 272. Pis’ma Zh. Eksp. Teor. Fiz. 34, 285 (1981).
- [217]
- [218] [] Sheng, P., 1990, Eds., Classical Wave Localization (World Scientific, Singapore).
- [219]
- [220] [] Shnerb, N., and M. Kaveh, 1991, Phys. Rev. B 43, 1279.
- [221]
- [222] [] Soukoulis, C. M., 1993, Eds., Photonic band gaps and localization (Plenum Press, New York).
- [223]
- [224] [] Stephen, M. J., and G. Cwilich, 1987, Phys. Rev. Lett. 59, 285.
- [225]
- [226] [] Stone, A. D., P. A. Mello, K. A. Muttalib, and J.-L. Pichard, 1991, in Mesoscopic phenomena in solids, edited by B. L. Altshuler, P. A. Lee, and R. A. Webb, Vol. 30 (North-Holland, Amsterdam), p. 369.
- [227]
- [228] [] Stoytchev, M., and A. Z. Genack, 1997, Phys. Rev. Lett. 79, 309.
- [229]
- [230] [] Tartakovski, A. V., 1995, Phys. Rev. B 52, 2704.
- [231]
- [232] [] Tartakovski, A. V., 1996. private communication.
- [233]
- [234] [] Thouless, D. J., 1974, Phys. Rep. 13, 93.
- [235]
- [236] [] Thouless, D. J., 1977, Phys. Rev. Lett. 39, 1167.
- [237]
- [238] [] Umbach, C. P., S. Washburn, R. B. Laibowitz, and R. A. Webb, 1984, Phys. Rev. B 30, 4048.
- [239]
- [240] [] van Albada, M. P., and A. Lagendijk, 1985, Phys. Rev. Lett. 55, 2692.
- [241]
- [242] [] van Albada, M. P., B. A. van Tiggelen, A. Lagendijk, and A. Tip, 1991, Phys. Rev. Lett. 66, 3132.
- [243]
- [244] [] van Albada, M. P., J. F. de Boer, and A. Lagendijk, 1990, Phys. Rev. Lett. 64, 2787.
- [245]
- [246] [] van de Hulst, H. C., 1980, Multiple Light Scattering, Vols. 1 and 2 (Academic, New York).
- [247]
- [248] [] van de Hulst, H. C., 1997. private communication.
- [249]
- [250] [] van de Hulst, H. C., and R. Stark, 1990, Astron. Astrophys. 235, 511.
- [251]
- [252] [] van der Mark, M. B., M. P. van Albada, and A. Lagendijk, 1988, Phys. Rev. B 37, 3575.
- [253]
- [254] [] van Haeringen, W., and D. Lenstra, 1990, Eds., Analogies in Optics and Micro Electronics (Kluwer Academic, Haarlem).
- [255]
- [256] [] van Haeringen, W., and D. Lenstra, 1991, Eds., Analogies in Optics and Micro Electronics (Kluwer Academic, Haarlem).
- [257]
- [258] [] van Rossum, M. C. W., and T. M. Nieuwenhuizen, 1993, Phys. Lett. A 177, 452.
- [259]
- [260] [] van Rossum, M. C. W., I. V. Lerner, B. L. Altshuler, and T. M. Nieuwenhuizen, 1997, Phys. Rev. B 55, 4710.
- [261]
- [262] [] van Rossum, M. C. W., J. F. de Boer, and Th. M. Nieuwenhuizen, 1995, Phys. Rev. E 52, 2053.
- [263]
- [264] [] van Rossum, M. C. W., T. M. Nieuwenhuizen, and R. Vlaming, 1995, Phys. Rev. E 51, 6158.
- [265]
- [266] [] van Tiggelen, B.A., 1995, Phys. Rev. Lett. 75, 422.
- [267]
- [268] [] van Tiggelen, B. A., A. Lagendijk, and A. Tip, 1990, J. Phys. C. M. 2, 7653.
- [269]
- [270] [] van Tiggelen, B. A., R. Maynard, and T. M. Nieuwenhuizen, 1996, Phys. Rev. B.
- [271]
- [272] [] Vdovin, Y. A., and V. M. Galitskii, 1967, Sov. Phys. JETP 25, 894. Zh. Eksp. Teor. Fiz. 52,1345 (1967).
- [273]
- [274] [] Vollhardt, D., and P. Wölfle, 1980a, Phys. Rev. Lett. 45, 842.
- [275]
- [276] [] Vollhardt, D., and P. Wölfle, 1980b, Phys. Rev. B 22, 4666.
- [277]
- [278] [] Vollhardt, D., and P. Wölfle, 1992, in Electronic phase transitions, edited by W. Hanke, and Y. V. Kopaev, Vol. 32 of Modern problems in condensed matter sciences (North-Holland, Amsterdam), p. 1.
- [279]
- [280] [] Wegner, F., 1976, Z. Phys. B 25, 327.
- [281]
- [282] [] Wegner, F., 1979, Z. Phys. B 35, 207.
- [283]
- [284] [] Wolf, P. E., and G. Maret, 1985, Phys. Rev. Lett. 55, 2696.
- [285]
- [286] [] Zhu, J. X., D. J. Pine, and D. A. Weitz, 1991, Phys. Rev. A 44, 3948.
- [287]
- [288] [] Zyuzin, A. Y., and B. Z. Spivak, 1987, Sov. Phys. JETP 66, 560.
- [289]
EDITOR: table 3 can be set narrower, I couldn’t figure out how to make Latex do so.
| Object | Small radius behavior | Large radius behavior |
|---|---|---|
| Absorbing sphere | ||
| Transparent sphere | ||
| Reflecting sphere | ||
| Absorbing cylinder | ||
| Transparent cylinder | ||
| Reflecting cylinder |