Evidence for growth of collective excitations in glasses at low temperatures
Abstract
We present new data on the nonequilibrium acoustic response of glasses to an applied dc electric field below 1K. When compared with the analogous dielectric response of the same material, the acoustic data show, within experimental precision, identical dependence on the perturbing field, but stronger temperature dependence. These data are difficult to reconcile with simple generalizations of the dipole gap model of two-level system (TLS) dielectric response, unless we assume that as is decreased, interaction-based TLS collective effects increase.
The equilibrium thermodynamic, acoustic, and dielectric properties of amorphous materials at low temperatures are described well by the tunneling two-level system (TLS) model [1]. Given a large number of independent TLS with a broad distribution of energy asymmetries and tunneling parameters (, where is a contant), the model predicts a specific heat and a thermal conductivity , in fair agreement with the universal behavior noted by Zeller and Pohl [2]. TLS reach thermal equilibrium with the phonon bath by coupling to local strain fields , which shift asymmetries by , where 1 eV. Via this coupling, the TLS contribute to the equilibrium sound speed and internal friction [3]. If the TLS have intrinsic electric dipole moments of magnitude , the TLS contribution to the equilibrium dielectric response [4] is strictly analogous.
The equilibrium sound speed has a maximum at a temperature mK. For , the “relaxational regime”, TLS behavior is dominated by single-phonon relaxational processes, while for , the “resonant regime”, resonant quantum tunneling of the TLS dominates their response to an ac strain field. The real part of the dielectric response behaves analogously, but with an overall sign difference. In both and the crossover temperature at measuring frequency is set by the TLS-phonon coupling, , where .
Recent measurements [5, 6, 7] of the nonequilibrium dielectric response of glasses are consistent with a model [14] in which weak dipolar TLS-TLS interactions produce a “dipole gap” in the TLS density of states near zero local electric and strain fields. The gap is necessary to ensure the stability of the ground state, and has been discussed elsewhere [16] in connection with spin glasses.
We concentrate on “sweep” experiments, in which an applied electric field, , is slowly varied in time as a triangle wave, and the nonequilibrium dielectric response is measured as a function of that field. This response shows a minimum at zero applied bias (a “zero bias hole”), which becomes sharper and deeper as the temperature is lowered. These sweep data are interpreted as an observation of the proposed gap in the TLS density of states. While the external field is swept, TLS with short relaxation times compared to the period of the sweep partly fill the zero bias hole, an effect which is most important when mK. Slower TLS continue to exhibit a depressed density of states at the field in which the sample was cooled. When mK, hysteretic effects [7] at the extrema of the sweeps become important, and for analysis these data are clipped to avoid edge effects.
In a standard capacitance bridge measurement, a small (1000 V/m) ac electric field is used to probe the dielectric response. For a typical TLS electric dipole moment, 1 Debye ( C m), this corresponds to an oscillating energy shift equivalent to K. Not all TLS have large electric dipoles [8, 9]. For example, it has been determined [11] that OH- impurities in SiO2 have dipole moments of around 3.7 D and dominate , while the intrinsic SiO2 TLS have moments of 0.6 D. The TLS dielectric response is proportional to , so dielectric measurements are most sensitive to nearly degenerate TLS with substantial electric dipole moments. In contrast, the acoustic dispersion is influenced by all TLS with elastic couplings, not just those with large .
The motivation of the present work was to examine the acoustic response to a perturbation which directly affects only the dielectrically active TLS. A related experiment, in which all TLS were perturbed with an applied strain field while only the dielectrically active subset was monitored, has been reported elsewhere [7].
To measure the acoustic response, torsional oscillators were constructed from sample materials, consisting of a torsion bar 150 m thick, 3 mm wide, and 3.5 cm in length. A paddle of the same material m thick, 1 cm in length, and 2.2 cm in width was attached to the center of the torsion bar using a minute quantity of epoxy. The ends of each bar were clamped between copper blocks mounted on an additional piece of the sample material to avoid strain due to thermal contraction. The bending length of the torsional member was 1.5 cm. A gold ground plane was evaporated on one side of the oscillator, and gold pads were deposited on the other side of the torsion bar to provide the perturbing field, . A NdFeB magnet roughly 0.5 mm3 in volume was epoxied to the center of the paddle, with its magnetization oriented in the plane of the paddle but perpendicular to the axis of the bar. The oscillator, mounted on a dilution refrigerator, was driven magnetically with a small superconducting coil and sensed capacitively.
Two oscillators were constructed, one from a commercial microscope coverglass[10], and the other from a previously studied [4] lot of BK7, a standard optical glass. The natural frequency, , of the coverglass oscillator at 4.2 K was approximately 490 Hz, and the internal friction, , as measured by a plot of amplitude v. driving frequency, was , including clamping losses, not unusual for such materials. For the BK7 oscillator at 4.2 K, 420 Hz, and the total was 6.7 .
Table I summarizes the equilibrium acoustic and dielectric responses measured with these techniques. As in previous equilibrium studies of such materials [12, 13, 6], the internal friction and dielectric losses were best described by an approximately linear variation with for , in disagreement with the standard tunneling model’s prediction of a dependence. Similarly, the measured ratios of slopes of and v. for low and high temperatures were closer to -1:1 than the predicted -2:1 for both materials.
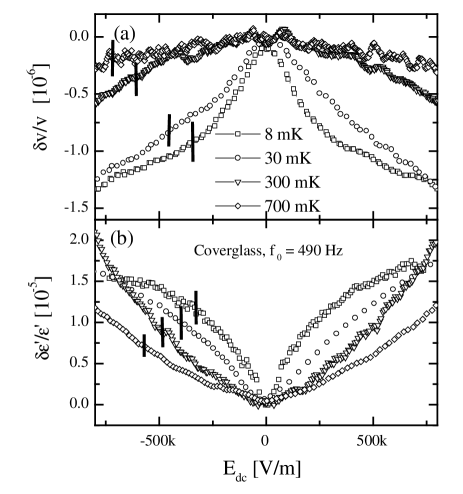
Figure 1a presents the results of acoustic sweep experiments on the coverglass sample. Recalling that increased TLS response corresponds to a lower sound speed, it is clear that a hole, centered at zero applied dc electric field, whose shape and depth are strongly temperature dependent, develops in the response. These data are particularly interesting when compared with analogous dielectric measurements of the same material, shown in Fig. 1b. The qualitative behavior is the same, but the temperature dependence of is considerably smaller than that of . There is still a substantial gap in the dielectric response at 700 mK, while the acoustic data show a much smaller response at that temperature. The data for BK7 are qualitatively the same. There was no significant drive level dependence to either the acoustic or dielectric nonequilibrium response (at acoustic strain amplitudes up to and ac measuring field amplitudes up to 2 kV/m). All the curves in Fig. 1 are taken well after the initial transient response. We assume that the filling of the zero bias hole during the sweep, which is only significant below 15 mK, is identical for acoustic and dielectric sweeps, an assumption justified by the observation that TLS relaxation rates are the same for both strain and electric field perturbations [7].
The dipolar gap theory developed to explain the dielectric effects [14] assumes that all TLS have a dipole moment of magnitude and that the response at short perturbation times is due to a field-dependent TLS density of states, . Define a function such that the equilibrium for a single TLS is proportional to . The dipole gap response is then:
| (2) | |||||
| (3) |
The function defined above contains the and dependences of and the and dependence of the equilibrium dielectric response, and depends logarithmically on [14].
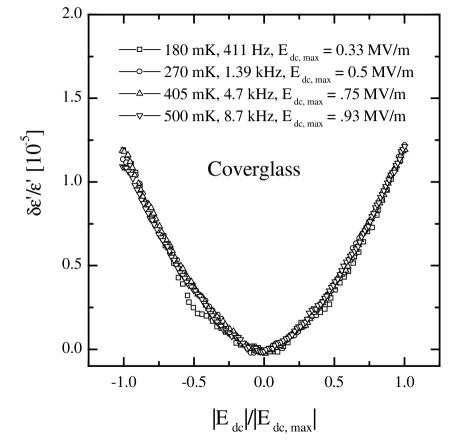
To test the applicability of (3), we performed a series of sweeps in the accessible domain of and , such that and were kept fixed. The results for the coverglass sample are shown in Figure 2. Again, the BK7 exhibited quite similar behavior. Within the precision of the data, (3) accurately describes the parametric dependence of the nonequilibrium dielectric response. Unfortunately, we cannot easily vary of the torsional oscillators to check for this scaling in the acoustic response.
We can generalize the above to the case where only a fraction of the TLS have electric dipoles . One would then expect the acoustic response to to be:
| (4) |
where we have assumed that the dielectrically active TLS have the same as the rest of the TLS. Eqs. (3) and (4) differ only by a constant factor, and thus this simple treatment cannot explain the differing dependences of the acoustic and dielectric sweeps seen in Fig. 1.
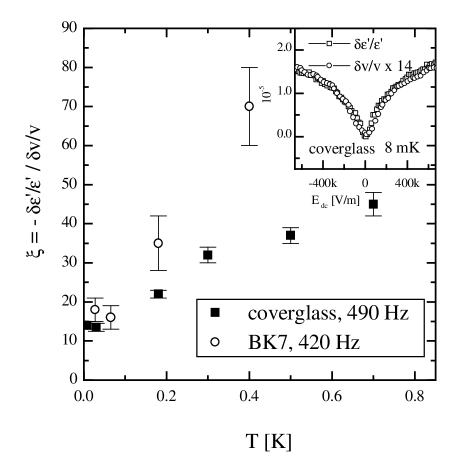
Within the statistical precision of the data, the dc field dependences of the nonequilibrium acoustic and dielectric responses share the same functional form; for example, see the inset in Fig. 3. For each a single multiplicative factor can make the acoustic data fall on top of the dielectric data, and the residuals show no systematic trends as a function of bias field. The temperature dependence of is shown in Fig. 3 for both samples, and is substantially larger in BK7 than in coverglass. Identical field dependences suggest that TLS with electric dipoles of a single magnitude are responsible for both effects, but the simple model of Eq. (4) isn’t correct, since it predicts to be constant. We also see that at the lowest temperatures the factor saturates to a constant value, although both the equilibrium and nonequilibrium acoustic and dielectric responses continue to change.
We now consider attempts to explain the behavior in Fig. 1 by modifying the TLS distribution used in Eqs. (3) and (4). In particular, distributions of the TLS coupling constants and might complicate matters [15]. Within the dipole gap model, one possible source of the relative temperature dependence seen in Fig. 1 could be differing relaxation parameters for the TLS responsible for the acoustic and dielectric responses. However, this would be inconsistent with Table I, which shows that .
Given this constraint on , the differing dependences of acoustic and dielectric responses in this model would have to come from different dependences on , implying that the dependences should be different as well. To be consistent with the data, any distribution of proposed to explain the temperature dependence of would have to lead to a difference in dependences too small to be resolved in this experiment.
We can also extend the model by explicitly accounting for the dependence of the interactions between TLS. The effective range of TLS interactions depends on , since there is some length scale beyond which the interaction energy is small compared to . Consider a particular TLS. We may define a volume centered on that TLS within which the interaction energy is greater than . For dipolar interactions, that volume grows as with decreasing temperature.
We propose that the fraction of TLS which are directly perturbed substantially by our bias field is relatively small. At high temperatures, interactions are short-range, and our acoustic data show a very small response because such a small fraction of acoustic TLS are perturbed. With decreasing , however, the growth of the interaction range allows the directly perturbed TLS to couple to an increasing number of dielectrically inactive TLS. The identical field dependences would be expected, since the number of dielectrically inactive TLS affected via interactions would be proportional to the number of TLS which are directly perturbed by . At sufficiently low temperatures, the typical range of interactions is comparable to the average spacing between dielectrically active TLS, and further decreases of have little effect on the number of indirectly perturbed TLS. Thus one would expect the temperature dependence of to saturate at low , as is seen. Note that the dipole gap itself continues to grow with decreasing temperature, as thermal smearing is reduced.
While a quantitative model for such a mechanism does not yet exist, an explanation of the difference between the acoustic and dielectric data in terms of the growing effect of TLS-TLS interactions seems necessary to explain the observed and dependences. Indirect support for interactions as a modification of the standard tunneling model has been seen in the temperature dependence of the dielectric loss tangent [6] and the internal friction [12, 17], and in recent spectral hole burning experiments [18, 19]. The current work and related experiments [21] provide important evidence that interaction-based collective effects grow as the temperature is decreased below 1 K. As various models [20] are proposed which incorporate interacting TLS to explain the universality of the low temperature properties of these materials, experiments which directly examine interaction effects are of increasing importance.
The authors wish to acknowledge valuable discussions of their data and the theoretical background with Alexander Burin, and to thank Christian Enss for his insights. D.N. acknowledges fellowship support from the Fannie and John Hertz Foundation. This work was supported under Department of Energy grant DE-FG03-90ER45435.
REFERENCES
- [1] P. Anderson, B. Halperin, and C. Varma, Phil. Mag. 25, 1 (1972); W. Phillips, J. Low Temp. Phys. 7, 351 (1972).
- [2] R. Zeller and R. Pohl, Phys. Rev. B 4, 2029 (1971).
- [3] J. Jäckle, Z. Phys. 257, 212 (1972).
- [4] P.J. Anthony and A.C. Anderson, Phys. Rev. B 20, 763 (1979).
- [5] D. Salvino, S. Rogge, B. Tigner, and D. Osheroff, Phys. Rev. Lett. 73, 268 (1994).
- [6] S. Rogge, D. Natelson, and D. Osheroff, Phys. Rev. Lett. 76, 3136 (1996).
- [7] S. Rogge, D. Natelson, and D.D. Osheroff, J. Low Temp. Phys. 106, 717 (1997).
- [8] M. von Schickfus and S. Hunklinger, J. Phys. C 9, L439 (1976).
- [9] C. Laermans, W. Arnold, and S. Hunklinger, J. Phys. C 10, L161 (1977).
- [10] Corning No. 1 microscope cover, part no. 2935-224. Corning Labware and Equipment, Corning, NY 14831.
- [11] B. Golding, M. von Schickfus, S. Hunklinger, and K. Dransfeld, Phys. Rev. Lett. 43 1817 (1979).
- [12] P. Esquinazi, R. König, and F. Pobell, Z. Phys. B 87,305 (1992).
- [13] J. Classen, C. Enss, C. Bechinger, G.Weiss and S. Hunklinger, Ann. Phys. 3, 315 (1994).
- [14] A. L. Burin, J. Low Temp. Phys. 100, 309 (1995).
- [15] A. L. Burin, private communication.
- [16] S. Kirkpatrick, Phys. Rev. B 16 4630 (1977).
- [17] A. L. Burin and Yu. Kagan, JETP 80, 761 (1995).
- [18] H. Maier, B.M. Kharmalov, and D. Haarer, Phys. Rev. Lett. 76, 2085 (1996).
- [19] P. Neu, D. Reichman, and R. Silbey, Phys. Rev. B 56, 5250 (1997).
- [20] M.W. Klein, B. Fischer, A.C. Anderson, and P.J. Anthony, Phys. Rev. B 18, 5887 (1978); R. Fisch, Phys. Rev. B 22, 3459 (1980); C. Yu and A. Leggett, Comm. Cond. Mat. Phys. 14, 231 (1988); S. Coppersmith, Phys. Rev. Lett. 67, 2315 (1991); A. L. Burin and Yu. Kagan, JETP 82, 159 (1996); C. Enss and S. Hunklinger, Phys. Rev. Lett. 79, 2831 (1997).
- [21] D. Natelson, D. Rosenberg, D.D. Osheroff. “Anomalous zero bias hole filling at T 1K”, in progress.
| Sample | freq. | ||||
|---|---|---|---|---|---|
| BK7 | 420 Hz | mK | mK | ||
| coverglass | 490 Hz | mK | mK |