[
Superconducting Magnetization above the Irreversibility Line in Tl2Ba2CuO6+δ
Abstract
Piezolever torque magnetometry has been used to measure the magnetization of superconducting Tl2Ba2CuO6+δ. Three crystals with different levels of oxygen overdoping were investigated in magnetic fields up to 10 Tesla. In all cases, the magnetization above the irreversibility line was found to depart from the behaviour of a simple London-like vortex liquid. In particular, for a strongly overdoped (K) crystal, the remnant superconducting order above the irreversibility line is characterized by a linear diamagnetic response () that persists well above and also up to the highest field employed.
pacs:
PACS numbers: 74.25.Ha, 74.60.Ec, 74.72.Fq, 07.55.Jg]
I Introduction
A distinguishing feature of the high- cuprate superconductors is that a finite resistance (in the zero current limit) appears at a magnetic field well below that required to restore the full normal state resistance. Experimentally, this resistance onset field is found to coincide with the so-called irreversibility field , above which magnetic irreversibility vanishes. A broad superconducting to normal transition is thought to reflect the existence of a mobile vortex liquid between and .[3] Although diffraction evidence for a genuine vortex liquid has yet to be reported, the term will be used here to designate the state of the vortex assembly between these two characteristic fields. Physically, the existence of a liquid is thought to be a consequence of large anisotropy and a short superconducting coherence length, both factors weakening the vortex-vortex interaction. In one of the many available scenarios,[3] this weak flux lattice is thought to be “melted” at by strong thermal fluctuations.
An open question is how this behaviour evolves as is lowered and the coherence length increases. Tl2Ba2CuO6+δ is an attractive compound for an investigation of this issue: with an optimal critical temperature of around 90K, it exists in a comparatively simple single layer structure, and strongly overdoped tetragonal single crystals can be produced by introducing relatively little excess oxygen ().[4, 5, 6] In some respects, the overdoping that is possible in Tl2Ba2CuO6+δ is unique: for example, overdoping the La2-xSrxCuO4 system leads to high levels of disorder. In Tl2Ba2CuO6+δ, the disorder associated with doping resides in or between the TlO bilayers, so disorder-related carrier scattering in the CuO2 planes is relatively weak; in-plane resistivities just above can be less than 10 cm, even in strongly overdoped material.[7] A variety of experiments have been performed on tetragonal single crystals and epitaxial thin films. For example, the superconducting gap symmetry has been assessed in tri- and quadri-crystal thin films[8, 9] and in microwave experiments,[10] the low-field vortex properties of the vortex lattice have been studied by magnetization[11] and Bitter patterning,[12] and a number of normal state properties have also been investigated.[5, 13]
In Tl2Ba2CuO6+δ crystals with high values of , resistance measurements[14] have shown that the normal-superconducting transition is broadened, as observed in other cuprate materials. However, for strongly overdoped material with low values, sharp resistive transitions are observed.[7] These are similar in appearance to the transitions encountered in conventional superconductors, where it is known that .[3] This suggests that lowering by overdoping somehow eliminates the flux liquid from the vortex phase diagram.
On the other hand, the temperature dependence of the apparent upper critical field deduced from the overdoped resistivity data is strikingly different from that expected in a conventional superconductor: it exhibits an upward curvature from K down to the lowest temperatures studied (12mK) and shows no sign of saturation for .[7] Qualitatively similar observations have been reported on thin films of Bi2Sr2CuO6[15] and other hole doped cuprates. This anomalous apparent in the hole doped materials has attracted substantial attention. Theoretical proposals fall into two broad classes. One of these[16, 17] regards the existence of residual superconducting order above the apparent as an essential aspect of the phenomenon, while the other approach[18, 19, 20, 21, 22, 23, 24] considers the transition seen in the resistivity as an accurate estimate of the location of the transition from the superconducting to the normal state.
The sharpness of the transition and the absence of a measurable magnetoresistance at higher fields both argue against the existence of residual superconducting order. However, it is difficult to estimate quantitatively the contribution of such order to the conductivity, so transport measurements by themselves cannot decide this issue. Studies of the specific heat or magnetization would be more definitive, but single crystals of high quality tend to be small (grams) and the experiments correspondingly difficult. Nonetheless, Carrington et al.[25] have recently succeeded in measuring the specific heat of a small single crystal with K. Although an applied field dramatically reduces the size of the superconducting specific heat anomaly, the results imply that remnant superconducting order persists well above the apparent .
In summary, the information available on the vortex liquid in Tl2Ba2CuO6+δ presents a seemingly conflicting picture. As the transition temperature is reduced by overdoping, specific heat measurements suggest that a wide vortex liquid region persists. By contrast, the sharp resistive transitions suggest that the liquid region becomes very narrow in highly overdoped material. Magnetization offers the most direct probe of vortex behaviour, but previous SQUID efforts to measure this quantity on highly overdoped material have been hampered by inadequate sensitivity.[26]
We have employed a recently introduced variant of torque magnetometry – using piezoresistive microcantilevers – to reach a working resolution of in a field of 10 Tesla. This is about two orders of magnitude more sensitive than is available from standard SQUID techniques, allowing us to explore the magnetization of Tl2Ba2CuO6+δ over a wide doping range. We find that a diamagnetic torque persists above for all the crystals examined. However, the underlying magnetization departs drastically from that of a London liquid.
II Torque Principles
For a material in which the magnetization is uniform, the magnetic torque density (torque per unit volume) is given by , where is the applied magnetic field. If is applied along a symmetry axis of a single crystal, the equilibrium magnetization is parallel to , and the torque is zero. The magnetic response of tetragonal high- materials to off-axis fields is largely controlled by their superconducting anisotropy, . Here, and are the Ginzburg-Landau superconducting effective masses for pair motion along the -direction, and in the CuO2 planes, respectively. Both the magnitude and direction of depend on and on the angle that the field makes with the -axis. The anisotropy of all the crystals studied in this work was large (), simplifying the interpretation of the data.
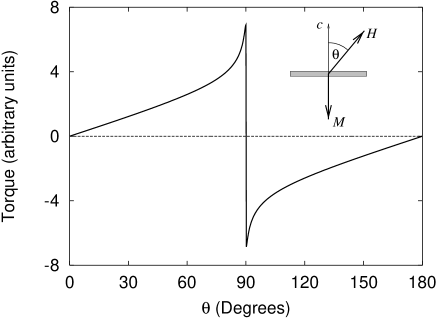
The torque on an assembly of vortices in a high- superconductor exhibits a characteristic angular dependence.[27] Its origin may be understood by referring to Fig. 1. For large , the magnetization lies very close to the -axis, as shown in the inset, while its magnitude depends only on the component of the applied field along that axis. The supposition that is fully determined by the effective field is a fundamental result of scaling analysis[28] in the large- limit of the anisotropic Ginzburg-Landau model.
Under these circumstances, and for , the equilibrium vortex magnetization can usually be well approximated by the London result , where and are the in-plane penetration depth and the upper critical field along the -axis, respectively, and is a numerical parameter of order unity.[27] For , the magnetic moment lies along the negative -axis, and the magnitude of the vortex torque density is given by
| (1) |
For , the magnetization points along the positive -axis, and the sign of the torque is reversed. At , the magnetic field crosses the CuO2 planes, and the superconducting screening currents abruptly change direction.
A more complete description of the vortex torque[27] indicates that Eq. (1) is correct to for and for field orientations lying more than from the CuO2 planes. A typical predicted torque characteristic is shown in Fig. 1. The drastic increase of at high angles is due to the logarithmic term in Eq. (1): as the effective applied field decreases, the diamagnetic magnetization of the crystal increases, reaching a sharp peak as the crystal enters the Meissner state at .
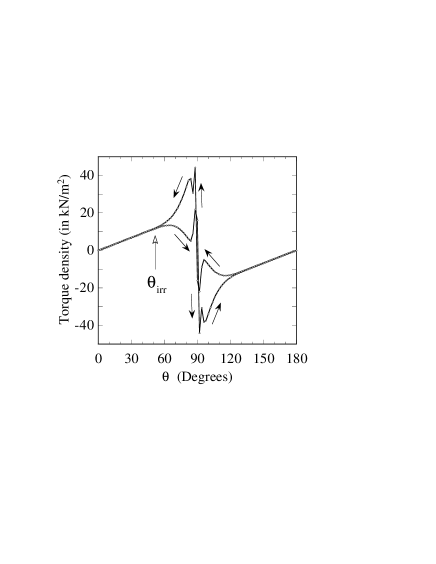
In traditional magnetization measurements, the irreversibility field is probed by cycling the magnetic field up and down and recording the value at which irreversibility develops. Since the irreversibility is anisotropic, the symbol is reserved here to denote the -axis irreversibility field. For reasons discussed in the Appendix, was measured here in a different manner: the field was fixed at some value , while the angle , and with it the effective field , was cycled. Angular hysteresis is observed above some angle . Assuming a large anisotropy, can then be deduced from directly measured quantities, viz.
| (2) |
III Experimental
The critical temperatures of the three Tl2Ba2CuO6+δ crystals used in this work were established as the temperatures above which the low-field superconducting vortex torque signature disappeared. The values obtained, K, 25K, and 85K, agreed with previous estimates from resistivity measurements for the K sample[7] and with the specific heat anomalies observed in the other two crystals[29] within experimental uncertainty (dominated by the superconducting transition widths) of a few percent.
All three samples were grown using a self-flux method in alumina crucibles.[30] As-grown crystals are overdoped, so the desired doping level was established by low temperature (C) annealing in various atmospheres.[30] For our torque experiments, the samples were then cut into platelets with typical dimensions .
Torque measurements were performed using piezoresistive microcantilevers. Originally designed for atomic force microscopy,[31] their use as sensitive torque sensors was pioneered by Rossel and coworkers.[32] Commercial silicon piezolevers[33] were employed in this work, their dimensions being . A boron-doped path implanted on the upper lever surface has a resistance of about 3k at 4K. On applying a torque, the resistance changes by a small amount . A typical number for the response is per Nm.
Using an micropositioner, the crystal was epoxied to the end of a cantilever, its CuO2 planes coinciding with the flat surface of the lever. A second (empty) piezolever was employed to compensate background signals, using a Wheatstone bridge circuit driven by a floating 77 Hz AC current source. The current (50A through each lever) increased the sample temperature by less than 0.1K, at all temperatures.
The two levers were mounted closely together on a rotation stage inside a pumped 4He cryomagnetic system capable of reaching 1.3K in a 15T field. The magnet was operated in persistent mode, and its field inside the rotation stage was homogeneous to . The cantilevers were either in 4He exchange gas or immersed directly in liquid helium.
Both calibration and uncertainty estimation are more involved than for traditional torque methods.[34] The main source of random uncertainty comes from variations in temperature. A systematic background signal originates from the varying gravitational torque on the crystal when the sample stage is rotated. However, the largest measurement uncertainty stems from the intrinsic magnetoresistance of the levers. Over most of our measurement range, the torque density data presented in the next section are estimated to be reliable to N/m2. For a more detailed discussion of the measurement uncertainties, the reader is referred to Appendix B.
IV Results
A Anisotropy and Irreversibility
In principle, the superconducting anisotropy may be determined from the angular dependence of the torque when the field lies close to the CuO2 planes. In practice, the finite mosaic spread of the crystal broadens the high-angle characteristic. For this, and other reasons, the data can only be used to establish a lower bound for . These difficulties have been discussed in the literature.[34] Nonetheless, for all three crystals, we estimate that , justifying the high-anisotropy approximation described in section II.
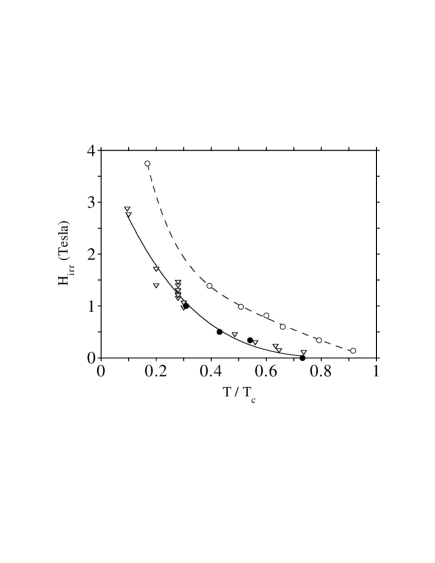
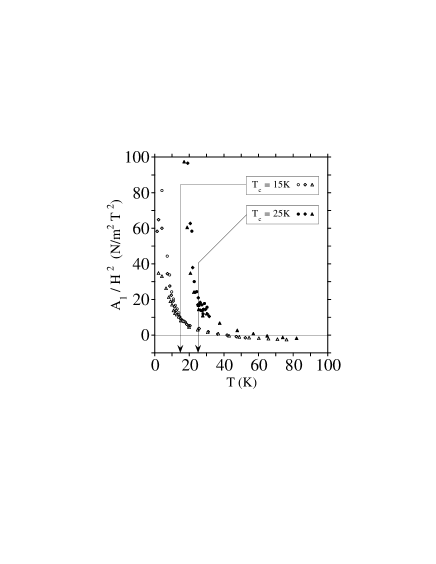
Fig. 2 shows the angular dependence of the torque density observed for the K crystal at K in a field of 1 Tesla. (Note that in this and subsequent figures showing angular dependences, the data have been taken over two angular quadrants and have then been symmetrized according to Eq. (B3), as discussed in the Appendix). The irreversibility angle , identified on this Figure, allows the associated irreversibility field to be estimated using Eq. (2). was obtained in this manner for all three crystals and is shown in Fig. 3. The data for the K crystal are in good agreement with previous reports of the “foot” of the resistive transition in a magnetic field.[7] Also, the irreversibility fields obtained with the angular sweep technique agreed with control runs at selected temperatures that used a simple field sweep with pointing close to (but not along) the -axis.
Note that the irreversibility lines for the K and the K samples almost coincide when plotted against reduced temperature. We believe that this is an intrinsic property of the material – it should again be stressed that the samples used in our study are of high quality, as indicated by their sharp specific heat anomalies.[29] Also, the lack of an unambiguous trend of the irreversibility fields with is again in accordance with resistivity measurements across large parts of the doping range.[14] Still, this behaviour is quite surprising and warrants further investigation, as one might naively rather expect a monotonic change with doping.
B Temperatures below
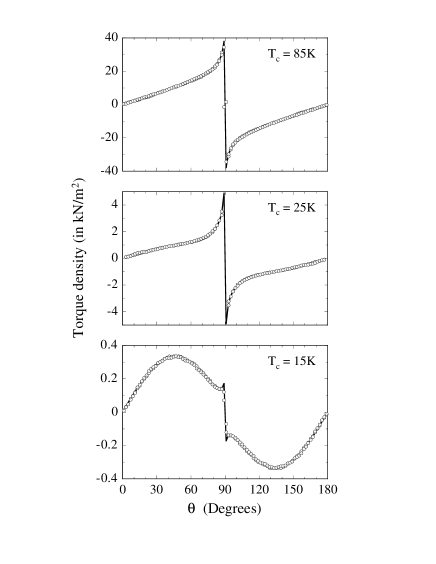
Torque density data for all three crystals, at and T, are shown in Fig. 4. At a reduced temperature of 0.85, a field of 5T along the -axis is much greater than for all three crystals (see Fig. 3). Irreversibility is therefore confined to angles very close to .
There is a sharp quantitative distinction between the three cases. The torque densities for the K, 25K, and 85K crystals stand in the approximate ratios 1 : 10 : 100. The angular dependences for the K and 85K crystals are in at least qualitative accord with Eq. (1) (see Fig. 1). However, the angular dependence for the K crystal is quite different, containing a strong contribution that appears to vary as .
We therefore tried fitting all the data to an expression of the form
| (3) |
for . For lying in the second quadrant, the torque is given by , in conformity with its antisymmetry around the -plane. The sum of the - and -terms is equivalent to , with an apparent critical field , and therefore corresponds to the pure vortex torque expected from Eq. (1). The linear decomposition in Eq. (3) provides the most convenient representation of our data in that it facilitates error estimates and in that the fitting coefficients have the same units (N/m2) as the torque density itself. , , and were adjusted to give a least squares fit to the data at each field and temperature. A central result of our work is that Eq. (3) provides an excellent empirical fit to all the data (see, e.g., Fig. 4). The fit parameters for all temperatures, fields, and samples examined in this study have been tabulated in Table I and therefore provide a comprehensive representation of our experimental results. In all cases, the fit is within experimental uncertainties in the region , where the irreversibility angle can be found using Eq. (2) and the data shown in Fig. 3.
C Temperatures above
For all three crystals, both the coefficients and in Table I, corresponding to the superconducting vortex torque, extrapolate to zero at , but this is not the case for the coefficient : for the K and 25K crystals, the term could be extracted for temperatures well above . However, for the K crystal, the contribution of the term is very small compared to the magnetoresistive background (see Appendix B), and no systematic data could be obtained above .
The sinusoidal torque in Eq. (3) corresponds to a magnetization that is proportional to the effective field along the -axis, with a linear susceptibility of . (More precisely, if the additional effects of small normal state paramagnetism are taken into account, this quantity is the susceptibility anisotropy .) For Eq. (3) to consistently describe the torque data at different applied fields, the coefficient therefore has to be proportional to .
Fig. 5 shows data for the temperature dependence of for both the K and 25K crystals at different fields and is indeed in basic agreement with . Deviations from an -dependence evidently occur at temperatures below , probably due to slight systematic variations between the runs at different applied fields, with a comparatively large effect on the outcome of the non-orthogonal three-parameter fit in Eq. (3).
V Discussion
Data for the angular dependence of the torque in Tl2Ba2CuO6+δ over a wide range of temperature, field, and doping are parametrized in Table I. We now discuss the magnetization , and its dependence on the field component along the -axis, . In other high- superconductors such as Bi2Sr2CaCu2O8, the London relation provides a good approximation for the field dependence of the magnetization.[35] Significant deviations from London behaviour have been noted close to , and interpreted in terms of classical (vortex) fluctuations.[36, 37] Smaller deviations at lower temperatures have been interpreted in terms of quantum fluctuations.[35, 38] As we now discuss, the reversible magnetization of overdoped Tl2Ba2CuO6+δ, however, departs drastically from London behaviour for all temperatures and fields.
The magnetization can be retrieved from the measurements, using the relation . This assumes that lies close to the -axis, which certainly holds for vortex magnetization (but might be invalidated by strong in-plane normal state paramagnetism). As an example, Fig. 6 shows the magnetization data on the K crystal at a temperature of K, as retrieved from the measurements at applied fields of 1T, 3T, 5T, and 10T.
Unfortunately, the temperatures in Fig. 6 do not coincide perfectly; moreover, data points with pointing
| K | (K) | (kN/m2) | (kN/m2) | (kN/m2) | K | (K) | (kN/m2) | (kN/m2) | (kN/m2) |
|---|---|---|---|---|---|---|---|---|---|
| T | 4.2 | -0.069 | 0.356 | -0.028 | T | 16.5 | 0.32 | 1.19 | -1.58 |
| 7.3 | -0.004 | 0.111 | -0.081 | 19.8 | 0.17 | 0.51 | -0.76 | ||
| 8.8 | 0.031 | 0.024 | -0.084 | 22.9 | 0.09 | 0.17 | -0.22 | ||
| 9.9 | 0.021 | 0.021 | -0.053 | T | 6.6 | 5.62 | -4.22 | -15.6 | |
| 11.0 | 0.009 | 0.025 | -0.029 | 8.3 | 4.49 | -2.93 | -13.3 | ||
| 12.1 | 0.015 | 0.009 | -0.017 | 9.8 | 3.67 | -2.10 | -11.4 | ||
| 13.2 | 0.013 | 0.003 | -0.008 | 11.2 | 2.90 | -1.36 | -9.59 | ||
| 14.3 | 0.011 | 0.001 | -0.004 | 12.6 | 2.44 | -1.13 | -8.15 | ||
| T | 4.2 | 0.731 | -0.590 | -0.724 | 14.1 | 2.00 | -0.95 | -6.62 | |
| 7.3 | 0.400 | -0.312 | -0.376 | 15.6 | 1.93 | -1.35 | -5.57 | ||
| 8.7 | 0.304 | -0.208 | -0.251 | 17.0 | 1.69 | -1.35 | -4.38 | ||
| 9.8 | 0.219 | -0.093 | -0.146 | 18.5 | 1.14 | -0.71 | -2.99 | ||
| 10.8 | 0.182 | -0.060 | -0.094 | 20.0 | 0.93 | -0.62 | -2.04 | ||
| 11.9 | 0.150 | -0.035 | -0.053 | 21.5 | 0.53 | -0.10 | -1.09 | ||
| 13.0 | 0.132 | -0.024 | -0.029 | 22.9 | 0.27 | 0.20 | -0.48 | ||
| 14.0 | 0.112 | -0.008 | -0.012 | 24.4 | 0.22 | 0.16 | -0.23 | ||
| T | 1.4 | 1.46 | -0.04 | -0.31 | T | 4.2 | 13.0 | -14.7 | -26.5 |
| 2.3 | 1.62 | -0.54 | -0.67 | 7.0 | 8.6 | -9.2 | -19.5 | ||
| 4.2 | 1.50 | -1.00 | -0.93 | 7.7 | 8.4 | -9.2 | -18.9 | ||
| 7.4 | 0.86 | -0.54 | -0.48 | 9.3 | 7.9 | -9.5 | -17.6 | ||
| 8.8 | 0.69 | -0.37 | -0.33 | 10.7 | 7.3 | -9.2 | -15.9 | ||
| 9.7 | 0.56 | -0.22 | -0.22 | 12.1 | 6.5 | -8.3 | -13.8 | ||
| 10.7 | 0.48 | -0.15 | -0.15 | 13.5 | 6.1 | -8.1 | -12.2 | ||
| 11.5 | 0.40 | -0.07 | -0.08 | 14.9 | 5.8 | -7.9 | -10.5 | ||
| 12.5 | 0.35 | -0.04 | -0.05 | 16.3 | 4.1 | -5.2 | -7.7 | ||
| 13.5 | 0.29 | 0.01 | -0.01 | 17.7 | 3.2 | -3.9 | -5.7 | ||
| 14.4 | 0.26 | 0.02 | 0.00 | 19.1 | 2.4 | -2.7 | -4.0 | ||
| T | 1.4 | 3.64 | -1.52 | -1.24 | 20.6 | 1.6 | -1.4 | -2.4 | |
| 2.2 | 3.48 | -1.24 | -1.02 | 22.0 | 1.0 | -0.4 | -1.3 | ||
| 4.2 | 3.32 | -1.31 | -1.02 | 23.4 | 0.6 | 0.1 | -0.6 | ||
| 6.6 | 2.63 | -0.94 | -0.68 | 24.9 | 0.4 | 0.2 | -0.2 | ||
| 8.2 | 2.13 | -0.61 | -0.44 | T | 2.5 | 16.3 | -13.4 | -23.6 | |
| 9.2 | 1.90 | -0.44 | -0.32 | 9.9 | 21.1 | -29.8 | -28.2 | ||
| 10.0 | 1.71 | -0.32 | -0.23 | 11.7 | 18.6 | -26.5 | -24.0 | ||
| 10.9 | 1.39 | -0.06 | -0.10 | 13.5 | 15.1 | -21.0 | -18.9 | ||
| 11.7 | 1.24 | 0.03 | -0.04 | 15.2 | 12.7 | -17.2 | -15.0 | ||
| 11.9 | 1.24 | 0.02 | -0.04 | 17.0 | 9.7 | -12.5 | -10.8 | ||
| 12.8 | 1.15 | 0.02 | -0.02 | 18.8 | 6.1 | -6.4 | -6.2 | ||
| 13.9 | 1.03 | 0.02 | -0.00 | 20.7 | 3.5 | -2.3 | -3.0 | ||
| 22.7 | 2.4 | -0.8 | -1.4 | ||||||
| 25.4 | 1.5 | 0.4 | -0.2 | ||||||
| K | K | ||||||||
| T | 35.3 | -2.0 | 16.7 | -1.7 | T | 50.7 | 4.8 | 20.2 | -17.2 |
| 44.4 | -0.8 | 12.5 | -2.9 | 60.5 | 3.3 | 15.2 | -12.3 | ||
| 53.4 | -0.4 | 9.5 | -2.8 | 69.8 | 1.2 | 10.6 | -6.5 | ||
| 62.4 | 0.1 | 6.2 | -2.4 | 79.0 | -0.7 | 6.5 | -0.7 | ||
| 71.4 | 1.1 | 1.8 | -1.8 | T | 54.8 | 6.8 | 27.8 | -27.7 | |
| T | 44.5 | 2.9 | 18.9 | -12.2 | 65.4 | 2.6 | 20.9 | -16.6 | |
| 53.7 | 2.0 | 15.4 | -9.4 | 70.8 | -0.1 | 18.1 | -10.2 | ||
| 63.3 | 1.4 | 10.7 | -6.5 | 76.0 | -0.6 | 12.9 | -5.1 | ||
| 72.4 | 0.4 | 6.47 | -3.2 | ||||||
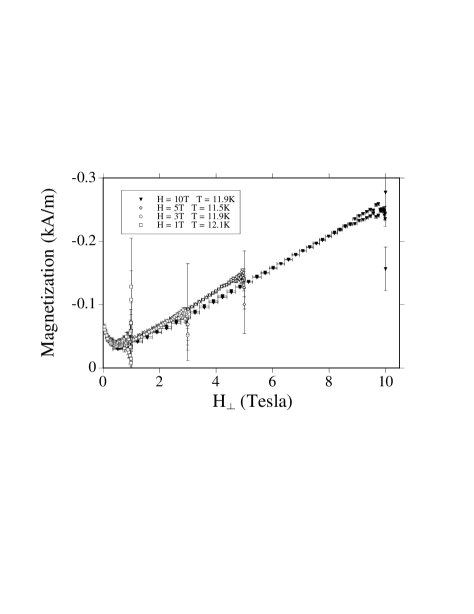
close to the -axis (i.e. for ) have error bars diverging as . Therefore, to get a more systematic and comprehensive representation of our data, we employed an averaging technique. At a given temperature, instead of working with individual data points, we retrieved the curves from Eq. (3), where the fit coefficients , , and were interpolated at the desired temperature from Table I. The resulting four curves at the applied fields of 1T, 3T, 5T, and 10T were then averaged. (In order to minimize the overall uncertainty, a weighting factor of was assigned to each curve, where is the estimated uncertainty of the extracted magnetization – which diverges as ).
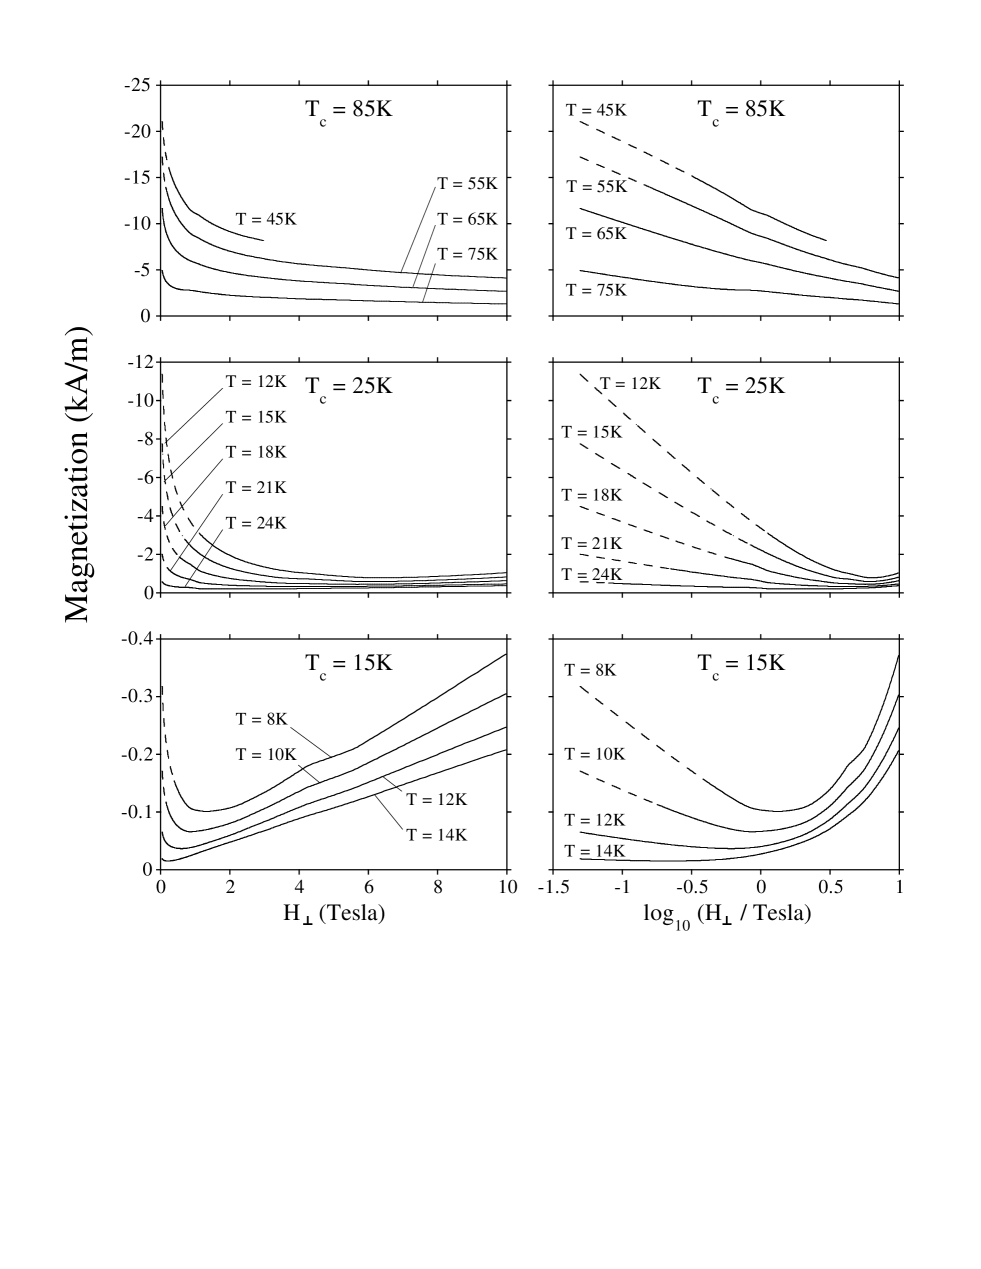
This averaged magnetization is plotted against and in Fig. 7 for a variety of temperatures below for all three crystals. The dashed lines in all the panels represent estimates for the equilibrium magnetization in fields below the irreversibility field. These estimates were obtained by extrapolating the fit in Eq. (3) to angles higher than and therefore to applied fields . The reader should ignore the small “wiggles” in the lines: these are artefacts, caused by slightly different values of obtained from runs in the experimentally applied fields of 1T, 3T, 5T, and 10T.
Consider the right panels in Fig. 7, showing the variation of the magnetization with . For the K crystal, there are some departures from linearity, but the form of the data is qualitatively similar to that seen in other cuprates such as Bi2Sr2CaCu2O8.[35] For the K and 25K crystals, however, departs strongly from linearity and displays an upturn which – at least at lower temperatures – occurs in the vicinity of the irreversibility field. As can be seen in the left panels of Fig. 7, there then exists an extensive field range over which (corresponding to contributions from the first term in Eq. (3)). This region extends as the temperature rises, and above , the magnetization is linear over the whole field range, as discussed in section IV C.
A (roughly) linear magnetization, , has been observed previously in other high- materials in the immediate vicinity of , and ascribed to classical thermal fluctuations.[36] Its appearance at very much lower temperatures is a surprising result and raises the possibility that some sort of artefact might be affecting the measurements. A linear relation between and is characteristic of both the Pauli susceptibility in a normal metal and a linear Curie spin susceptibility. All high- materials exhibit such a spin susceptibility which is anisotropic due to crystal field interactions,[39] leading to a torque that varies as . Such a (normal state) torque mimics the first term in Eq. (3), suggesting that the linear magnetization may have nothing to do with superconductivity and may simply reflect the presence of a normal-state susceptibility anisotropy with a strong temperature dependence.
Although possible in principle, there are two reasons why such a scenario is unlikely: firstly, the sign of the effect is implausible. Fig. 5 shows that the component changes sign at higher temperatures, for both the K and 25K crystals. At higher temperatures, the magnitude of the associated susceptibility anisotropy is (SI units), a number that is typical for the cuprates;[39] the sign of this term is such that the maximum susceptibility lies along the -axis, as observed in essentially all other high- materials. However, as shown in Fig. 5, the sign is reversed below , for both crystals. It is very difficult to understand why a normal state effect of this type should flip sign, and why it should do so at a temperature linked to the superconducting transition. In addition, at a given temperature, the normal state susceptibility in Tl2Ba2CuO6+δ is known to be larger for crystals with lower critical temperatures.[40] The linear susceptibility deduced from our torque measurements is shown in Fig. 5; at a given temperature, it is smaller for the lower crystal. Although a normal state origin for the linear magnetization cannot be completely dismissed, the balance of evidence suggests that it is likely to be a consequence of superconducting order.
It should be mentioned that the diamagnetic upturn in our susceptibility anisotropy data in Fig. 5 exhibits qualitative similarity to the “diamagnetic Curie-Weiss law” observed in the normal state of YBa2Cu3O7[39, 41] and, most notably, in La2-xSrxCu2O4,[42] the origin of which remains unknown. Fitting our data to a Curie-Weiss term with a constant background, we obtain K and, rather intriguingly, as characteristic temperatures for the two samples, where the subscript refers to the critical temperature.
It is also interesting to note that, independent of the origin of the contribution in overdoped Tl2Ba2CuO6+δ, subtracting it from the data does not lead to a standard superconducting torque. Although its angular dependence is qualitatively described by Eq. (1),
attempts to obtain the apparent upper critical field gave unphysical temperature dependences. This is not the case for other high- superconductors, where physically reasonable values and temperature dependences of can be extracted from torque data.[43, 44]
If all the data shown in Fig. 7 are indeed directly linked to superconducting order, they give a new perspective on one of the problems that motivated our study, that of the upper critical field in strongly overdoped Tl2Ba2CuO6+δ. Recently, an attempt has been made to deduce the temperature dependence of from a Raman scattering experiment on a Tl2Ba2CuO6+δ crystal with K.[45] In our K sample, our data suggest that diamagnetism persists to much higher fields than those identified as in that study.
Our data also clearly imply the existence of diamagnetism – and thus remnant superconducting order – at fields and temperatures for which transport measurements[7] suggest that the normal state has been fully restored. This conclusion was previously reached by Carrington et al. on the basis of heat capacity measurements,[25] but the field dependence of the heat capacity anomaly in low- Tl2Ba2CuO6+δ appeared to be qualitatively similar to that seen in other cuprates with higher transition temperatures. As noted in Ref. [25], this is difficult to reconcile with striking differences in the transport behaviour between optimally doped and overdoped Tl2Ba2CuO6+δ. The new result from our torque data is that although remnant superconducting order exists above the irreversibility line for all doping levels, departures from London behaviour clearly emerge as is reduced from 85K to 15K.
In summary, the magnetic behaviour of low- crystals belonging to the Tl2Ba2CuO6+δ system has been a puzzle for a number of years. Transport measurements have suggested that a vortex liquid does not appear and that the irreversibility and upper critical field boundaries coincide. On the other hand, specific heat measurements have shown that superconducting order persists well above the irreversibility boundary. In this work, we have studied the superconducting magnetization and demonstrated that significant departures from London liquid behaviour occur for all three samples studied, i.e. across the entire overdoped region. The departures increase in severity as the doping level is increased. In particular, for strongly overdoped (K) material, a London-like vortex liquid does not appear above the irreversibility boundary. The remnant superconducting order is characterized by a linear diamagnetic response, a response that persists well above and also up to the highest field employed here (10 Tesla). We hope that this novel result will encourage further effort to develop our understanding of the intriguing behaviour of overdoped Tl2Ba2CuO6+δ.
Acknowledgements.
We thank A. Carrington for useful discussions of unpublished heat capacity data on two of the crystals studied in this work, and V. G. Kogan, A. J. Millis, and A. M. Tsvelik for valuable discussions. We are also grateful to N. E. Hussey for contributions to the early part of the project. The work was funded by the U.K. EPSRC, and one of us (APM) gratefully acknowledges the support of the Royal Society. In addition, one of us (DEF) acknowledges support provided by an EPSRC Visiting Fellowship and NSF support under grant DMR93-07581.A Calibration
With a force constant of 2.5 N/m, the angular displacement of the lever for all the reversible torques encountered in this study is estimated to be significantly less than . Under these circumstances, it can be assumed[46] that the change in lever resistance, , is proportional to the torque experienced by the sample, or,
| (A1) |
where is a calibration constant.
Let and be the density and volume of the attached crystal, respectively. To calibrate the cantilever, the balanced bridge configuration described in the text was rotated in zero magnetic field where the lever only experiences a gravitational torque given by
| (A2) |
where is the angle to the vertical, is the length of the lever, and is the gravitational acceleration of the Earth. The resistive path is assumed to be close to the region of maximum stress at the lever base. The amplitude of the associated resistance change, , was measured and the sensitivity obtained from
| (A3) |
The value of obtained in this way was. No systematic study of the temperature dependence of the sensitivity was performed. However, Yuan et al.[47] found the piezolever sensitivity to be constant to a factor of 2 over the temperature range involved in this work, a result that was confirmed for one lever used in this study. The calibration constant in the present work is therefore subject to an uncertainty of order .
B Error Estimate
The main source of random measurement uncertainty stemmed from temperature variations. Although these variations were negligible when the lever was immersed in liquid helium, they were about K when it was surrounded by exchange gas. These variations coupled into the system via the temperature dependent lever resistance . The compensation arrangement could not eliminate this effect, but at least suppress it to 5% or less. Since itself varied, the resulting torque uncertainty depended on temperature and rose from to a minimum of about Nm at 5K to a maximum of about Nm at 30K.
The small contribution from the gravitational signal (Appendix A) was measured and subtracted from the data. Cantilever magnetoresistance was less easy to deal with and constituted the most serious systematic uncertainty for the measurements reported here. Initially varying as , the (temperature-dependent) change in lever resistance with field becomes almost linear above 0.5T and reaches a value as high as in a field of 10T. Again, the compensation lever could trim down the effective change to a few Ohms, but this was still comparable to the total signal for the (K) crystal.
The strategy for reducing this uncertainty was two-fold. In the first place, although the magnetoresistance is large, its anisotropy at temperatures below 40K is relatively small, reducing the apparent magnetoresistive torque to N/m2T when the levers were rotated in the field. By confining measurements to the angular variation of the torque, the magnetoresistance error was therefore reduced to a manageable level. (This was the reason why the irreversibility field was obtained from the angular characteristic, rather than a traditional field sweep.)
It was further reduced by noting that, in our geometrical configuration, the symmetry of the vortex torque and the apparent magnetoresistive torque around the -plane were odd and even, respectively:
| (B1) | |||||
| (B2) |
Given an observed angular dependence , over two angular quadrants, the vortex torque was therefore extracted according to:
| (B3) |
This is the quantity actually plotted in Figs. 2 and 4. This procedure cancelled the symmetric magnetoresistive component. Misalignments of the levers () led to a residual torque uncertainty of Nm/T (below 40K; Nm/T at higher temperatures). Note that, in a 10T field, this is about 102 times larger than the intrinsic uncertainty quoted for the piezolever method.[32] The degree of cancellation could probably be improved, but it was adequate for the present work. In a field of 10T, the remaining torque uncertainty corresponds to a moment uncertainty of Am2, about 102 times better than can be achieved by commercial SQUID methods.
To compare the above numbers with the torque density results, they have to be divided by the respective crystal volumes , , and , where the subscript refers to the critical temperature.
REFERENCES
- [1] [**footnotemark: *] Present address: School of Physics and Astronomy, University of Birmingham, Edgbaston, Birmingham B15 2TT, United Kingdom.
- [2] [††footnotemark: †] Permanent address: Physics Department, Case Western Reserve University, Cleveland, Ohio 44106, USA.
- [3] For a review, see: D. E. Farrell in Physical Properties of High Temperature Superconductors IV, edited by D. M. Ginsberg (World Scientific, Singapore, 1994).
- [4] Y. Kubo, Y. Shimakawa, T. Manako, and H. Igarashi, Phys. Rev. B43, 7875 (1991).
- [5] T. Manako, Y. Kubo, and Y. Shimakawa, Phys. Rev. B46, 11019 (1992).
- [6] R. S. Liu, S. D. Hughes, R. J. Angel, T. P. Hackwell, A. P. Mackenzie, and P. P. Edwards, Physica C 198, 203 (1992).
- [7] A. P. Mackenzie, S. R. Julian, G. G. Lonzarich, A. Carrington, S. D. Hughes, R. S. Liu, and D. C. Sinclair, Phys. Rev. Lett.71, 1238 (1993).
- [8] C. C. Tsuei, J. R. Kirtley, M. Rupp, J. Z. Sun, A. Gupta, M. B. Ketchen, C. A. Wang, Z. F. Ren, J. H. Wang, and M. Bhushan, Science 271, 329 (1996).
- [9] C. C. Tsuei, J. R. Kirtley, Z. F. Ren, J. H. Wang, H. Raffy, Z. Z. Li, Nature 387, 481 (1997).
- [10] D. M. Broun, D. C. Morgan, R. J. Ormeno, S. F. Lee, A. W. Tyler, A. P. Mackenzie, and J. R. Waldram, to be published in Phys. Rev. B.
- [11] F. Zuo, D. Vacaru, H. M. Duan, and A. M. Hermann, Phys. Rev. B47, 5535 (1993).
- [12] F. Pardo, A. P. Mackenzie, F. de la Cruz, and J. Guimpel, Phys. Rev. B55, 14610 (1997).
- [13] A. P. Mackenzie, S. R. Julian, D. C. Sinclair, and C. T. Lin, Phys. Rev. B53, 5848 (1996).
- [14] A. Carrington, A. P. Mackenzie, D. C. Sinclair, and J. R. Cooper, Phys. Rev. B49, 13243 (1994).
- [15] M. S. Osofsky, R. J. Soulen, S. A. Wolf, J. M. Broto, H. Rakoto, J. C. Ousset, G. Coffe, S. Askenazy, P. Pari, I. Bozovic, J. N. Eckstein, and G. F. Virshup, Phys. Rev. Lett.71, 2315 (1993).
- [16] G. Kotliar and C. M. Varma, Phys. Rev. Lett.77, 2296 (1996).
- [17] J. R. Cooper, J. W. Loram, and J. M. Wade, Phys. Rev. B51, 6179 (1995).
- [18] A. S. Alexandrov, J. Ranninger, and S. Robaszkiewisz, Phys. Rev. B33, 4536 (1986); A. S. Alexandrov, Phys. Rev. B48, 10571 (1993).
- [19] M. Rasolt and Z. Tesanovic, Rev. Mod. Phys. 64, 709 (1992).
- [20] R. G. Dias and J. M. Wheatley, Phys. Rev. B50, 13887 (1994).
- [21] Y. N. Ovchinnikov and V. Z. Kresin, Phys. Rev. B52, 3075 (1995).
- [22] T. Koyama and M. Tachiki, Phys. Rev. B53, 2662 (1996).
- [23] A. J. Schofield, Phys. Rev. B51, 11733 (1995).
- [24] A. A. Abrikosov, Phys. Rev. B56, 446 (1997).
- [25] A. Carrington, A. P. Mackenzie, and A. W. Tyler, Phys. Rev. B54, R3788 (1996).
- [26] A. P. Mackenzie (unpublished).
- [27] V. G. Kogan, Phys. Rev. B38, 7049 (1988).
- [28] G. Blatter, V. B. Geshkenbein, and A. I. Larkin, Phys. Rev. Lett.68, 875 (1992).
- [29] A. Carrington, F. Bouquet, C. Marcenat, R. Calemczuk, and A. W. Tyler (unpublished).
- [30] A. W. Tyler, PhD Thesis, University of Cambridge (1997).
- [31] M. Tortonese, R. C. Barrett, and C. F. Quate, Appl. Phys. Lett. 62, 834 (1993); M. Tortonese, PhD Thesis, Stanford University (1993).
- [32] C. Rossel, P. Bauer, D. Zech, J. Hofer, M. Willemin, and H. Keller, J. Appl. Phys. 79, 8166 (1996).
- [33] Park Scientific Instruments, 1171 Borregas Ave., Sunnyvale, California 94089, USA.
- [34] R. G. Beck, M. F. Booth, D. E. Farrell, J. P. Rice, D. M. Ginsberg, Phil. Mag. B 65, 1373 (1992).
- [35] J. C. Martinez, P. J. E. M. van der Linden, L. N. Bulaevskii, S. Brongersma, A. Koshelev, J. A. A. J. Perenboom, A. A. Menovsky, and P. H. Kes, Phys. Rev. Lett.72, 3614 (1994).
- [36] L. N. Bulaevskii, M. Ledvij, and V. G. Kogan, Phys. Rev. Lett.68, 3773 (1992).
- [37] V. G. Kogan, M. Ledvij, A. Y. Simonov, J. H. Cho, and D. C. Johnston, Phys. Rev. Lett.70, 1870 (1993).
- [38] L. N. Bulaevskii and M. P. Maley, Phys. Rev. Lett.71, 3541 (1993).
- [39] M. Miljak, G. Collin, A. Hamzik, and V. Zlatic, Europhys. Lett. 9, 723 (1989).
- [40] Y. Shimakawa, Physica C 204, 247 (1993).
- [41] W. C. Lee, R. A. Klemm, and D. C. Johnston, Phys. Rev. Lett.63, 1012 (1989); W. C. Lee and D. C. Johnston, Phys. Rev. B41, 1904 (1990).
- [42] M. Miljak, V. Zlatic, I. Kos, J. D. Thompson, P. C. Canfield, and Z. Fisk, Solid State Comm. 85, 519 (1993).
- [43] V. Vulcanescu, L. Fruchter, A. Bertinotti, D. Colson, G. Lebras, and J. F. Marucco, Physica C 259, 131 (1996).
- [44] D. E. Farrell, R. G. Beck, M. F. Booth, C. J. Allen, E. D. Bukowski, and D. M. Ginsberg, Phys. Rev. B42, 6758 (1990); D. Zech, J. Hofer, H. Keller, C. Rossel, P. Bauer, and J. Karpinski, Phys. Rev. B53, R6026 (1996); D. Zech, C. Rossel, L. Lesne, H. Keller, S. L. Lee, and J. Karpinski, Phys. Rev. B54, 12535 (1996).
- [45] G. Blumberg, M. S. Kang, and M. V. Klein, Phys. Rev. Lett.78, 2461 (1997).
- [46] C. Rossel (private communication).
- [47] C. W. Yuan, E. Batalla, M. Zacher, A. L. Delozanne, M. D. Kirk, and M. Tortonese, Appl. Phys. Lett. 65, 1308 (1994)