On-chain electrodynamics of metallic (TMTSF) salts: Observation of Tomonaga-Luttinger liquid response
Abstract
We have measured the electrodynamic response in the metallic state of three highly anisotropic conductors, (TMTSF), where = PF6, AsF6, or ClO4, and TMTSF is the organic molecule tetramethyltetraselenofulvalene. In all three cases we find dramatic deviations from a simple Drude response. The optical conductivity has two features: a narrow mode at zero frequency, with a small spectral weight, and a mode centered around 200 cm-1, with nearly all of the spectral weight expected for the relevant number of carriers and single particle bandmass. We argue that these features are characteristic of a nearly one-dimensional half- or quarter-filled band with Coulomb correlations, and evaluate the finite energy mode in terms of a one-dimensional Mott insulator. At high frequencies (, the transfer integral perpendicular to the chains), the frequency dependence of the optical conductivity is in agreement with calculations based on an interacting Tomonaga-Luttinger liquid, and is different from what is expected for an uncorrelated one-dimensional semiconductor. The zero frequency mode shows deviations from a simple Drude response, and can be adequately described with a frequency dependent mass and relaxation rate.
pacs:
PACS numbers: 78.20.-e, 71.10.Pm, 75.30.FvI Introduction
Since their first synthesis in the late 1970s, [3] the (TMTSF) family of linear-chain organic conductors, and the closely related TMTTF family, has attracted continual attention. While the various broken symmetry ground states, including spin density waves, charge density waves, spin Peierls, and even superconductivity have been extensively explored over the last two decades, [4, 5, 6] much of the current attention is now focused on the metallic state. These compounds have become one of the prototypical testing grounds for the study of the effects of electron–electron interactions in one-dimensional (1D) structures. In a strictly 1D interacting electron system, the Fermi liquid (FL) state is replaced by a state in which interactions play a crucial role, and which is generally referred to as a Tomonaga-Luttinger liquid (TLL).
Fortunately, well defined techniques to treat such interactions exist in one dimension, and the physical properties of the TLL are well characterized and understood. [7, 8, 9] It is thus crucial to know how well the properties of the organic conductors are described by this TLL theory. The answer to this question is not clear from the outset because of the quasi-one-dimensional nature of the compounds. Due to interchain hopping, or interchain electron–electron or electron–phonon interactions, such materials are never strictly one-dimensional. In particular, although one expects the 1D theory to hold at high temperature, at lower temperatures the interchain hopping is expected to drive the system toward a more isotropic (2D or 3D) behavior. These compounds are thus ideal candidates for a study of the dimensionality crossover between a non-Fermi liquid regime (TLL in this case) and a more conventional Fermi liquid state. Whether or not the low temperature phase is a FL, and the value of the expected crossover temperature, are issues which have been widely debated. Questions have also been raised about the importance of the interactions, due particularly to the important success of simple mean-field theories in explaining the properties of the low temperature condensed phases.
In the materials which we discuss in this paper, the Bechgaard salts, charge transfer of one electron from every two TMTSF molecules leads to a quarter-filled (or half-filled due to dimerization) hole band, thus enhancing the importance of umklapp scattering. Such a state would be a Mott insulator in one dimension. As pointed out above, however, these materials are only quasi-one-dimensional, having two different finite interchain hopping integrals in the two transverse directions. Such an interchain coupling, however, becomes ineffective at high enough temperatures or frequencies, and thus we would expect the 1D physics to dominate in this regime. While in many of these materials the high temperature dc conductivity has an essentially metallic character, the finite frequency response is distinctly non-Drude.
In this paper we report on measurements of the electrodynamic response of three members of the (TMTSF) family of charge-transfer salts ( = PF6, AsF6, and ClO4), with the goal of studying the nature of the metallic state in these quasi-1D conductors. In this regime, all three compounds exhibit behavior which cannot be described as the response of a simple Drude metal. In particular, two distinct features appear in the optical conductivity , one at zero frequency and one at finite frequency. In Sec. II we discuss the sample growth techniques along with the experimental methods and results. Theoretical analysis of both modes which appear in the conductivity is presented in Sec. III. Finally in Sec. IV we conclude with a discussion of the experimental and theoretical results and the implications of our findings with regard to an understanding of the dynamics of quasi-1D systems.
A number of previous studies have investigated the electrodynamic response of various Bechgaard salts, but all covered only a portion of the spectral range presented in this paper, thus giving only a partial description of the complete response of these systems. [10, 11, 12, 13, 14, 15, 16, 17, 18, 19] In addition, the small size of crystals previously available precluded the use of single crystals at all but the highest frequencies. As a result, all of the earlier work was done on composite samples, mosaics formed by aligning multiple crystals next to each other in order to produce an optical face. Indeed, our own initial work on these compounds was done in this way as well. [20, 21] However, as will be presented below, we have recently developed a method of growing single crystals of the Bechgaard salts with large transverse dimensions, yielding samples with appreciable optical faces in the a-b plane. Consequently, unlike any previous work, the results presented in this paper were all obtained on single crystals, even at the lowest frequencies. This has allowed us to avoid all of the complications and spurious results arising from the mosaic samples.
II Experimental methods and results
A Sample preparation
Many of the measurements presented here were made possible by our ability to grow large single crystals of the Bechgaard salts. The strong anisotropy of the electronic structure tends to lead to long needle-like crystals, with typical transverse dimensions of less than 0.5mm. In order to perform high quality optical measurements it is necessary to have large crystal faces. This was historically obtained by aligning multiple needle-like crystals into mosaics. This method introduced uncertainty into the measurements due to misalignment of the crystals, gaps between the crystals, and diffraction effects from the composite sample.
The large single crystals used in this study were grown by the standard electrochemical growth technique,[3] but at reduced temperature (C) and at low current densities. These conditions produce a slow growth rate and, over period of four to six months, single crystals up to mm3. These large, high-quality crystal faces in the a–b′ plane allowed us to perform reliable measurements of the electrodynamic response of these materials both parallel () and perpendicular () to the highly conducting chain axis down to low frequencies. The use of such crystals led to significant enhancement of the accuracy obtained for the optical reflectivity. In this paper we will focus on our results along the chains, some of which have been published previously.[22] Our findings regarding the conductivity perpendicular to the chains have been presented, [23] and will be discussed further in a future publication. [24]
B Experimental techniques and analysis
By combining the results from various different spectrometers in the microwave, millimeter, submillimeter, infrared, optical, and ultraviolet frequency ranges, we have obtained the electrodynamic response of these Bechgaard salts over an extremely broad range (0.1–105 cm-1). In the optical range from 15 cm-1 to cm-1 standard polarized reflectance measurements were performed employing four spectrometers with overlapping frequency ranges. Two grating spectrometers were employed at the highest frequencies: a McPherson spectrometer in the ultraviolet, and a home-made spectrometer based on a Zeiss monochromator in the visible. In the infrared spectral range two Fourier transform interferometers were used with a gold mirror as the reference. From the far-infrared up to the mid-infrared a fast scanning Bruker IFS48PC spectrometer was employed, while in the far-infrared we also made use of a Bruker IFS113v spectrometer with a mercury arc lamp source and a helium-cooled germanium bolometric detector.
In the submillimeter spectral range (8–13 cm-1), we have used a coherent source spectrometer [25] based on backward wave oscillators, [26] high power, tunable, monochromatic light sources with a broad bandwidth. These oscillators operate at frequencies below those accessed by a typical infrared spectrometer, and above the millimeter wave range, thus filling in an admittedly narrow, but important, gap in energy between these two more widely studied regions. This spectrometer was originally designed for transmission measurements and we have reconfigured it for reflection measurements on highly conducting bulk samples. The reflection coefficient is obtained by comparing the signals reflected from the sample and from a polished aluminum reference mirror, where the reflectivity of aluminum was calculated from the dc conductivity by the Hagen-Rubens relation[27]
| (1) |
This expression is valid for , and in this limit .
At all frequencies up to and including the mid-infrared, we placed the samples in an optical cryostat and measured the reflectivity as a function of temperature between 5K and 300K. In the case of (TMTSF)2PF6 these reflectivity data were combined with previous measurements in the microwave and millimeter wave spectral range [20, 21] which were made by the use of a resonant cavity perturbation technique.[28] In this method, the surface impedance of the material can be measured by placing a needle shaped crystal in an anti-node of either the electric or magnetic field of a cylindrical cavity in the TE011 mode and measuring the change in width () and center frequency () of the resonance. It is then possible to calculate both the surface resistance and the surface reactance as follows:
| (2) |
where s/cm is the impedance of free space ( in SI units). The resonator constant can be calculated from the geometry of the cavity and the sample. [28]
The complex conductivity () can be calculated from the surface impedance using , and the absorptivity is given by the relation
| (3) |
where is the reflectivity. In the limit , Eq. (3) reduces to
| (4) |
By using Eq. (4) it is possible to combine these microwave and millimeter wave cavity data with all of the higher frequency reflectivity data. In general, the reflectivity is a complex function . The reflectivity which we measure is actually the square of this quantity, . In order to obtain the phase we have performed a Kramers-Kronig analysis on the reflectivity spectra: [29]
| (5) |
where the term has been added to the standard form in order to remove the singularity at . It has no effect on the integral because . Because this integral extends from zero to infinity, it is necessary to make suitable high and low frequency extrapolations to the measured reflectivity data. We have chosen to use a power law at high frequencies () and a Hagen-Rubens extrapolation, as given in Eq. (1), to zero frequency. From and it is then possible to calculate the components of the complex optical conductivity .
C Experimental results
The dc resistivities of the Bechgaard salts (TMTSF) (=PF6, AsF6, ClO4) measured along their highly conducting chain axes exhibit metallic temperature dependence at high temperatures. [6, 30, 31] In addition, all three compounds exhibit a sharp phase transition near 10 K, and a thermally activated behavior of the resistivity below this temperature. It has been established that the ground state in each of these materials is a spin density wave (SDW), [32] with transition temperatures of 12K for the PF6 and AsF6 compounds, and 6K for ClO4. [4, 5] The insulating behavior results from an opening of a gap in the single particle excitation spectrum at the Fermi level due to electron–electron interactions.
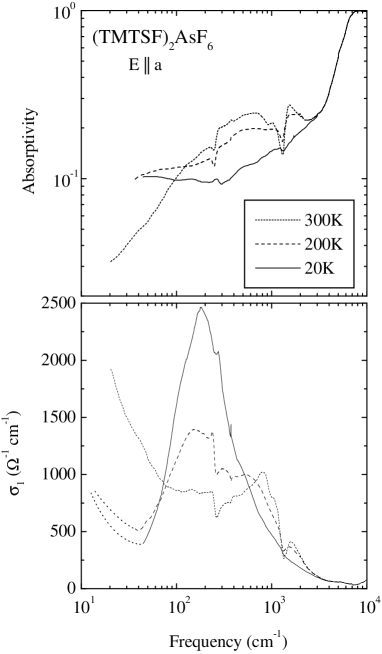
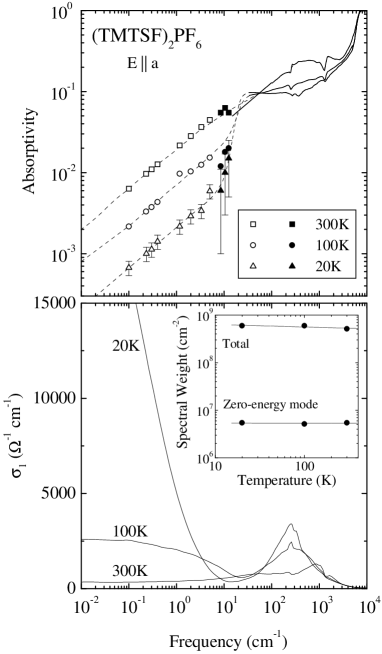
Figures 1–3 show the measured absorptivities as a function of frequency at various temperatures for each of the compounds, and the conductivities calculated by use of the Kramers-Kronig relation, as described above. Unlike the response of a simple metal, the frequency dependent conductivities of these compounds cannot be described by a single Drude term of the form
| (6) |
where is the dc conductivity, is the plasma frequency, and is the scattering rate of the carriers with bandmass and number density . Instead the spectrum exhibits two distinct features. The high dc conductivities are associated with a very narrow mode, centered at zero energy (ZE). In addition there is a second finite energy (FE) excitation centered near 200 cm-1. The combined spectral weight of these two modes is given by
| (7) |
and leads to a total plasma frequency . As is shown in the inset of Fig. 1b, this total spectral weight is independent of temperature, as is expected. In addition, the value is in full agreement with that obtained from the known carrier concentration and a bandmass . [6]
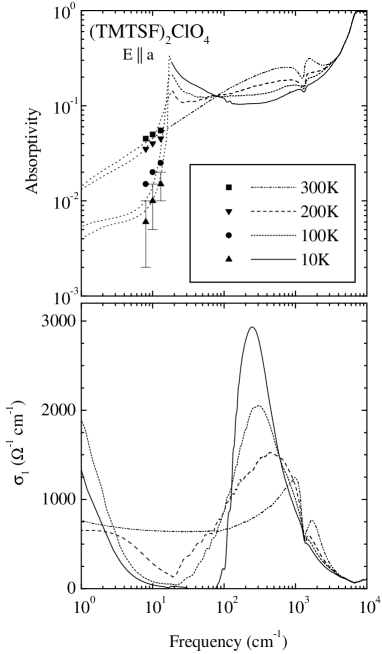
Figure 1b also demonstrates that most of the spectral weight resides in the finite energy mode, with only about 1% in the zero energy mode, independent of temperature. This value can be calculated in two ways. The contribution of the finite energy mode can be subtracted from the conductivity, and the remaining zero energy mode can be integrated. This approach gives . Alternately, the zero crossing of the dielectric constant, when corrected for the higher frequency contributions from the finite energy mode, gives a plasma frequency of approximately , at all temperatures where this mode is clearly defined. [22] This rather unusual two-structure response is the focus of the work presented here. We discuss the structure and possible origins of these two excitations separately in the following sections, although it is our belief that they result from the same underlying interactions within these materials.
III Theoretical analysis
A Overview
Before turning to the various excitations observed in the optical spectrum, we discuss the overall features: the appearance of both a zero-energy and finite-energy excitation, with most of the spectral weight associated with the latter. This unusual behavior of the conductivity makes it unlikely that it can be described by a conventional explanation in terms of a weakly interacting (or Fermi liquid-like) description.[33] Such a description would hardly be consistent with the fact that of the spectral weight is contained in the finite frequency mode around 200 cm-1.
In order to analyze this structure one has to remember that the (TMTSF) family is a good realization of a quasi-one-dimensional electron system with some hopping between chains, and to compare the behavior of two isostructural groups of organic conductors, the (TMTTF) and (TMTSF) salts. The (TMTSF) salts have a larger interchain hopping than the (TMTTF) salts due to the larger overlap of the molecular orbitals in the direction perpendicular to the chains. Various estimates of the transfer integrals in the TMTSF family lead to the following values along the three directions: [6] , , = 250meV, 25meV, 1meV. Although the chains are coupled by an interchain hopping , such an interchain coupling becomes ineffective at high temperatures or frequencies, and above a certain energy scale the system possesses a one-dimensional character. The naive value for is , but interactions can renormalize this value downwards, leading to a wider one-dimensional regime.[34, 35]
In both cases, due to full charge transfer from the organic molecule to the counter ions, the TMTTF or TMTSF stacks have a quarter-filled hole band. There is also a moderate dimerization, which is somewhat more significant for the TMTTF family. Therefore, depending on the importance of this dimerization, the band can be described as either half-filled (for a strong dimerization effect) or quarter-filled (for weak dimerization). Due to the commensurate filling, a strictly one-dimensional model is expected to lead to a Mott insulating behavior. Indeed, the (TMTTF) salts, with = PF6 or Br, are insulators at low temperatures [6] with a substantial single particle gap ( cm-1 for the PF6 salt). For these compounds the gap is so high that the interchain hopping is suppressed by the insulating nature of the 1D phase and is not relevant.
For the TMTSF family, however, one expects a stronger competition between the Mott gap and the interchain hopping. In a very crude way, the interchain hopping could be viewed as an effective doping leading to deviations from the commensurate filling (which is insulating). The optical features we observe are close to those which have been calculated for a doped one dimensional Mott insulator: [36, 37, 38] a Mott gap and a zero-energy mode for small doping levels. Of course for the low energy mode, this is an oversimplified view, since the interchain hopping makes the system two dimensional, and the low energy feature is unlikely to be described by a simple one dimensional theory.
We now discuss in detail the two distinct features observed in the optical conductivity. While it is clear from Figs. 1–3 that these two features develop progressively as the temperature is lowered, we will focus our attention on the lowest temperatures (10–20K), just above the phase transitions to broken-symmetry ground states.
B Finite-energy mode
As discussed above, the naive upper limit for the crossover from 1D to 2D or 3D nature is cm-1, and therefore the peak structure in the conductivity should be well described by a purely one-dimensional theory. In such a 1D regime the effects of electron–electron interactions are particularly important and lead to the formation of a non-Fermi liquid state, the so-called Tomonaga-Luttinger liquid (TLL). [7, 8, 9] Such a state is characterized by an absence of single electron-like quasiparticles and by a non-universal decay of the various correlation functions. All of the excitations of the system, even the single particle excitations, can be described in terms of charge density fluctuations, whose energy is given by
| (8) |
where , the charge density, and is the conjugate momentum to . All of the interaction effects are hidden in the parameters (the velocity of charge excitations) and (the Luttinger liquid exponent controlling the decay of all correlation functions). Initially derived for interactions much weaker than the bandwidth, [7, 8] this description has been proven to be valid for an arbitrary one-dimensional interacting system, [9] provided one uses the proper and . The TLL description can be viewed as an effective low energy description of the one-dimensional electron gas, which is reminiscent of FL theory as a low energy description of the three-dimensional interacting electron gas (with quite different physics). The above Luttinger liquid parameters can be viewed as the 1D equivalents of the Landau parameters of a FL. In a general way, is the noninteracting point, with corresponding to attraction and to repulsion.
Depending on the interaction strength, the TLL may be unstable for commensurate fillings, causing the system to become a Mott insulator, with a charge gap. [7, 8, 39] The mechanism leading to this insulating state is now well understood and can be easily described within the TLL formalism. When the filling is commensurate, interactions give rise to additional contributions to the TLL Hamiltonian. These are the so-called umklapp processes of the form
| (9) |
where is the order of the commensurability ( for half filling – one particle per site [7, 8, 36]; for quarter filling – one particle every two sites, and so on [37, 40, 41]). The coupling constant is the umklapp process corresponding to the commensurability . The commensurability of order is relevant provided (the higher the commensurability the more repulsive the interaction has to be). When the umklapp term is relevant it opens a gap in the charge spectrum of the form
| (10) |
for much less than the bandwidth .
This is the relevant situation to describe the organic compounds because the band is quarter-filled. A quarter-filling umklapp thus exists with a coefficient of order , for a typical interaction of order and a bandwidth of order . However, because the chains are slightly dimerized, a half-filled umklapp is also generated with a value on the order of where is the dimerization gap.[42] Which umklapp term dominates depends, of course, on the strength of the interactions, on (also controlled by the interactions), and on the magnitude of the dimerization gap. This 1D insulator picture thus provides a good description of the gross features observed in the conductivity. The peak corresponds to the Mott gap and would also be consistent with finding most (or all, if the system was a purely one-dimensional Mott insulator) of the spectral weight in the finite frequency peak.
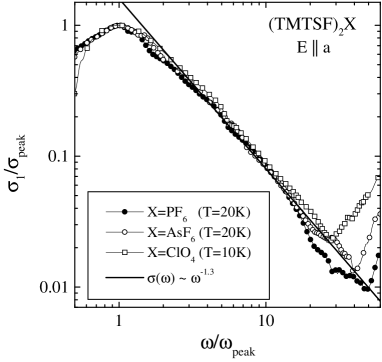
Because a complete description of the dynamic conductivity in such a one-dimensional Mott insulator exists, [36, 37, 40] one can make quantitative comparisons of the data to the theoretical predictions. The salient feature is a nonuniversal power law behavior controlled by the interactions for :
| (11) |
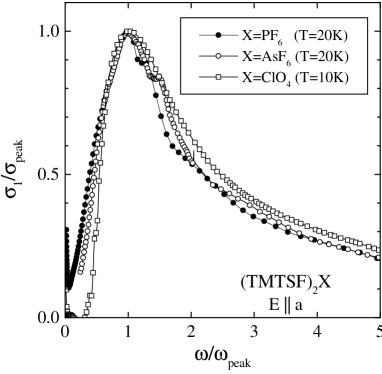
Besides providing a good test of the one-dimensional theory, a fit of the data to the form of Eq. (11) gives direct access to the Luttinger liquid exponent . We will come back to the determination of and the physical consequences in Section IV, and confine the current discussion to a direct analysis of the data. Indeed when rescaled by the Mott gap, the three systems (=ClO4, PF6, and AsF6) exhibit remarkably similar behavior, as demonstrated in Fig. 4. A log–log plot of the data for the three different systems is shown in Fig. 5. The agreement with the prediction of the one-dimensional theory is quite good over more than one decade in frequency, leading to an exponent . The observed power law in the frequency dependence is also in very reasonable agreement with the observed temperature dependence of the resistivity, which is found to be roughly linear above 100K once thermal expansion has been taken into account. [30] Indeed in a purely 1D model, the temperature dependence of the resistivity is given by [36, 37, 40]
| (12) |
and thus the frequency and temperature dependence should be related by
| (13) |
with no undetermined adjustable parameter. Although a precise determination of the temperature exponent is difficult because of thermal expansion and the possibility of other sources of scattering, Eq. (13) is again consistent with the data.
It thus seems very natural to interpret the high frequency part of the optical conductivity in terms of a Mott insulator. The observed Mott gap would be rather large ( because the optical gap is twice the thermodynamic one). Due to the apparent contradiction of having a rather large Mott gap and a good metallic dc conductivity, it was proposed that the peak structure was due to the dimerization gap itself. [43, 44]. This would indeed be the case for an extremely strong (nearly infinite) repulsion, with the quarter-filled band being transformed into a half-filled band of (nearly non-interacting) spinless fermions. It was then argued that the real charge gap of the problem was smaller, on the order of K. However, such an interpretation fails to reproduce the observed frequency dependence above the peak in conductivity. Using the same type of analysis for the conductivity as in Ref. [36], and attributing the peak to the dimerization gap, results in for , as in a simple semiconductor (corresponding to nearly free spinless fermions). The observed power-law (see Fig. 5) differs significantly from this prediction, making such an interpretation of the data very unlikely.
As mentioned in Section III A, there is in fact no contradiction between a good metallic dc conductivity and a large Mott gap, provided that the system is doped slightly away from commensurate filling. [37] Indeed, in a very crude way this is what seems to be observed here, with the “Drude” peak containing only one hundredth of the carriers. Although no real doping exists from a chemistry point of view, one could attribute such a deviation from commensurability to the effects of interchain hopping. If single particle hopping between chains is relevant, small deviations from commensurate filling due to the warping of the Fermi surface exist, and should lead to effects equivalent to real doping on a single chain. Of course, such a picture is only a poor man’s way of viewing the low frequency structure. Since the interchain hopping is relevant, the low frequency peak should in principle be described by a full two-dimensional theory (of interacting fermions). Due to the complexity of such a problem, it is thus interesting to compare, from a purely phenomenological point of view, the shape of the observed Drude peak with FL predictions as well as with the predictions of the naive one-dimensional theory of a doped Mott insulator. Such a comparison is performed in the next section.
C Zero-energy mode
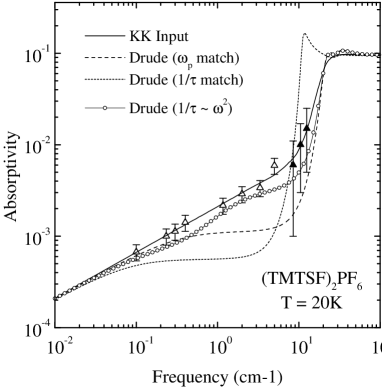
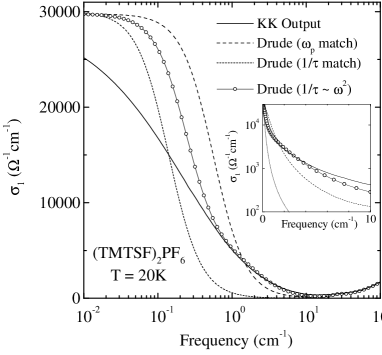
The model presented in Sec. III predicts the appearance of a delta function dc conductivity in a 1D Hubbard system which is doped away from half-filling. As we have demonstrated, the finite frequency mode which develops in these materials is in agreement with such a model, and we do indeed see a corresponding peak in the conductivity at zero frequency. This extremely narrow resonance leads to the high dc conductivities seen in these materials, yet it accounts for only 1% of the total spectral weight, as demonstrated in the inset of Fig. 1b. A similar peak, with an even smaller fraction of the spectral weight, has recently been reported in (TMTSF)2ClO4. [19] Qualitatively, this mode looks like a narrow Drude response, of the form given in Eq. (6), but our data on the (TMTSF)2PF6 compound indicate that this is not the case. The two dashed lines in Figs. 6 and 7 show fits to the low frequency data with a simple Drude form. In these two fits, either the spectral weight ( cm-1) or width (1/ cm-1) of the mode was matched and the other was chosen in order to make the fit meet the measured dc conductivity value of (cm)-1. It is clear that neither gives a satisfactory fit to either the conductivity or absorptivity.
Although this analysis depends strongly on the microwave cavity perturbation data between 0.1 and 5 cm-1, this technique is well developed and produces reliable data even for such highly conducting materials. [28] In addition, at 9 GHz a number of other measurements [45, 46, 47, 48] of the surface resistance have been made and all agree with our results within the experimental uncertainty shown on Fig. 6. Musfeldt et al. [49] have also measured this compound in a 16.5 GHz cavity. From their data we have calculated an absorptivity of approximately , which is significantly higher than we have found, in even greater disagreement with the two simple Drude fits. Finally, at 60 GHz we were able to measure both and in the maxima of both the electric and magnetic fields [28] and have found that within experimental error they are equal to each other and to the dc resistivity at 20K. [21] We are certain that the discrepancies between the measured data and the simple Drude fits, especially at the higher frequencies, are outside of the experimental uncertainty.
Similarly, it is clear that neither the low energy mode nor the conductivity below the Mott gap can be described quantitatively by a simple one-dimensional theory, even taking into account a phenomenological doping. Indeed, in a purely 1D theory the conductivity should grow as between the Drude peak and the Mott peak, [37, 40] but such a power is not observed experimentally. In addition, in a doped one-dimensional system the width of the peak remains extremely narrow since all electron–electron scattering that can lead to dissipation has been shifted to higher energy.
In order to obtain a satisfactory description of these low frequency data, it thus seems necessary to turn to a Fermi liquid (FL) picture. [50] Let us introduce a complex frequency dependent scattering rate into the standard Drude form of Eq. (6). If we define the dimensionless quantity then the complex conductivity can be written as
| (14) |
where is the frequency dependent enhanced mass. By rearranging Eq. (14) we can write expressions for and in terms of and as follows:
| (15) |
| (16) |
Due to causality, [51] and are related through the Kramers-Kronig relation. [29] Such analysis, which allows us to look for interactions which would lead to frequency dependent scattering rates, has been used before in studying the response of heavy fermion compounds [52] and high temperature superconductors. [53]
The Landau FL theory [50] predicts that the scattering rate due to electron–electron interactions in three dimensions should be quadratic in both temperature and frequency. [53, 54] In order to examine the shape of the Drude-like peak observed in the data, we have adopted the following phenomenological forms of and , used by Sulewski et al. in their study of the FL behavior of the heavy fermion compound UPt3: [52]
| (17) |
and
| (18) |
where and are the zero frequency scattering rate and mass enhancement, respectively. These expressions obey the Kramers-Kronig relation and have the proper FL frequency dependence. We have performed a fit to our 20K data on (TMTSF)2PF6 using these forms of and and Eq. (14). This result is shown by the lines with open circles on Figs. 6 and 7, with cm-1, cm-1, cm-1 and . It is clear from the absorptivity that this is a significantly better representation of the measured data than either of the two simple Drude fits shown by the dashed lines. In addition, above 0.5 cm-1 this fit is in excellent agreement with the conductivity obtained from the Kramers-Kronig calculation. The differences at lower frequencies are a result of the perfectly straight interpolation between the microwave absorptivity points, shown by the solid line. It is clear that within the error bars, the FL fit is an equally good interpolation. It should also be pointed out that the results are shown on a logarithmic frequency scale, which tends to enhance the low frequency range. The inset of Fig. 7 displays the Kramers-Kronig calculation and the fits on a linear frequency scale, showing the obvious improvement obtained with the generalized Drude fit.
This analysis, however, leads to an anomalously small value for , as frequency dependent scattering is not expected at frequencies significantly less than the temperature (cm-1 at 20K). In addition, Ruvalds and Virosztek have shown that nesting of the Fermi surface modifies the electron–electron scattering and leads to a scattering rate which is instead linear in both frequency and temperature. [53] Because of the nesting of the Fermi surface in the (TMTSF) compounds, [6] we might expect such a form to apply in this case, however our attempts to fit the (TMTSF)2PF6 data with their form have proven to be unsatisfactory, giving only a small improvement over the simple Drude fits. Further experiments at low frequencies could clarify these issues.
IV Discussion
The behavior of the optical conductivity described above raises several interesting questions. Previous attempts to interpret some features of the TMTSF and TMTTF materials in terms of one-dimensional systems close to a Mott transition were confined to a qualitative description of the differences between these two families. [42] It was generally argued that only the half-filling umklapp is important, and that the differences between the TMTTF and the TMTSF families are due to the much smaller dimerization in the latter case, leading to a smaller , and to the observed metallic dc behavior. The quarter-filling umklapp was not considered because it was beyond the reach of the perturbative techniques used at that time. Now, non-perturbative calculations of the frequency dependence of the conductivity [36, 37] enable us to investigate the consequences of attributing the Mott gap to either of these two umklapps.
If one interprets the high frequency behavior in terms of a one-dimensional Mott insulator, two possibilities arise depending on whether the half- or quarter-filled umklapp is dominant. In the former case, one would have leading to a rather weak repulsive system with . The standard perturbative formula, , leads to relatively small interactions of strength . Such a small value of the interaction would pose several problems. It is in disagreement with simple estimates based on quantum-chemistry calculations [55] or estimations of the interactions in the spin sectors [56](there is no a priori reason to assume that interactions would cancel in the charge sector). In addition, since the gap opened by the half-filled umklapp would be given by
| (19) |
the rather small half-filled umklapp constant , where is the dimerization gap, and the rather large exponent would lead to an exceedingly small value for the Mott gap, incompatible with the observed peak in the optical conductivity of Figs. 1–3.
Thus the Mott gap seen in the optical conductivity is unlikely to be due to the half-filling umklapp. As suggested in the context of the temperature dependence of the conductivity, [37] a way out of this problem is to assume that the conductivity is dominated by the quarter-filled umklapp. In that case the exponent of the frequency dependence is , leading to a much smaller value of . Such a small value of corresponds to a relatively large repulsion. The existence of such large repulsion is consistent with the initial hypothesis of predominance of the quarter-filling umklapp. In that case can be of order one since , whereas , being due to dimerization, would still be much smaller than the typical interaction (by a factor ). Such a small value of also gives a density of states exponent , in reasonable agreement with photoemission observations. [57, 58] However the photoemission results should be taken with some degree of care, due to the large range of energy over which the TLL behavior was observed. The Mott gap due to the quarter-filled umklapp would be given by an analogous formula to Eq. (19) with and . The numerical value of the exponent would remain unchanged, but because the interactions are now allowed to be larger, can be closer to , allowing for reasonably large values of the Mott gap. It is of course not obvious that one can get such a small value of for the TMTSF family from reasonable microscopic interactions. This is probably not a serious problem, however, since the range of the interaction is more important than the strength in getting a small (a purely local repulsion cannot get below ). Although a direct calculation of from a microscopic model is too strongly dependent on the precise details of the model to be really quantitative, the order of magnitude of an interaction needed to get is not incompatible with what is expected microscopically, [55] or estimated from the uniform susceptibility. [56]
The interpretation of the optical conductivity in terms of quarter-filling umklapp, although quite different from the standard view, [42] thus seems more reasonable. However it has also its share of problems and raises interesting issues. First, if the quarter-filling umklapp plays an important role in the TMTSF family it is likely to also play a role in the parent TMTTF family. The dimerization gap differs by a mere factor of two between the two families, and it would be surprising if this simple enhancement of the constant would make it dominate over (which is not expected to change much).
The question is of importance because, until now, the different behavior of the dc conductivity between the two families has been attributed to the change in the dimerization. [42] The reduction of dimerization with pressure was supposed to reduce and hence the Mott gap. If the dominant umklapp process is the quarter-filling one this explanation cannot continue to hold because is expected to be only weakly pressure dependent. However, experimentally one still observes a large difference in the Mott gap between the two families. One possible explanation for the large change of gap under pressure (or by changing the family) could be the change in the exponent of Eq. (19), i.e. a change of and not so much a change of the umklapp coupling constant, as is usually advocated. Indeed, since is close to the value where the umklapp term is irrelevant, even a small change in can produce a relatively large variation in the gap (the gap would go to zero for ).
The main problem of such a small value of would be its effect on the interchain hopping. Using the standard formula for the renormalization of the transverse hopping due to interactions [34, 35] would give an effective hopping between the chains
| (20) |
where is the density of states exponent. A value of gives , leading to a small crossover value, on the order of 30K, between the one-dimensional regime and a regime where the hopping between the chains is relevant. Such a low crossover scale was indeed the one advocated based on both NMR [56] and magnetoresistance experiments. [59] However, such a small value of the effective interchain hopping is incompatible with several observations.
First the temperature dependence of the dc conductivity shows a crossover between a roughly linear behavior, that can be interpreted in terms of a one-dimensional regime, to a regime at a scale of 150–200 K. [30] It is very natural to interpret such a change of behavior in terms of a crossover to a more two-dimensional regime, where the interchain hopping is relevant, leading to K. Such a value is in good agreement with measurements of the transverse conductivity that provide a very sensitive way of probing this dimensional crossover, [60, 61] and with direct low temperature measurements of . [62] Second, although it is quite difficult to extract the crossover scale from the optical or dc conductivity along the chains alone, the behavior of the optical conductivity below the Mott peak does not follow the prediction () of a purely one-dimensional model very well. [36, 37] This again suggests a crossover towards two-dimensional behavior at an energy scale on the order of K. Third, on a more theoretical level, if the Mott gap was much higher than the effective interchain hopping, the system would remain one-dimensional [42, 59] and thus insulating. [37] A small value of is thus again incompatible with the observed metallic behavior at low frequency. Paradoxically, the observed crossover scale K would be compatible with Eq. (20), if the value of corresponding to the half-filling umklapp was used, namely very weak interactions, but as we saw above such a value of seems incompatible with other observations.
Below an energy scale on the order of 200 K, the system would therefore be in a two-dimensional regime. The analysis of Sec. III C, suggests the possibility that at low frequencies and temperatures the behavior in this regime is that of a simple FL. Such behavior is reasonable, and in agreement with the results of NMR measurements at low temperatures. [56] However, the precise nature of the phase below the 1D to 2D crossover temperature still remains to be clarified, in particular at intermediate temperatures and frequencies. Proposals have been made about the existence of a two-dimensional Luttinger liquid with power law correlation functions. [63] Whether the experimentally observed phase is of such nature remains to be checked. Some quantities, however, show a simple exponent (e.g. ), which is quite incompatible with the suspected power-law dependence of the hypothetical two-dimensional Luttinger liquid.
V Conclusions
In this paper we have presented the results of our measurements of the on-chain, metallic state electrodynamics of three Bechgaard salts, (TMTSF). In all three cases, we find dramatic deviations from the simple Drude response, with the frequency dependent conductivity instead consisting of two distinct features: a narrow mode at low energy containing a very small part of the spectral weight () and a high energy mode centered around 200 cm-1. We have argued that these are the characteristics of a highly anisotropic interacting electron system, with either a half- or quarter-filled band. This leads to a Mott gap and, at frequencies above the effective interchain transfer integral, to a Luttinger liquid state — consequently we call this a Mott-Tomonaga-Luttinger liquid.
The finite energy feature can be successfully described as the absorption above the Mott gap in such a one-dimensional Luttinger liquid. In particular, above the gap the optical conductivity behaves as a power law of the frequency , in a way characteristic of a TLL. The exponent is determined experimentally to be . The low energy feature in the conductivity can be successfully described by using a frequency dependent relaxation rate and effective mass with quadratic frequency dependence, suggestive of a Fermi liquid. However, further studies are needed at these low energies in order to rule out other mechanisms.
Comparison of the data with the TLL theory, along with the value of the exponent , suggest that the dominant mechanism responsible for the opening of the Mott gap is the quarter-filling of the band. This conclusion leads to a Luttinger liquid parameter , corresponding to very strong repulsion. The fact that the 1D theory is unable to account quantitatively for the data below the high energy peak seems to suggest that the crossover to a two-dimensional regime occurs at relatively high energies.
Although the conductivity at low frequencies is in agreement with that arising from electron–electron scattering, and at high frequencies with predictions based on the TLL model, a host of unresolved questions remain. These include the precise nature of this crossover, and the magnitude of the effective transfer integral where it occurs. It also remains to be seen whether our experiments are compatible with studies which directly probe the Fermi surface of these compounds. Experiments along directions perpendicular to the chains, together with optical studies on the more anisotropic TMTTF compounds, should help to clarify these unresolved questions, and are currently underway.
Acknowledgements.
We would like to thank S. Donovan for all of his work on this topic, B. Alavi for preparation of the large single crystals used in this work, B. Gorshunov and Y. Goncharov for their assistance with the submillimeter measurements, and F. Mila, P. Chaikin, D. Jérome, M. Gabay, and C. Berthier for helpful discussions. L.D. and V.V. would like to thank the Swiss National Foundation for Scientific Research for important financial support. The work at UCLA was supported by NSF Grant No. DMR-9503009.REFERENCES
- [1] Present address: Center for Superconductivity Research, Department of Physics, University of Maryland, College Park, MD 20742-4111. Electronic address: schwartz@squid.umd.edu
- [2] Present address: Erstes Physikalisches Institut, Universität Stuttgart, D-70550 Stuttgart, Germany.
- [3] K. Bechgaard, C.S. Jacobsen, K. Mortensen, H.J. Pedersen, and N. Thorup, Solid State Commun. 33, 1119 (1980).
- [4] G. Grüner, Rev. Mod. Phys. 60, 1129 (1988).
- [5] G. Grüner, Density Waves in Solids (Addison-Wesley, Reading, MA, 1994).
- [6] D. Jérome and H. J. Schulz, Adv. Phys. 31, 299 (1982).
- [7] V. J. Emery, in Highly Conducting One-Dimensional Solids, edited by J.T. Devreese, R.P. Evrard, and V.E. Van Doren (Plenum, New York, 1979), p. 327.
- [8] J. Sólyom, Adv. Phys. 28, 209 (1979).
- [9] F. D. M. Haldane, J. Phys. C 14, 2585 (1981).
- [10] C. S. Jacobsen, D. B. Tanner, and K. Bechgaard, Phys. Rev. Lett. 46, 1142 (1981).
- [11] K. Kikuchi, I. Ikemoto, K. Yakushi, H. Kuroda, and K. Kobayashi, Solid State Commun. 42, 433 (1982).
- [12] C. S. Jacobsen, D. B. Tanner, and K. Bechgaard, Phys. Rev. B 28, 7019 (1983).
- [13] H. K. Ng, T. Timusk, and K. Bechgaard, J. Phys. (Paris), Colloq. 44, C-867 (1983).
- [14] W. A. Challener, P. L. Richards, and R. L. Greene, Solid State Commun. 51, 765 (1984).
- [15] J. E. Eldridge and G. S. Bates, Mol. Cryst. Liq. Cryst. 119, 183 (1985).
- [16] H. K. Ng, T. Timusk, D. Jérome, and K. Bechgaard, Phys. Rev. B 32, 8041 (1985).
- [17] J. E. Eldridge and G. S. Bates, Phys. Rev. B 34, 6992 (1986).
- [18] K. Kornelsen, J. E. Eldridge, and G. S. Bates, Phys. Rev. B 35, 9162 (1987).
- [19] N. Cao, T. Timusk, and K. Bechgaard, J. Phys. I 6, 1719 (1996).
- [20] S. Donovan, L. Degiorgi, , and G. Grüner, Europhys. Lett. 19, 433 (1992).
- [21] S. Donovan, Yong Kim, L. Degiorgi, M. Dressel, and G. Grüner, Phys. Rev. B 49, 3363 (1994).
- [22] M. Dressel, A. Schwartz, G. Grüner, and L. Degiorgi, Phys. Rev. Lett. 77, 398 (1996).
- [23] L. Degiorgi, M. Dressel, A. Schwartz, B. Alavi, and G. Grüner, Phys. Rev. Lett. 76, 3838 (1996).
- [24] V. Vescoli, L. Degiorgi, M. Dressel, W. Henderson, A. Schwartz, B. Alavi, and G. Grüner (unpublished).
- [25] A.A. Volkov, Yu.G. Goncharov, G.V. Kozlov, S.P. Lebedev, and A.M. Prokhorov, Infrared Phys. 25, 369 (1985); A. Volkov, G. V. Kozlov, and A. M. Prokhorov, ibid. 29, 747 (1989).
- [26] R. F. Soohoo, Microwave Electronics (Addison-Wesley, Reading, MA, 1971).
- [27] J. M. Ziman, Principles of the Theory of Solids (Cambridge University Press, Cambridge, 1972).
- [28] O. Klein, S. Donovan, M. Dressel, and G. Grüner, Int. J. Infrared Millim. Waves 14, 2324 (1993); S. Donovan, O. Klein, M. Dressel, K. Holczer, and G. Grüner, ibid. 14, 2359 (1993); M. Dressel, O. Klein, S. Donovan, and G. Grüner, ibid. 14, 2389 (1993).
- [29] F. Wooten, Optical Properties of Solids (Academic Press, San Diego, 1972).
- [30] D. Jérome, in Organic Superconductors: From (TMTSF)2PF6 to Fullerenes, edited by J.-P. Farges (Dekker, New York, 1994), p. 405.
- [31] T. Sambongi, K. Nomura, T. Shimizu, K. Ichimura, N. Kinoshita, M. Tokumoto, and H. Anzai, Solid State Commun. 72, 817 (1989).
- [32] For the case of (TMTSF)2ClO4, the SDW transition occurs only if the material has been rapidly cooled through an anion ordering transition at 24 K. If it is slowly cooled, allowing the anions to order, then the SDW is suppressed and the material undergoes a superconducting transition at 1.2 K. See T. Ishiguro and K. Yamaji, Organic Superconductors (Springer-Verlag, Berlin, 1990), p. 48.
- [33] L.P. Gor’kov, Physica B 230–232, 970 (1997).
- [34] C. Bourbonnais and L. G. Caron, Int. J. Mod. Phys. B 5, 1033 (1991).
- [35] See, e.g., D. Boies, C. Bourbonnais, and A.-M.S. Tremblay, Phys. Rev. Lett 74, 968 (1995), and references therein.
- [36] T. Giamarchi, Phys. Rev. B 44, 2905 (1991).
- [37] T. Giamarchi, Physica B 230-232, 975 (1997).
- [38] M. Mori, H. Fukuyama, and M. Imada, J. Phys. Soc. Jpn. 63, 1639 (1994); M. Mori and H. Fukuyama, ibid. 65, 3604 (1996).
- [39] E. H. Lieb and F. Y. Wu, Phys. Rev. Lett. 20, 1445 (1968).
- [40] T. Giamarchi and A. J. Millis, Phys. Rev. B 46, 9325 (1992).
- [41] H. J. Schulz, in Strongly Correlated Electronic Materials: The Los Alamos Symposium 1993, edited by K.S. Bedell et al. (Addison-Wesley, Reading, MA, 1994).
- [42] V. J. Emery, R. Bruinsma, and S. Barisic, Phys. Rev. Lett. 48, 1039 (1982).
- [43] D. Pedron, R. Bozio, M. Meneghetti, and C. Pecile, Phys. Rev. B 49, 10893 (1994).
- [44] F. Favand and F. Mila, Phys. Rev. B 54, 10425 (1996).
- [45] W.M. Walsh, F. Wudl, G.A. Thomas, D. Nalewajek, J.J. Hauser, P.A. Lee, and T. Poehler, Phys. Rev. Lett. 45, 829 (1980).
- [46] A. Jànossy, M. Hardiman, and G. Grüner, Solid State Commun. 46, 21 (1983).
- [47] L. I. Buravov, V. N. Laukhin, and A. G. Khomenko, Zh. Éksp. Teor. Fiz. 88, 2185 (1985) [Sov. Phys. JETP 61, 1292 (1985)].
- [48] H.H.S. Javadi, S. Sridhar, G. Grüner, L. Chiang, and F. Wudl, Phys. Rev. Lett. 55, 1216 (1985).
- [49] J. L. Musfeldt, M. Poirier, P. Batail, and C. Lenoir, Phys. Rev. B 51, 8347 (1995).
- [50] D. Pines and P. Nozières, The Theory of Quantum Liquids (Benjamin, New York, 1966).
- [51] J. W. Allen and J. C. Mikkelsen, Phys. Rev. B 15, 2952 (1977).
- [52] P.E. Sulewski, A.J. Sievers, M.B. Maple, M.S. Torikachvili, J.L. Smith, and Z. Fisk, Phys. Rev. B 38, 5338 (1988).
- [53] J. Ruvalds and A. Virosztek, Phys. Rev. B 43, 5498 (1991).
- [54] R. N. Gurzhi, Zh. Éksp. Teor. Fiz. 35, 965 (1958) [Sov. Phys. JETP 8, 673 (1959)].
- [55] K. Penc and F. Mila, Phys. Rev. B 50, 11429 (1994).
- [56] C. Bourbonnais, F. Creuzet, D. Jérome, K. Bechgaard, and A. Moradpour, J. Phys. (France) Lett. 45, L755 (1984).
- [57] B. Dardel, D. Malterre, M. Grioni, P. Weibel, Y. Baer, J. Voit, and D. Jérome, Europhys. Lett. 24, 687 (1993).
- [58] F. Zwick, S. Brown, G. Margaritondo, C. Merlic, M. Onellion, J. Voit, and M. Grioni, Phys. Rev. Lett. 79, 3982 (1997).
- [59] K. Behnia, L. Balicas, W. Kang, D. Jérome, P. Carretta, Y. Fagot-Revurat, C. Berthier, M. Horvatic, P. Segransan, L. Hubert, and C. Bourbonnais, Phys. Rev. Lett. 74, 5272 (1995).
- [60] G. Mihály et al. (unpublished).
- [61] J. Moser, M. Gabay, P. Auban-Senzier, D. Jérome, K. Bechgaard, and J.M. Fabre, Euro. Phys. J. B 1, 39 (1998).
- [62] G.M. Danner, W. Kang, and P.M. Chaikin, Phys. Rev. Lett. 72, 3714 (1994).
- [63] P.W. Anderson, Phys. Rev. Lett. 64, 1839 (1990); 65, 2306 (1990).