[
Transport Coefficients of InSb in a Strong Magnetic Field
Abstract
Improvement of a superconducting magnet system makes induction of a strong magnetic field easier. This fact gives us a possibility of energy conversion by the Nernst effect. As the first step to study the Nernst element, we measured the conductivity, the Hall coefficient, the thermoelectric power and the Nernst coefficient of the InSb, which is one of candidates of the Nernst elements. From this experiment, it is concluded that the Nernst coefficient is smaller than the theoretical values. On the other hand, the conductivity, the Hall coefficient ant the thermoelectric power has the values expected by the theory.
]
I Introduction
One of the authors, S. Y., proposed[1, 2] the direct electric energy conversion of the heat from plasma by the Nernst effect in a fusion reactor, where a strong magnetic field is used to confine a high temperature fusion plasma. He called[1, 2] the element which induces the electric field in the presence of temperature gradient and magnetic field, as Nernst element. In his paper[1, 2], he also estimated the figure of merit of the Nernst element in a semiconductor model. In his result[1, 2], the Nernst element has high performance in low temperature region, that is, 300 - 500 K. Before his works, the Nernst element was studied in the 1960’s[3]. In those day, induction of the magnetic field had a lot of loss of energy. This is the reason why the Nernst element cannot be used. Nowadays an improvement on superconducting magnet gives us higher efficiency of the induction of the strong magnetic field. We started a measuring system of transport coefficients in the strong magnetic field to estimate efficiency of the Nernst element on a few years ago[4]. As the first candidate of the Nernst element, we choose InSb, which is expected to have the high figure of merit according to the single-band model[5]. The experiment results show that the Nernst coefficient is smaller than the theoretical values. On the other hand, the conductivity, the Hall coefficient and the thermoelectric power has the values expected by the theory. In this paper, we introduce the experimental results and compare the theoretical calculations.
![[Uncaptioned image]](/html/cond-mat/9709188/assets/x1.png)
II Experiment
A Choice of material
We discuss the principle of transport phenomena in a magnetic field and a temperature gradient. This behavior is written by two phenomenological equations[6] as follows:
| (1) | |||||
| (2) |
where is electrical field, current density, magnetic field, temperature, electrical conductivity, thermoelectric power, Hall coefficient, Nernst coefficient, thermal conductivity and Righi-Leduc coefficient. The Nernst element uses the last term of eq.(1).
To simplify the discussion of the efficiency, we replace all transport coefficients by averaged quantities, which do not depend on position within a device. In order to estimate efficiency of the Nernst element, it is useful to define the figure of merit as follows[3]:
| (3) |
Using eq.(1), the optimal efficiency of thermomagnetic generators is given by[3]
| (4) |
where is the temperatures of the heating (cooling) block, the carnot efficiency, and
| (5) |
The value of must be a real number. This fact impose the following restriction as[3]:
| (6) |
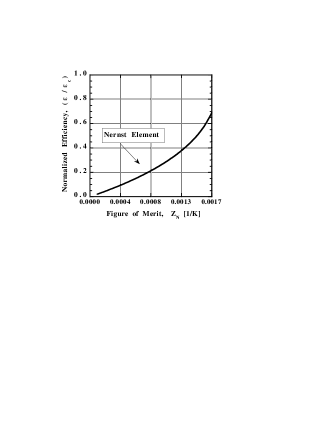
We plot the normalized efficiency, in Fig. 1 as a function of the figure of merit. This figure shows that increases monotonously as becomes larger. We, therefore, must choose the high- materials. We consider the transport coefficients to choose them. It is known from the Boltzmann equation that both conductivity and Nernst coefficient are proportional to Hall mobility[7, 8]. This fact derives the form[1, 4]:
| (7) |
The equation (7) is a criterion for searching the Nernst element. Under this criterion, we first propose indium antimonide, InSb as a candidate of the Nernst element. To compare the mobility of InSb with the other materials, we summarize the values of the mobilities in Table I.

B Measurement of transport coefficients and results
1 Conductivity and Hall coefficient
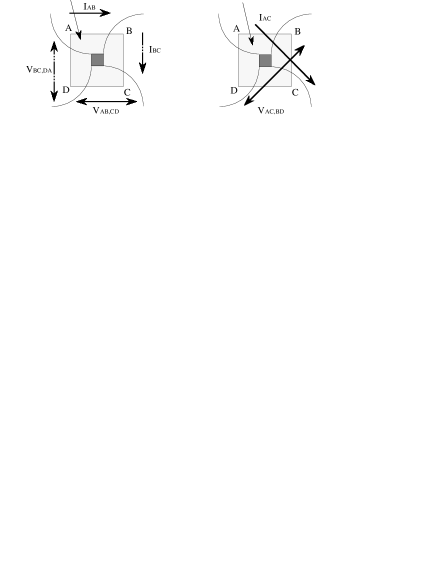
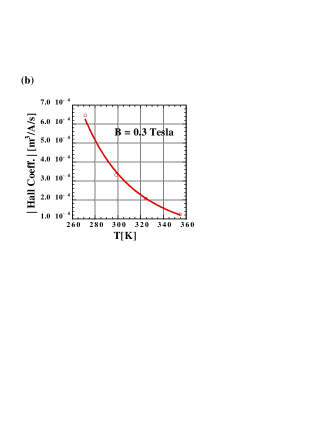
The carrier concentration of the InSb crystals investigated is [ m-3] and its mobility 21 [m2/V/s] at 77K. This sample exhibited intrinsic behavior near room temperature. Copper wires with 50 m-diameter are spark-bonded onto a crystal by using a capacitor discharge. Chromel-Alumel thermocouples, 0.5 mm in diameter, are contact to heating and cooling units with silver epoxy. The temperature of the sample is controlled within 270-370K by the heat bath, the water temperature of which is kept a constant. We induced a strong magnetic field up to 4 Tesla by the superconducting coil to measure magnetoresistance of the sample. Analog signals of the thermocouples and voltage source are amplified and converted to digital data. The personal computer acquires these data and draws figures in real time. We use the van der Pauw method[9] to measure the conductivity and Hall coefficients. A geometry for the van der Pauw method is shown in Fig. 2. Figure Fig. 3(a) shows the temperature dependence of the resistivity at B=0 Tesla. The temperature dependence of the Hall coefficient is represented in Fig. 3(b).
2 Thermoelectric power and Nernst coefficient
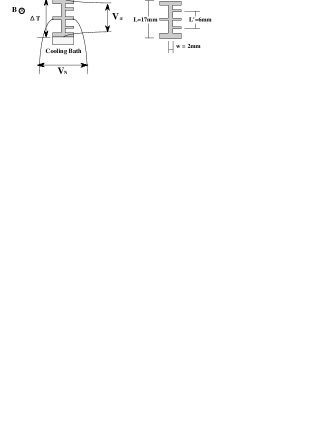
The sample of measurement of the thermoelectric power and the Nernst element is the same material as the van der Pauw method. However, the shape of the sample is changed from the square to the bridged shape (Fig. 4).
In order to make temperature gradient in the sample, we used thermofoil heater for a heating copper block side, the water temperature of which is controlled by a low temperature incubator, for a cooling one. Using the heating and cooling units, the thermal difference across the sample was within 10-100K. The thermoelectric voltage, and the Nernst one, have the following relations between the thermoelectric power and the temperature gradient as
| (8) | |||||
| (9) |
where is the width of the sample and the length defined by Fig. 4. Here we define the following physical quantity, to compare the thermoelectric power and the Nernst effect:
| (10) |
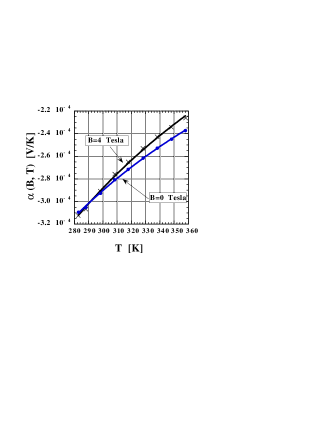
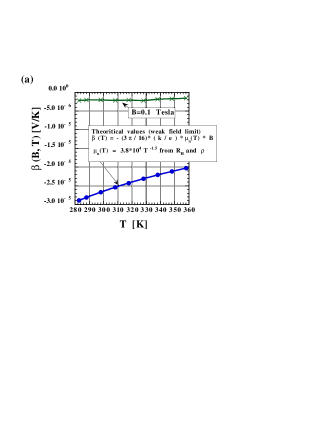
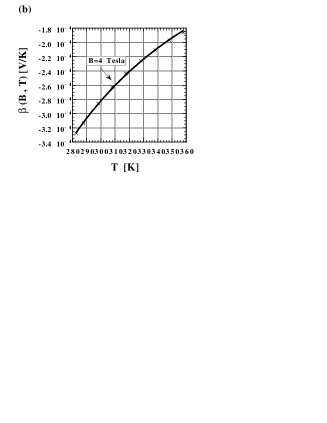
which has the same dimension, [V/K] as The results of the measurement of and in Figs. 5–6. The thermoelectric power doesn’t change very much as the magnetic field is induced. On the other hand, the depends on the magnetic field very much. In Fig. 6(a), we plot the results as the crosses and the theoretical values as the filled circles. The theoretical values are explained in the later. The difference between the experimental results and the theoretical ones is the order of 10. For the strong magnetic field, the results are shown in Fig. 6(b).
III Analysis and physical quantities
A Carrier concentration
In the weak field limit, the Hall coefficient and the carrier concentration has the form[8]
| (11) |
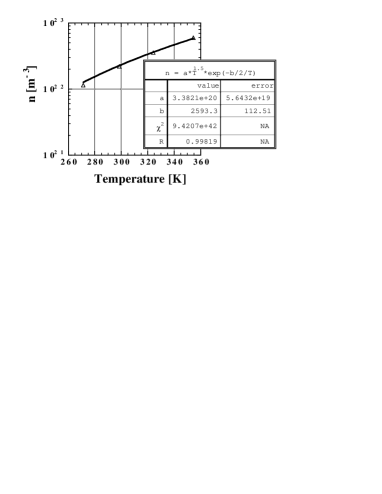
where we define and the hole parts are neglected because for InSb[10, 11]. Equation (11) and Fig. 3(b) gives the carrier concentration of the electron in Fig. 7. We can fit the following function of the temperature by the least square method as
| (12) |
We assume that the sample is in the intrinsic region near room temperature. The carrier concentration of the intrinsic semiconductor is written by[8]
| (13) |
where is the energy gap, the effective mass of the electron, and the effective mass of the hole. Comparing eq. (12) with eq. (13), we obtain
| (14) | |||||
| (15) |
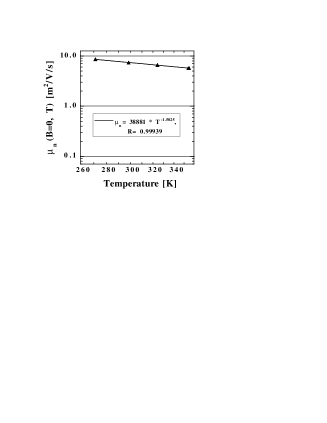
B Mobility of electron
In the weak field limit, the Boltzmann equation for the single parabolic non-degenerated band model gives the conductivity as follows[8]:
| (16) |
where we use for InSb. Equations (11) and (16) give the mobility of the electron in Fig. 8. The temperature dependence of the mobility of the electron is obtained as
| (17) |
The exponent -1.5 denotes that the dominant scattering process is acoustic phonon scattering.
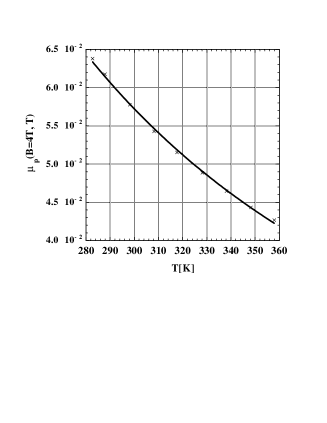
C Mobility of hole
In the strong magnetic field limit, the Nernst coefficient of the intrinsic semiconductor becomes[10]
| (18) |
Substituting the values of the Nernst coefficient given by the experiment at Tesla in the eq. (18), we obtain the mobility of the hole in Fig. 9. By the least square method, we also have the temperature dependence of the hole mobility as
| (19) |
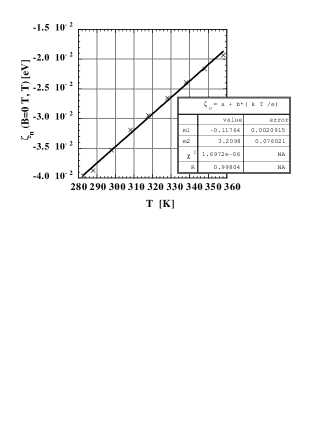
D Fermi level
The thermoelectric power gives the Fermi level as follows[8]:
| (20) | |||||
| (21) | |||||
| (22) |
where is the Fermi level from the edge of the conduction band and negative. Equation (22) and the experimental results of the thermoelectric power give the Fermi level in Fig. 10. In the intrinsic region, the Fermi level becomes[8]
| (23) |
Analysis in Fig. 10 gives the temperature dependence of the Fermi level as follows
| (24) |
From eqs. (23) and (24), the energy gap and the ratio of the effective masses of the electron and the hole is given as
| (25) |
IV Discussion and conclusions
We summarize basic physical quantities obtained by the experiment in Table II, where the reference values are also written. This table shows that the experimental results are almost coincident with the previous works. It is concluded that the Hall coefficient, the conductivity and the thermoelectric power of InSb near room temperature in the weak field are given the Boltzmann equation for the non-degenerate parabolic two-band with the acoustic phonon scattering. However, the Nernst coefficient is very smaller than the theoretical value in the weak field. The behavior of the Nernst coefficient in the strong magnetic field is consistent with the two-band model. We try to explain the difference between the experimental and the theoretical values of the Nernst coefficient in the weak field. Moreover we will measure the thermal conductivity in the magnetic field to estimate the figure of merit.
![[Uncaptioned image]](/html/cond-mat/9709188/assets/x14.png)
Acknowledgements.
The authors are grateful to Dr. Tatsumi in Sumitomo Electric Industries and Prof. Kuroda in Nagoya university for providing semiconductors. We appreciate Prof. Iiyoshi in the National Institute for Fusion Science for his helpful comments.REFERENCES
- [1] S. Yamaguchi, A. Iiyoshi, O. Motojima, M. Okamoto, S. Sudo, M. Ohnishi, M. Onozuka and C. Uesono, “Direct Energy Conversion of Radiation Energy in Fusion Energy, Proc. of 7th Int. Conf. Merging Nucl. Energy Systems”, Proc. of 7th Int. Conf. Merging Nucl. Energy Systems (ICENES)”, (1994) 502.
- [2] S. Yamaguchi, K. Ikeda, H. Nakamura and K. Kuroda, “A Nuclear Fusion Study of Thermoelectric Conversion in Magnetic field”, 4th Int. Sympo. on Fusion Nuclear Tech., ND-P25, Tokyo, Japan, April (1997).
- [3] T. C. Harman and J. M. Honig, “Thermoelectric and Thermomagnetic Effects and Applications”, McGraw-Hill Book Company, (1967), Chap. 7, p. 311.
- [4] K. Ikeda, H. Nakamura, S. Yamaguchi and K. Kuroda, ”Measurement of Transport properties of Thermoelectric Materials in the Magnetic Field”, J. Adv. Sci., 8, (1996) 147, (in Japanese).
- [5] H. Nakamura, K. Ikeda, S. Yamaguchi and K. Kuroda, “Transport Coefficients of Thermoelectric Semiconductor InSb”, J. Adv. Sci., 8, (1996) 153, (in Japanese).
- [6] L. D. Landau, E. M. Lifshitz and L. P. Petaevskii, “Electrodynamics of Continuous Media”, 2nd Edition, Pergamon Press, (1984)101.
- [7] E. H. Putly, “The Hall Effect and Related Phenomena”, London, Butterworth &Co. Ltd., (1960), Chap. 3, p. 66.
- [8] K. Seeger, “Semiconductor Physics”, Springer-Verlag, (1989).
- [9] L. J. van der Pauw, “A Method of Measuring Specific Resistivity and Hall Effect of Discs of arbitrary Shape”, Philips Res. Rep., 13, (1958) 1.
- [10] G. Madelung, “Physics of III-V Compounds”, J. Wiley & Sons, (1964) 115.
- [11] J. D. Wiley, “Semiconductors and Semimetals”, Vol. 10, ed. by R. K. Willardson and A.C. Beer, Academic Press, (1975) 169.
- [12] L. Sosnowski, “Thermo-Electric and Thermo-Magnetic Effects”, Proc. Int’l School of Physics ”Enrico Fermi” XXII, Semiconductors, (Academic Press, New York and London 1963) 436.
- [13] H. J. Hrostowski, F. J. Morin, T. H. Geballe, and G. H. Wheatley, Phys. Rev., 100, (1955) 1672.
- [14] D. M. Zengin, J. Phys., D16, (1983) 635.
- [15] D. M. S. Bagguley, M. L. A. Pobinson and R. A. Strandling, Phys. Lett., 6, (1963) 143.