[
Non-Arrhenius Behavior of Surface Diffusion Near a Phase Transition Boundary
Abstract
We study the non-Arrhenius behavior of surface diffusion near the second-order phase transition boundary of an adsorbate layer. In contrast to expectations based on macroscopic thermodynamic effects, we show that this behavior can be related to the average microscopic jump rate which in turn is determined by the waiting-time distribution of single-particle jumps at short times. At long times, yields a barrier that corresponds to the rate-limiting step in diffusion. The microscopic information in should be accessible by STM measurements.
pacs:
PACS numbers: 68.35.Fx, 82.20.Pm]
The migration of atoms and molecules is one of the most important processes taking place on solid surfaces. It appears in many phenomena such as catalytic reactions and surface growth that are important for practical applications [1]. In most experimental and theoretical studies of the surface diffusion constant , its temperature dependence is analyzed through an assumed Arrhenius form, where is written as a product of an entropic prefactor and a term describing thermally activated jumps over an energy barrier . Although the Arrhenius form can be derived from microscopic considerations in some special cases [2, 3], a rigorous justification for its use in interacting systems at finite coverages is not available. Further, even in the cases where appears to have an Arrhenius temperature dependence over a finite temperature range, its microscopic interpretation may not always be clear. This is because for an interacting system, there may be many microscopic activation barriers. Thus the value of the measured effective diffusion barrier must result from some complex average of all of them, and does not refer to any microscopic process in particular [4].
In fact, the values for and can be strongly temperature-dependent indicating a region of non-Arrhenius behavior. This becomes especially pronounced near surface phase transition boundaries, where rapid variations of have been observed in experiments [4, 5, 6] and computer simulations [2, 7]. Such rapid changes are often accompanied by the well-known “compensation” effect [8], where an apparent increase in is compensated by an increase in the prefactor [6]. However, in most cases the underlying reasons for non-Arrhenius behavior are not understood. It is the purpose of the present work to study these issues near a second-order phase transition in a surface adsorbate layer. We show that in contrast to the common folklore that an anomalous temperature dependence in near would be predominantly due to non-local thermodynamic effects, it can be explained by the microscopic single-particle jump rate . This quantity is determined by the short-time behavior of the waiting-time distribution for single-particle jumps. Moreover, we show that for long times, yields an effective activation barrier that corresponds to the rate-limiting step in diffusion. Thus provides a connection between microscopic and macroscopic aspects of diffusion. Further, it is experimentally available through e.g. STM measurements [9].
In this Letter, we have carried out Monte Carlo (MC) simulations for a model of oxygen on the W(110) surface [10, 11]. In this system, the substrate remains unreconstructed [12], the oxygen atoms have well-defined adsorption sites [13], and desorption of oxygen occurs only at temperatures 1600 K or above [12]. Therefore, this system is very suitable for simulation studies using a lattice-gas description. We use the lattice-gas model constructed by Sahu et al. [11] to describe the main features of the phase diagram. The Hamiltonian includes pair interactions up to fifth nearest neighbors and some three-body interactions [11], the attractive ones being the dominant. We concentrate on results for the coverage over a wide temperature range. For this coverage at a low temperature, the adlayer is in the ordered p() phase, while at 710 K it undergoes a second-order transition [11] to a disordered phase [14]. For details of the model and MC simulations, see Refs. [10, 15].
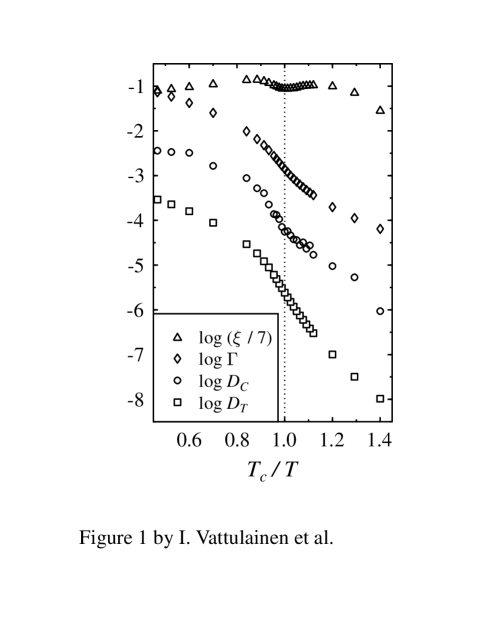
Our simulation results for the tracer and collective diffusion coefficients and (for definitions see e.g. Ref. [4]), respectively, are given in Fig. 1. We first note that their qualitative behavior is similar and that the effective diffusion barrier defined as
| (1) |
is approximately constant at low and high temperatures away from . This implies that the diffusion constants obey simple Arrhenius behavior. Near , however, the temperature dependence of the diffusion constants is strongly non-Arrhenius.
In the Green-Kubo formalism [4], the expression for contains a thermodynamic factor inversely proportional to the compressibility, which is governed by the global number fluctuations of the adlayer. It is often assumed that a possible non-Arrhenius behavior of near the phase transition boundary is predominantly due to the critical behaviour of this factor [7]. We show below that this is not the case here: The non-Arrhenius behavior of both and has a dynamic origin and can be traced back to the temperature dependence of the local single-particle jump rate . To demonstrate this, we show in Fig. 1 the temperature dependence of and as well as that of and . It can be seen from Fig. 1 that while the diffusion constants have a turning point and sharp temperature variations close to , the thermodynamic factor has only a relatively weak temperature dependence in this region and cannot account for the non-Arrhenius behavior of the diffusion constants. On the other hand, the single-particle jump rate has exactly the same behavior near as and . These observations can be understood theoretically within the dynamical mean field theory (DMF) [16], which yields and . We can conclude that the strong temperature dependence of both and near is indeed of the same dynamic origin, coming from the average single-particle transition rate .
We next focus on the effective diffusion barrier as extracted from Eq. (1) for . As shown by squares in Fig. 2, has a sharp peak near . This peak in is accompanied by a strong increase in the value of the corresponding prefactor shown in the inset of Fig. 2. This is yet another example of the well-known compensation effect [4, 8]. Here the compensation simply results from the fact that when the temperature dependence is non-Arrhenius, there is no unique way of separating the prefactor and the barrier contributions. Since the temperature dependence of the diffusion constant itself near is smooth and nonsingular, any dramatic change in the temperature dependence of the effective barrier must be followed by a corresponding change in the effective prefactor . We note that the same phenomenon occurs for collective diffusion as well.
To understand the observed strong temperature variation of near , we need to consider the energetics of the microscopic jump processes which determine the average jump rate . At finite coverages, there is a very complex distribution for the instantaneous activation barriers [17] which an adatom needs to overcome in a jump attempt from one configuration to another. At high , is strongly peaked at small values of , while at low temperatures the situation is completely the opposite [18]. The change in the distribution takes place around , thus characterizing the ordering of the adlayer as the temperature is decreased below . This change in turn results in a strong temperature dependence of the average transition rate around , as shown in Fig. 1. We point out that the instantaneous activation barriers cannot explain the peak of the effective barrier in Fig. 2, since the largest value of in our model system is only about 0.4 eV [18]. Thus, the peak does not refer to any microscopic rate-limiting process. Instead, it arises from an entropic contribution [19] to which has a strong temperature dependence in the vicinity of .
To gain more insight into the microscopic dynamical processes and the anomalous temperature dependence near , we next introduce the waiting-time distribution of single-particle jumps [20]. Suppose a single particle (in the presence of other particles) had performed its last transition at time . Then is the probability density that the particle in question performs its next transition at time after it remained still until . Here the most practical definition of “time” in the MC simulations is to consider the time scale as the number of jump attempts of the particle, denoted by . Then the waiting-time distribution is simply . This provides a direct connection with the dynamic jump rate discussed above via
| (2) |
where is the average waiting-time of the particle.
At very long times, we expect to decay as . Here the characteristic time describes the longest time scale among the various microscopic processes, which constitutes the rate-limiting factor for mass transport. This expected exponential decay at long times is indeed observed for our model system, as demonstrated in Fig. 3. We can then define an effective activation barrier via by considering the jump probability . As shown by circles in Fig. 2, the activation barrier extracted from the asymptotic region of decreases monotonically with increasing temperature, and agrees with the effective diffusion barrier extracted from an Arrhenius analysis of far from . Additional studies in our model system [18] indicate that the value of is closely related to the instantaneous activation barrier characterizing the dominant microscopic processes. In our model the microscopic barriers have a maximum value of about 0.4 eV and thus the barrier does not have the sharp peak displayed by the effective diffusion barrier .
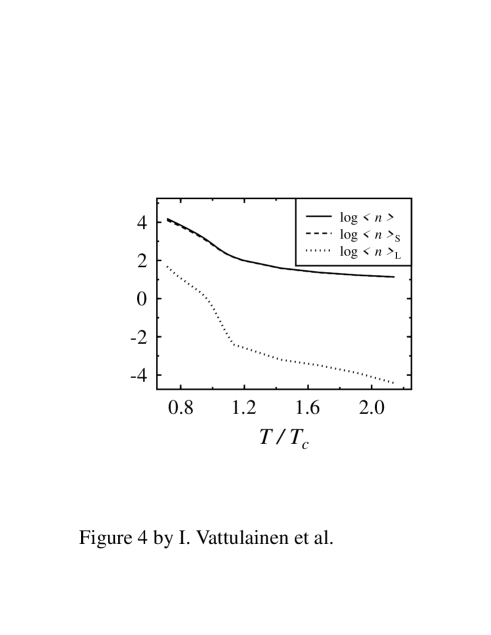
It turns out that the temperature dependence of the barrier results mainly from the short-time behavior of . This is demonstrated by dividing the sum in Eq. (2) into two parts, the first of which is the short-time contribution . This quantity accounts for the contribution up to a crossover time , which separates the short-time regime from the asymptotic exponential decay. What remains is the long-time contribution . As expected, from Fig. 4 we observe that the short-time regime gives the dominant contribution to . Further, the short-time regime of is strongly affected by the critical fluctuations, being mainly responsible for the anomalous temperature dependence of the diffusion constants near .
To summarize, within the present model of O/W(110), the non-Arrhenius behavior near was found to have a mainly dynamic origin, reflecting the dependence of the single-particle jump rate on the critical fluctuations close to . Surprisingly, in our studies the thermodynamic factor gives only a minor contribution to the temperature dependence of the collective diffusion constant , and the anomalous temperature dependence for both and results from the dynamic factor . We find that the single-particle waiting-time distribution gives the most detailed picture of the microscopic processes. It has been recently demonstrated by Swartzentruber [9] that this distribution function in the presence of several different microscopic activation barriers can indeed be measured using the STM. From the long-time tail of one can obtain information on the energetics of the rate-limiting processes of diffusion in the form of an effective activation barrier . On the other hand, the temperature variation of the effective diffusion barrier directly reflects that of the microscopic jump rate , and depends not only on the long-time tail of but also on its short-time behavior. In the short-time regime near , is strongly affected by the critical fluctuations. The fluctuations there lead to a strong temperature dependence of the transition entropy and an additional contribution to the effective barrier .
I. V. thanks the Neste Co. Foundation and the Jenny and Antti Wihuri Foundation. J. M. is supported by the Finnish Cultural Foundation. This research has also been partially supported by a grant from the office of Naval Research (S. C. Y. and J. M.) and by the Academy of Finland (J. M. and T. A.-N.). Finally, computing resources of the University of Helsinki are gratefully acknowledged.
REFERENCES
- [1] V. T. Binh (editor), Surface Mobilities on Solid Materials: Fundamental Concepts and Applications (Plenum Press, New York, 1981); M. G. Lagally (editor), Kinetics of Ordering and Growth at Surfaces (Plenum Press, New York, 1990).
- [2] T. Ala-Nissila and S. C. Ying, Prog. Surf. Sci. 39, 227 (1992).
- [3] L. Y. Chen and S. C. Ying, Phys. Rev. B 49, 13838 (1994).
- [4] R. Gomer, Rep. Prog. Phys. 53, 917 (1990).
- [5] A. G. Naumovets and Yu. S. Vedula, Surf. Sci. Rep. 4, 365 (1985).
- [6] V. P. Zhdanov, Surf. Sci. Rep. 12, 183 (1991).
- [7] A. Sadiq and K. Binder, Surf. Sci. 128, 350 (1983); A. V. Myshlyavtsev, A. A. Stepanov, C. Uebing, and V. P. Zhdanov, Phys. Rev. B 52, 5977 (1995); C. Uebing and R. Gomer, Surf. Sci. 331-333, 930 (1995).
- [8] Von W. Meyer and H. Neldel, Z. Tech. Phys. 12, 588 (1937).
- [9] B. S. Swartzentruber, Phys. Rev. Lett. 76, 459 (1996); Surf. Sci. 374, 277 (1997).
- [10] I. Vattulainen, J. Merikoski, T. Ala-Nissila, and S. C. Ying, Surf. Sci. 366, L697 (1996).
- [11] D. Sahu, S. C. Ying, and J. M. Kosterlitz, in The Structure of Surfaces II, edited by J. F. van der Veen and M. A. van Hove (Springer-Verlag, Berlin, 1988) p. 470.
- [12] C. R. Brundle and J. Q. Broughton, Chapter 3 in Volume 3A of The Chemical Physics of Solid Surfaces and Heterogeneous Catalysis: Chemisorption Systems, edited by D. A. King and D. P. Woodruff (Elsevier, Amsterdam, 1990); and references therein.
- [13] A. Elbe, G. Meister, and A. Goldmann, Surf. Sci. 371, 438 (1997); and references therein.
- [14] G.-C. Wang, T.-M. Lu, and M. G. Lagally, J. Chem. Phys. 69, 479 (1978).
- [15] I. Vattulainen, J. Merikoski, T. Ala-Nissila, and S. C. Ying, in Proceedings of “Surface Diffusion: Atomistic and Collective Processes”, edited by M. C. Tringides (Plenum Press, New York, 1997).
- [16] T. Hjelt, I. Vattulainen, J. Merikoski, T. Ala-Nissila, and S. C. Ying, to appear in Surface Science Letters (1997); cond-mat/9702233.
- [17] In our MC studies, we used the so called TDA algorithm [10]. In this method, the transition of an adatom from the initial state with energy to the final state with energy proceeds by two successive steps via the intermediate state with energy . For , we used the form , where characterizes the activation barrier in the zero coverage limit due to the substrate-adatom interaction. The instantaneous activation barrier for a jump attempt from a filled to a vacant site is then For further details and for the choice of , see Refs. [10, 15].
- [18] I. Vattulainen, J. Merikoski, T. Ala-Nissila, and S. C. Ying, in preparation (1997).
- [19] Within the framework of the Transition State Theory [P. Hänggi, P. Talkner, and M. Borkovec, Rev. Mod. Phys. 62, 251 (1990)], the diffusion rate is proportional to , with the free energy difference , where is the energy barrier, and the prefactor arises from the transition entropy . In the case studied here, the entropy is strongly temperature-dependent due to critical fluctuations, which leads to an additional contribution to the effective diffusion barrier as obtained from an Arrhenius plot.
- [20] J. W. Haus and K. W. Kehr, Phys. Rep. 150, 263 (1987).
- [21] In this work, the crossover time was chosen to be the value of , at which the relative deviation of from its asymptotic form was half percent [18].