[
Infrared signatures of the spin-Peierls transition in CuGeO3
Abstract
We investigated the infrared reflectivity of several Mg- and Si-substituted CuGeO3 single crystals. The temperature dependent b-axis and c-axis optical response is reported. For TTSP we detected the activation of zone-boundary phonons along the b axis of the crystal on the pure sample and for 1% Mg and 0.7% Si concentrations. From a detailed analysis of the phonon parameters the redshift of the mode at 48 cm-1 is observed and discussed in relation to the soft mode expected to drive the spin-Peierls phase transition in CuGeO3. Moreover, the polarization dependence of a magnetic excitation measured in transmission at 44 cm-1 has been investigated.
]
In 1993 CuGeO3 has been recognized, on the basis of magnetic susceptibility measurements, [1] as the first inorganic compound showing a spin-Peierls (SP) transition , i.e., a lattice distortion (due to the magneto-elastic coupling between the one-dimensional spin system and the three-dimensional phonon system) which occurs together with the formation of a spin-singlet ground state and the opening of a finite energy gap in the magnetic excitation spectrum. This discovery has renewed the interest in the field of the SP phase transition, observed for the first time on an organic material in the 70’s, [2] because the availability of large high quality single crystals of CuGeO3 makes it possible to investigate this phenomenon by a very broad variety of experimental techniques. Furthermore, CuGeO3 seems to be a good candidate for the observation of a soft mode in the phonon spectrum, upon passing through the SP transition. In fact, a well-defined soft mode is expected in those theoretical models describing an SP system in terms of a linear coupling between lattice and magnetic degrees of freedom. [3, 4] During the last few years both the structural deformation and the spin gap have been characterized in detail by x-ray and neutron scattering experiments. [5, 6, 7, 8, 9] So far no soft mode has yet been detected in CuGeO3.
In this paper we present a detailed spectroscopic study of the vibrational and electronic signatures of the SP transition in pure and doped CuGeO3. We concentrate on the nature of the transition and on the dynamical interplay between spins and phonons.
We investigated the far- and mid-infrared reflectivity (20 - 6000 cm-1) of several Cu1-δMgδGeO3 (=0, 0.01) and CuGe1-xSixO3 (x=0, 0.007, 0.05, 0.1) single crystals. These high-quality single crystals were grown from the melt by a floating zone technique. [10] Samples with dimensions of approximately 136 mm3 were aligned by conventional Laue diffraction and mounted in a liquid He flow cryostat to study the temperature dependence of the optical properties between 4 K and 300 K. The reflectivity measurements were performed with a Fourier transform spectrometer (Bruker IFS 113v), operating in near normal incidence configuration with polarized light in order to probe the optical response of the crystals along the b and the c axes. The absolute reflectivities were obtained by calibrating the data acquired on the samples against a gold mirror.
The number and the symmetry of the infrared active phonons expected for the high temperature undistorted
phase and the low temperature SP phase of CuGeO3 can be obtained from a group theoretical analysis
of the lattice vibrational modes. At room temperature CuGeO3 has an orthorhombic crystal structure
with lattice parameters
a=4.81 Å, b=8.47 Å and c=2.941 Å and space group
Pbmm or,
equivalently, Pmma in standard setting. [11] The building blocks of the structure are
edge-sharing CuO6 octahedra and corner-sharing GeO4 tetrahedra stacked along the
c axis of the crystal and resulting in Cu2+ and Ge4+ chains parallel to the c axis.
These
chains are linked together via the O atoms [denoted as O(2)] and form layers parallel to the
b-c plane weakly coupled along the a axis. The irreducible representations of the optical
vibrations of CuGeO3, in setting Pbmm, for TTSP is: [12]
,
corresponding to an expectation of 12 Raman active modes () and 13 infrared active modes (). Below TSP the crystal structure is still orthorhombic,
but with lattice parameters a’=2a, b’=b and c’=2c and space group
Bbcm or , equivalently, Cmca in standard setting. [5, 7] The distortion of
the lattice in the phase transition can be characterized as the dimerization of the Cu-Cu pairs along
the c axis (dimerization out of phase in neighboring chains), together with the rotation of the
GeO4 tetrahedra around the axis defined by the O(1) sites (rotation opposite in sense for neighboring
tetrahedra). Moreover, the O(2) sites of the undistorted structure split in an equal number of
O(2a) and O(2b) sites, distinguished by the distances O(2a)-O(2a) and
O(2b)-O(2b) shorter and larger than O(2)-O(2), [7] respectively. The irreducible
representations of the optical vibrations, in setting Bbcm, for TTSP
is: [12]
.
Therefore 30 Raman active modes () and 22 infrared active modes
() are expected for CuGeO3 in the SP phase, all the additional vibrations
being zone boundary modes activated by the folding of the Brillouin zone. In particular, the number
of infrared active phonons is expected to increase from 5 to 8, 5 to 9 and 3 to 5 for light
polarized along the a, b and c axis, respectively, upon passing through the phase
transition.
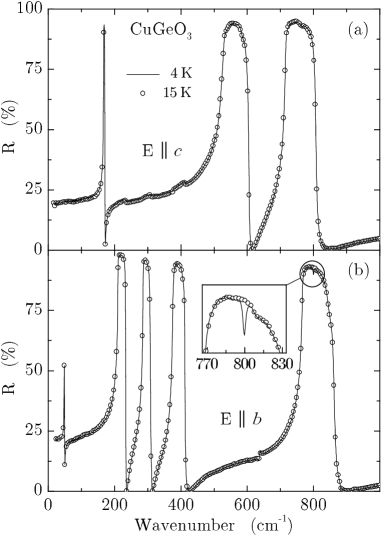
The c- and b-axis reflectivity spectra of pure CuGeO3 are plotted in Fig. 1, for T=15 K (circles) and T=4 K (solid line). The data, characteristic of an ionic insulating material, are shown up to 1000 cm-1 which covers the full phonon spectrum. For TTSP three phonons are detected along the c axis ( 167, 528 and 715 cm-1 for T=15 K), and five along the b axis ( 48, 210, 286, 376 and 766 cm-1 for T=15 K), in agreement with the theoretical expectation. The structure in Fig. 1(a) between 200 and 400 cm-1 is due to a leakage of the modes polarized along the c axis. The feature at approximately 630 cm-1 in Fig. 1(b) is a leakage of a mode polarized along the a axis. [13] Whereas for E the spectra are exactly identical, a new feature is detected in the SP phase at 800 cm-1 for E, as shown in the inset of Fig. 1(b). A careful investigation for temperatures ranging from 4 to 15 K (see Fig. 2) clearly shows that this feature, that falls in the frequency region of high reflectivity for the phonon at 766 cm-1 and therefore shows up in reflectivity mainly for its absorption, is activated by the SP transition. It corresponds to a new absorption peak in conductivity, superimposed on a background due to the lorentzian tail of the close mode (see inset of Fig. 2). We observed the same peak (at the same resonant frequency) also on 1% Mg and 0.7% Si doped single crystals, but not on 5% and 10% Si doped samples, [12] where we did not find any sign of the SP transition also on the basis of magnetic susceptibility measurements.
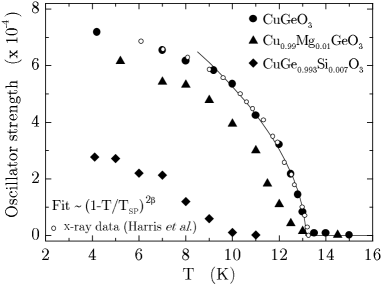
By fitting the reflectivity spectra with Lorentz oscillators for the optical phonons it is possible to obtain the temperature dependence of the oscillator strength for the 800 cm-1 feature. The results are plotted in Fig. 3, together with the peak intensity of the superlattice reflection measured by Harris et al. [14] in an x-ray scattering experiment on a pure CuGeO3 single crystal characterized, as our sample, by TSP13.2 K. From the perfect agreement of the infrared and x-ray scattering results on pure CuGeO3 and from the observation that the resonant frequency is not shifting at all with temperature, we can conclude that the peak at 800 cm-1 corresponds to a pure lattice excitation and the oscillator strength is proportional to the symmetry-breaking displacement of the atoms squared. The same conclusions can be obtained for the 1% Mg and 0.7% Si doped samples, where TSP of approximately 12.4 K and 9.3 K, respectively, are observed (in these two cases the data can be compared, for 0.7% Si doping, to those presented in Ref. 15 and , for 1% Mg doping, to those reported in Ref. 16 for a 0.9% Zn-doped sample, because no x-ray nor neutron scattering data are available in the literature for Mg-doped CuGeO3). Moreover, as this activated line does not show any frequency shift as a function of Si and Mg doping, we can conclude that it has to be a folded zone boundary mode related to the phonon observed at 766 cm-1, which is mainly an oxygen vibration. [13] This gives for the mode an energy dispersion, over the full Brillouin zone, of the order of 24 cm-1=2.98 meV at T=15 K.
The reasons for not observing in our reflectivity spectra for TTSP all the phonons predicted from the group theoretical analysis, are probably the small values of the atomic displacements involved in the SP transition ( with a correspondingly small oscillator strength of zone boundary modes), and/or possibly the small dispersion of the optical branches of some of the lattice vibrations. However, it is not surprising that the only activated mode has been detected along the b axis of the crystal. In fact, it is for this axis that for TTSP a spontaneous thermal contraction has been observed, [17] which can be responsible for a relative increase of the oscillator strength of the phonons polarized along the b axis with respect to those polarized along the c axis.
In Fig. 3 the results of a fit of the experimental data by the equation (1-T/T over a broad temperature range are also plotted, for the pure sample. We obtained in agreement with Ref. 17. However, the best fit value of is strongly dependent on the temperature range chosen to fit the data. If only points very close (within one Kelvin) to TSP are considered, the value is obtained, as reported in Ref. 6. It is not possible to perform the same fit for the data acquired on doped samples because they are characterized by an upturned curvature near TSP, which can be explained in terms of a distribution of transition temperatures due to the disorder introduced upon doping the system. [15]
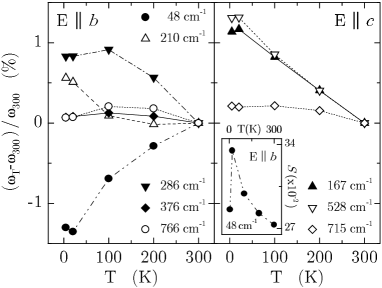
As far as the dynamical interplay between spins and phonons in CuGeO3 is concerned, it is clear from the reflectivity spectra plotted in Fig. 1 that a well-defined soft mode, driving the structural deformation in CuGeO3, has not been detected in our measurements. However, interesting information can be drawn from the temperature dependence of the phonon parameters obtained from the fit of the reflectivity data for the pure sample. In Fig. 4 the frequency shift (in per cent) for the modes (E) and the modes (E) is plotted as a function of temperature. We can clearly observe that the mode at 48 cm-1 is the only one showing an evident monotonic redshift from 300 K to 15 K . This can be understood in terms of the normal-mode displacements obtained by Popović et al. [13] via a shell-model lattice dynamical calculation. In fact, this particular mode, as well as the Raman active at 116 cm-1, consists mainly of the rotation (accompanied by a slight internal distortion) of the GeO4 tetrahedra around the axis defined by the O(1) sites. It is precisely this “hinge motion” [18] represented in terms of normal-mode displacements at k=(,0,) which, together with the dimerization of the Cu-Cu pairs along the c axis, corresponds to the structural deformation involved in the SP phase transition. The mode at 48 cm-1 has approximately the same character. Below TSP this mode shows only a small blueshift. More noticeable there is a large (15%) reduction of oscillator strength S (see inset of Fig. 4). One may speculate at this point, that a full softening is also absent for the phonons at k=(,0,), implying that the phase transition is not driven by a softening of the phonon spectrum at k=(,0,), but by a change in electronic structure which in turn determines the dynamical charge of the ions and the interatomic force constants. In this scenario the large change in oscillator strength of some of the vibrational modes results from a change in ionicity, or, in other words, a transfer of spectral weight from the elastic degrees of freedom to electronic excitations.
A last remark has to be made regarding the temperature dependence of the mode ( in standard setting) observed at 286 cm-1. In a recent paper [19] a softening of this phonon, upon going through the phase transition, was suggested. This is not confirmed by our results which show no considerable frequency shift for this resonance upon reducing the temperature from 15 K to 4 K (see Fig. 4). On the other hand a reduction of both the scattering rate and the oscillator strength is observed, which can explain the double-peak structure in the reflectance ratio R(20 K)/R(5 K) reported in Ref. 19.
Usually in optical spectroscopy direct singlet-triplet excitations are not detectable or very weak. However, such a transition has been observed at 44.3 cm-1 in an infrared transmission experiment where the singlet-triplet nature of the transition was demonstrated by the Zeeman splitting observed in magnetic field. [20] In a very recent paper [21] this line was interpreted as a magnetic excitation across the gap at the wave vector (0,,0) in the Brillouin zone, activated by the existence of staggered magnetic fields along the b axis. In order to study this interpretation we measured the far infrared transmission on the pure CuGeO3 single crystal for E and E. The absorbance difference spectra are reported in Fig. 5, where they have been shifted for clarity. For E no absorption is observed. However, for E an absorption peak, showing the appropriate temperature dependence, is present at approximately 44 cm-1. One has to note that the feature at 48 cm-1 is produced by the low energy phonon. In fact, due to the strong temperature dependence of its parameters, this line does not cancel out completely in the ratios of transmission spectra measured at different temperatures. The observed polarization dependence puts a strong experimental constraint on the possible microscopic mechanism giving rise to the singlet-triplet absorption peak.
In conclusion, we have investigated the temperature dependent phonon spectrum of pure and doped CuGeO3, by means of infrared reflectivity measurements. For TTSP we observed the activation of zone-boundary phonons along the b axis of the crystals and the redshift of the mode at 48 cm-1. The latter result has been discussed in relation to the role played by this lattice vibration in driving the system into the dimerized phase. Moreover, a magnetic excitation has been measured in transmission at 44 cm-1 and its polarization dependence investigated.
We gratefully acknowledge M. Mostovoi and D.I. Khomskii for stimulating discussions and T.T.M. Palstra for the magnetic susceptibility measurements. We thank P.H.M. van Loosdrecht and M. Grüninger for many useful comments. This investigation was supported by the Netherlands Foundation for Fundamental Research on Matter (FOM) with financial aid from the Nederlandse Organisatie voor Wetenschappelijk Onderzoek (NWO).
REFERENCES
- [1] M. Hase et al., Phys. Rev. Lett. 70, 3651 (1993).
- [2] J.W. Bray et al., Phys. Rev. Lett. 35, 744 (1975).
- [3] L.N. Bulaevskii et al., Solid State Commun. 27, 5 (1978).
- [4] M.C. Cross et al., Phys. Rev. B 19, 402 (1979).
- [5] K. Hirota et al., Phys. Rev. Lett. 73, 736 (1994).
- [6] M.D. Lumsden et al., Phys. Rev. Lett. 76, 4919 (1996).
- [7] M. Braden et al., Phys. Rev. B 54, 1105 (1996).
- [8] O. Fujita et al., Phys. Rev. Lett. 74, 1677 (1995).
- [9] M. Aïn et al., Phys. Rev. Lett. 78, 1560 (1997).
- [10] A. Revcolevschi et al., Adv. Mater. 5, 657 (1993).
- [11] H. Völlenkle et al., Monatsh. Chem. 98, 1352 (1967).
- [12] A. Damascelli et al., Physica B, in press (1997).
- [13] Z.V. Popović et al., Phys. Rev. B 52, 4185 (1995).
- [14] Q.J. Harris et al., Phys. Rev. B 52, (1995).
- [15] L.P. Regnault et al., Europhys. Lett. 32, 579 (1995).
- [16] Y. Sasago et al., Phys. Rev. B 54, R6835 (1996).
- [17] Q.J. Harris et al., Phys. Rev. B 50, (1994).
- [18] D. Khomskii et al., Czech. J. Phys. 46, 3239 (1996).
- [19] G. Li et al., Phys. Rev. B 54, R (1996).
- [20] P.H.M. van Loosdrecht et al., Phys. Rev. B 54, R3730 (1996).
- [21] G.S. Uhrig, preprint.