OUTP-97185 BU-CCS-970501 Lattice-Gas Simulations of Minority-Phase Domain Growth in Binary Immiscible and Ternary Amphiphilic Fluids
Abstract
We investigate the growth kinetics of binary immiscible fluids and emulsions in two dimensions using a hydrodynamic lattice-gas model. We perform off-critical quenches in the binary fluid case and find that the domain size within the minority phase grows algebraically with time in accordance with theoretical predictions. In the late time regime we find a growth exponent over a wide range of concentrations, in good agreement with other simulations. In the early time regime we find no universal growth exponent but a strong dependence on the concentration of the minority phase. In the ternary amphiphilic fluid case the kinetics of self assembly of the droplet phase are studied for the first time. At low surfactant concentrations, we find that, after an early algebraic growth, a nucleation regime dominates the late-time kinetics, which is enhanced by an increasing concentration of surfactant. With a further increase in the concentration of surfactant, we see a crossover to logarithmically slow growth, and finally saturation of the oil droplets, which we fit phenomenologically to a stretched exponential function. Finally, the transition between the droplet and the sponge phase is studied.
PACS numbers: 82.70.-y;05.70.Lm; 47.20.Hw; 64.60.Qb
I Introduction
The fascinating effects caused by the introduction of amphiphilic molecules into a system of oil and water have been subject to considerable study for many years. For a general review of the complex structures that arise due to the particular physical and chemical properties of surfactant molecules, see Gelbart et al. [1] or Gompper and Schick [2]. One major feature of these systems is that the usual oil-water interfacial tension is dramatically lowered by the presence of surfactant, a phenomenon that underpins much of the interest in such self-assembling amphiphilic structures. Making use of a hydrodynamic lattice-gas model [3], we demonstrate in the present paper that we are able to consistently simulate growth kinetics in both immiscible fluids and emulsions.
The growth kinetics of binary immiscible fluids quenched into the coexistence region have been studied extensively in the last decade. It is widely accepted that phase separation in these systems can be described in terms of a single quantity, the time dependent average domain size . In the regime of sharp domain walls, it is known that this quantity follows algebraic growth laws, that is [4, 5]. Much effort has been put into the determination of the growth exponent in the case of deep critical quenches. Recent results [6, 7, 8, 9, 10] on two-dimensional fluids confirm the presence of two regimes, the viscous regime [11] with and the hydrodynamic or inertial regime [12] with , which dominate the early and late time behaviour respectively. Reports of an early time regime [13], obeying the Lifshitz-Slyozov evaporation-condensation mechanism with are believed to be due to the absence of fluctuations in the lattice-Boltzmann models employed.
In the case of off-critical quenches, however, comparatively few studies have been made and the situation is far from clear. Theoretical approaches excluding hydrodynamics and fluctuations by Yao et al. [14] found modified Lifshitz-Slyozov growth with , where and depend on the concentration of the minority phase. This leads to a time-dependent growth exponent, which only asymptotically reaches . Numerical simulations by Chakrabarti et al. [15] confirmed this picture. Implicitly including hydrodynamics, Furukawa [12] calculated a value of the growth exponent of due to inertial friction, which degenerates for with the dissipative friction regime () to . ‡‡‡There has been some confusion about this value in the literature, but it is only in that Furukawa predicts , compare his review article [4]. San Miguel et al. [11] predicted a droplet coalescence growth with , followed by a Lifshitz-Slyozov evaporation-condensation mechanism with . But since this mechanism is suppressed by the hydrodynamic modes in critical quenches, we believe that a Lifshitz-Slyozov growth can only occur, if at all, before the regime with in off-critical quenches as well. Although some numerical simulations were undertaken so far using a variety of techniques, none of them reported a growth exponent of or . Lattice-Boltzmann simulations by Chen and Lookman [16] gave , while Osborn et al. [13] found in the high viscosity and in the low viscosity or hydrodynamic regime. Langevin modelling by Wu et al. [17] gave . Coveney and Novik [8] studied quenches using dissipative particle dynamics and reported . All of these simulations dealt with only one or two values of minority phase concentration. Recently, Velasco and Toxvaerd [6] using molecular dynamics methods measured the domain growth for three different minority phase concentrations and found that the growth exponent dropped continuously from over to a very slow growth (a crude measurement in their data, Fig. 4 of [6] gives ). The latter was explained by the authors to be due to the lack of statistical significance. An earlier study by the same authors [18] had found a growth exponent of . Latest experiments on thin films of off-critical polymer solutions by Haas and Torkelson [19] found “best-fit” growth exponents ranging from up to , which were interpreted as a Lifshitz-Slyozov growth with . Summing up all the results obtained so far, we can only conclude that no consistent picture of the growth laws in off-critical quenches has been established yet. The strong variance of the reported growth exponents might indicate that several rival scaling regimes lead to the measuring of an exponents that are still in crossover regimes. Recently Corberi et al. [20] speculated about a possible candidate for a very early time regime. Caused by the competition of various fixed points, this regime could be visible in off-critical quenches and would lead to a growth exponent of .
In the present paper we study extensively the dependence of on the concentration of the minority phase at different temperatures. Starting from known behaviour in the critical quench we find strong evidence for a late time growth regime with , which is stable over a wide range of concentrations. For early times we do not find such a distinct regime, but a continuously varying growth exponent. Possible reasons for this result are discussed.
The kinetics of domain growth of ternary amphiphilic fluids, where the presence of surfactant causes a drop in the interfacial tension between the two otherwise immiscible fluids, for example oil and water, is a comparatively new field of study. In the case of microemulsions, for which there is a sufficient quantity of surfactant present, the domains in these amphiphilic systems exhibit a preferred length scale, and hence scale invariance must break down. As a consequence of this we no longer expect algebraic power growth laws in the late time kinetics. Instead, the requirement that surfactant molecules sit at oil-water interfaces will lead to a saturation of domain growth. Previous work studied the domain growth using numerical integration of Landau-Ginzburg models, for example the hybrid model of Kawakatsu et al. [21] and the two-local-order parameter model of Laradji and coworkers [22, 23]. These models do not include hydrodynamic effects and find that surfactant modifies the kinetics from the binary algebraic exponent to a slow growth that may be logarithmic in time. More recently Laradji et al. [24] have modelled phase separation in the presence of surfactant using a very simple molecular dynamics model, which implicitly includes hydrodynamic forces. These authors found that such systems exhibit nonalgebraic, slow growth dynamics and a crossover scaling form, which describes the change from the domain growth in pure binary immiscible fluids to slower growth which occurs when surfactant is present. Emerton et al. [10], using a lattice-gas automaton model [3] which implicitly includes fluctuations and hydrodynamics, found with increasing surfactant concentration a crossover from algebraic growth with to , then to logarithmic growth and finally to saturation, which they fitted phenomenologically to a stretched exponential function.
All the papers mentioned above studied the kinetics of domain growth within the sponge phase, the two dimensional equivalent to the bicontinuous phase, where equal amounts of oil and water are present. No work has been undertaken so far to study self-assembly kinetics in the “off-critical” or droplet microemulsion phase. However, with our amphiphilic lattice-gas model, we can readily access all the different microemulsion phases; indeed, it has been shown that this model is able to successfully simulate the droplet phase [3].
The purpose of the present paper is therefore to make a detailed, quantitative study of domain growth in off-critical quenches within binary immiscible and ternary amphiphilic fluids. Our paper is organized as follows: Sec. II briefly reviews the lattice-gas model we are using. In Sec. III we report our results of off-critical quenches in binary fluids. The results of our simulations in the droplet phase are given in Sec. IV. In Sec. V we look at the transition between droplet and sponge phases. Finally, in Sec. VI, we discuss our results.
II The Lattice-Gas Automaton Model
Our lattice-gas model is based on a microscopic particulate format that allows us to include dipolar surfactant molecules alongside the basic oil and water particles [3]. In this paper we are concerned only with a two-dimensional version of the model, though an extension to is currently underway [25]. Working on a triangular lattice with lattice vectors () and periodic boundary conditions, the state of the model at site and time is completely specified by the occupation numbers for particles of species and velocity .
The evolution of the lattice gas for one timestep takes place in two substeps. In the propagation substep the particles simply move along their corresponding lattice vectors. In the collision substep the newly arrived particles change their state in a manner that conserves the mass of each species as well as the total -dimensional momentum.
We allow for two immiscible species which, following convention, we often represent by colours: (blue) for water, and (red) for oil, and we define the colour charge of a particle moving in direction at position at time as . Interaction energies between outgoing particles and the total colour charge at neighbouring sites can then be calculated by assuming that a colour charge induces a colour potential , at a distance away from it, where is some function defining the type and strength of the potential.
To extend this model to amphiphilic systems, we also introduce a third (surfactant) species , and the associated occupation number , to represent the presence or absence of a surfactant particle. Pursuing the electrostatic analogy, the surfactant particles, which generally consist of a hydrophilic portion attached to a hydrophobic (hydrocarbon) portion, are modelled as colour dipole vectors, . As a result, the three-component model includes three additional interaction terms, namely the colour-dipolar, the dipole-colour and the dipole-dipole interactions.
Note that in order to incorporate the most general form of interaction energy within our model system, we introduce a set of coupling constants , in terms of which the total interaction energy can be written as
| (II.1) |
These terms correspond, respectively, to the relative immiscibility of oil and water, the tendency of surrounding dipoles to bend round oil or water particles and clusters, the propensity of surfactant molecules to align across oil-water interfaces and a contribution from pairwise (alignment) interactions between surfactant. In the present paper we analyze domain growth of off-critical quenches within both binary and ternary systems and consequently the coefficients with which we are most concerned are for the binary fluid case and and for the ternary fluid case.
The collision process of the algorithm consists of enumerating the outgoing states allowed by the conservation laws, calculating the total interaction energy for each of these, and then, following the ideas of Chan and Liang [26] (see also Chen et al. [27]), forming Boltzmann weights
| (II.2) |
where is an inverse temperature-like parameter. The post-collisional outgoing state and dipolar orientations can then be obtained by sampling from the probability distribution formed from these Boltzmann weights; consequently the update is a stochastic Monte-Carlo process. The dipolar orientation streams with surfactant particles in the usual way.
The parameter space of our model has certain important pairwise limits. With no surfactant in the system, Eq. (II.1) reduces to the colour-colour interaction term only, which we note to be exactly identical to the expression for the total colour work used by Rothman and Keller [28] to model immiscible fluids. Correspondingly, with no oil in the system we are free to investigate the formation and dynamics of the structures that are known to form in binary water-surfactant solutions. Indeed, in the original paper Boghosian et al. [3] investigated both of these limits. In the limit of no surfactant they obtained immiscible fluid behaviour similar to that observed by Rothman and Keller, and for the case of no oil in the system they found evidence for the existence of micelles and for a critical micelle concentration. It could be shown that this model exhibits the correct equilibrium microemulsion phenomenology for both binary and ternary phase systems using a combination of visual and analytic techniques; various experimentally observed self-assembling structures, such as the droplet and sponge microemulsion phases, form in a consistent manner as a result of adjusting the relative amounts of oil, water and amphiphile in the system. The presence of sufficient surfactant in the system is shown to halt the expected phase separation of oil and water, and this is achieved without altering the coupling constants from values that produce immiscible behaviour in the case of no surfactant. Later studies [10] showed that the model exhibits the correct dynamic behaviour in the case of critical quenches of binary fluids and was able to give quantitative results for the self-assembling kinetics in the microemulsion phase of a ternary oil-water-surfactant fluid.
III Phase separation in binary immiscible fluids
In contrast to other lattice-gas models, the Monte-Carlo aspects of our model allow us to access different scaling regimes by varying the inverse temperature-like parameter (see Eq.(II.2) and [10]). In lowering , the collision step of the time update results in a slower phase separation mechanism acting at the interface between the two binary fluids, which means that the surface tension is reduced. Since the bulk viscosity is independent of [26], by lowering we can raise the hydrodynamic length [5], where is the kinematic viscosity, is the density and is the surface tension coefficient; this enables us to access the high viscosity regime ().
To analyze the domain growth quantitatively we need to measure a quantity that captures the length scale of the minority phase domains. Since our model is symmetric with respect to oil and water particles, we will call the minority component of our fluid oil. As opposed to critical quenches, we now have two typical length scales in our simulation, one being the size of oil structures, the other being the one of water structures. Therefore, we cannot now use the oil-water density difference as input into the pair correlation function, as done in earlier work [10]. Since we are interested in the domain growth of the minority phase, it is convenient to measure the oil based coordinate-space oil-correlation function. At time following the quench, this correlation function is given by
| (III.3) |
where is the oil density (total number of oil particles) at site and time , is the average oil density per site, is the volume, and the average is taken over an ensemble of initial conditions. The prime on the sum implies that the sum extends over all lattice sites with , i.e. with at least one oil particle per site. Taking the angular average of gives , the first zero crossing of which we take as a measure of the characteristic domain size.
All simulations started from random placement of the oil and water particles on the underlying lattice. Comparative runs have shown that a lattice size of is large enough to avoid finite-size effects during the time scales studied. We set in Eq. (II.1), and varied to access the different fluid regimes as described above.
Previous studies of critical quenches [10] had shown that, by using a value of , we are able to access the hydrodynamic regime with a growth exponent of in critical quenches. In order to study the behaviour of the growth exponent for a wide range of concentrations, we kept the reduced density of water (the majority component) at , while varying the reduced density of oil from up to . This translates to concentrations §§§Note that the term reduced density refers to the ratio of the number of all oil particles in the system to the number of all possible locations (seven per lattice site) in the system, which includes empty locations. The concentration of oil, however, is the ratio of the number of oil particles to the total number of particles. of the minority phase from up to , increasing in steps of roughly . The behaviour of each system was studied for five runs over 10000 timesteps each, the domain size being measured every 50 timesteps. We plotted on a double logarithmic scale to identify possible algebraic growth.
At very low concentrations of oil, we obtained algebraic growth at early times and noisy behaviour at late times, which indicates that the system has reached a point at which the fluctuations dominate over the phase separation. Nevertheless, we see a growth exponent of at , and a rapid increase in the exponent to at as we increase the oil concentration. With increasing oil concentration we observe that the noise reduces and vanishes for oil concentrations above . We explicitly checked for finite size effects in this region and found that the domain growth exponent measured on a lattice does not differ from our results from the smaller systems. Starting from concentrations of up to we find that the domains grow algebraically in time with an exponent . This plateau in the growth exponent indicates the existence of a scaling regime in the late time kinetics, which are dominated by hydrodynamic effects. Similar values have been reported by other authors [6, 8, 17], but our results allow us to exclude a smooth transition between and as proposed by one of these papers [6]. The measured growth exponent contradicts, however, the results of Osborn et al. [13], who reported . We believe that the reason for this discrepancy is precisely the same as in the case of critical quenches, namely the absence of fluctuations in their model, which seem to play a vital role for early time and off-critical quenches. This result is also below the theoretical prediction by Furukawa [12] and San Miguel et al. [11]. We will discuss possible reasons for this at the end of this section. As the concentration of oil is increased further, the growth exponent increases quickly with concentration and finally reaches its value from the critical quench of at concentrations of onwards. For typical results of this first set of simulations compare Fig. 1.
In order to study the early time regime in more detail, we performed additional simulations at lower values of , where we observe the early time growth in the critical quenches. As described above, a lowering of corresponds to an increase in the hydrodynamic length . In this case we chose , which leads to a crossover between the viscous and the hydrodynamic regime in the critical quench. A further decrease to results in domain growth with [10] throughout the observed time scales, which is evidence for the viscous regime. The decrease in means, however, that we also raise the effective temperature in our system, thus increasing fluctuations. These fluctuations again become dominant at small concentrations of oil. Despite this effect, we are able to get reliable results from concentrations as low as . From concentrations of onwards, the noise vanishes from our simulations, and we observe clear growth exponents of and for and , respectively. Some results are displayed in Fig. 2 for and Fig. 3 for . Unlike the late time dynamics, we do not find a unique universal growth exponent over a wide range of concentrations. The strong dependence of on the minority phase concentration could explain why several authors [6, 13, 16, 18] have reported values considerably lower than the value of found in most studies. These anomalies may be due to the fact that within such simulations only the early time regime, for which behaviour depends on the concentration and on the temperature, is probed. This might be evidence that we do not have a single, dominant scaling regime in the early time droplet growth in off-critical quenches. In this case the question remains as to what the other growth regimes are. One possible candidate is certainly the Lifshitz-Slyozov evaporation-condensation growth with , but our results do not show any evidence for this. In a renormalisation group analysis, Corberi et al. [20] recently speculated about another very early time regime in binary immiscible fluid phase segregation, which might be due to a newly discovered fixed point. Their Langevin approach lead them to an exponent of . This is exactly the lowest value that we find for as seen in Fig. 1. Our results in the simulations with and , however, do not agree with their conclusions, since our lowest measurable growth exponent was , but as mentioned above, these simulations were perturbed by strong fluctuations. At this parameter setup we performed additional simulations on a lattice to exclude finite size effects and get excellent agreement between the different runs. We also note that molecular dynamics simulations undertaken by Velasco and Toxvaerd [6] found a very slow growth regime as well. Results from our ternary amphiphilic fluid studies even indicate that there is no lower threshold for (see discussion in Sec. IV & VI).
A different explanation for the variance of the early time exponents might be that corrections to a scaling regime lead to the measurement of exponents which are time dependent and only asymptotically reach the predicted values. This mechanism was indeed responsible for the non-observance of Lifshitz-Slyozov growth in Monte-Carlo simulations of an Ising model [29]. In fact, the prediction of Yao et al. [14] of in non-hydrodynamic off-critical quenches would provide an argument for this explanation. By plotting against we tried to detect this growth law, but did not find evidence for it. A detailed study of this most interesting question would involve the measurement of effective exponents and require extensive computational effort which is beyond the scope of this paper.
Another interesting fact is that a convincing explanation of the shift in the late time growth exponent is still missing. All except one simulation report results below the value of derived by Furukawa [12] and San Miguel et al. [11]. Furukawa himself mentions possible deviations from this growth exponent due to internal flows among droplets caused by the surface tension, which cannot be neglected in the off-critical quench. The measured exponents therefore may still be in the time-dependent crossover regime, which is anomalously – or according to Furukawa even infinitely – elongated. To understand the mechanism behind the domain growth law, simulations in three dimensions are highly desirable. In three dimensions the predictions by Furukawa and San Miguel et al. differ, so simulations and experiments should be able to determine the growth regime.
A summary of all our results from the binary fluid simulations is given in Fig. 4, which shows how the growth exponent depends on the concentration of oil for the different regimes.
IV Domain growth in ternary amphiphilic fluids
We now turn to the analysis of the ternary amphiphilic system. We expect that the presence of surfactant in an oil-water mixture will change the domain growth behaviour dramatically, due to the reduction of surface tension between oil-water interfaces. Starting from a binary mixture of oil and water, where oil once again is the minority phase, adding small amounts of surfactant will not change the growth kinetics on the time scales observed. With increasing concentration of amphiphile, however, the drop in surface tension will take the system to progressively earlier growth regimes. From our results in the binary immiscible fluid case above, we therefore expect an algebraic growth regime with growth exponent at low surfactant concentrations. We expect to see that an increase in the reduced density of surfactant, , leads to a decrease in the growth exponent, at least up to , our last reliable result in the binary fluid case. In the presence of amphiphile we are now able to access early time regimes without lowering ; therefore we do not have to deal with noise as in the binary fluid regime, so we might actually be able to speculate about very early time regimes. Of course, one important caveat has to be mentioned here: the presence of surfactant molecules may have various effects on the domain growth, so we must be cautious in extrapolating the ternary results to the binary immiscible fluid system.
Moreover, with sufficient surfactant in our system, we should see the formation of a stable droplet phase, in which oil particles will be surrounded by a monolayer of surfactant, that separates the oil from the water domains. The fact that surfactant particles have to sit at oil-water interfaces, must eventually lead to arrest of domain growth. The oil droplets reach an average droplet size that we expect to be inversely proportional to the amount of surfactant present at the oil-water interfaces [10].
Previous studies [10] of self-assembly kinetics in the sponge phase showed a crossover to logarithmically slow growth with increasing surfactant concentration. At sufficient high surfactant concentration, the average domain size was fitted phenomenologically to a stretched-exponential form,
| (IV.4) |
in which the parameters and have to be determined numerically.
For our simulations we used a lattice, starting from a random placement of the particles on the lattice. We set the temperature-like parameter to in order to reduce noise in our simulations, but without slowing down the kinetics. For the coupling constants in the interaction energy of Eq.(II.1) we used
which will encourage the amphiphilic dipoles to sit at oil-water interfaces, as well as bending of amphiphilic interfaces, both characteristic features of the droplet phase [3]. In our simulations, we kept the water:oil ratio fixed, while varying the concentration of surfactant. We studied water:surfactant:oil ratios from up to , while keeping the total reduced density between and . We will describe our results in terms of the surfactant:oil ratio . All simulations were ensemble-averaged over at least five runs. The average oil droplet size was again taken to be the first zero of the correlation function defined in Eq(III.3).
The results for systems with and are shown in Fig. 5. In both cases we see algebraic growth throughout the time scale studied. Whereas for the growth exponent was found to be as in the corresponding off-critical quench in the binary fluid system, we observe a slight decrease in the exponent for , where . This is due to the fact that the presence of surfactant reduces the oil-water interfacial tension, therefore reducing the driving force of the phase separation. Similar behaviour has been found for values of between the two shown here. Visualization of these simulations demonstrated the formation of oil bubbles which are partially covered by a thin layer of surfactant. In all these simulations we did not see any domain saturation effects due to the presence of surfactant.
At we observe a slight kink in the domain size vs. time plots, indicating faster algebraic growth at late times. First we expected this to be due to the crossover to the regime with . A further increase to showed that we were dealing with a new kind of behaviour, since the growth exponent in the late time regime was clearly above the expected value. Plots with and are given in Fig. 6. We observe this phenomenon over a wide range of surfactant concentrations, starting from up to . We explicitly checked that the kink is not due to a finite size effect. The results from five simulations with on a lattice are in excellent agreement with the results found on the usual lattice. A summary of all our simulations with algebraic early-time growth showing this kind of behaviour is given in Table I.
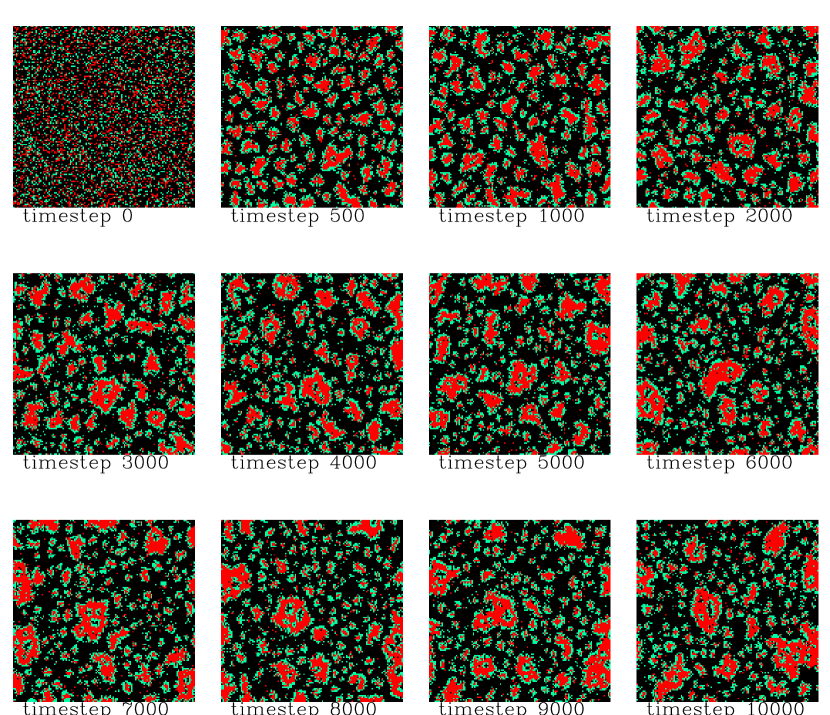
To examine the physical significance of this process, we visualized system configurations for several simulations. A typical result is shown in Fig. 7, where . At this surfactant concentration, the faster late time growth starts after timesteps. We explain this phenomenon by a nucleation process. While some droplets above a possible critical size continue to grow, smaller droplets in the surrounding areas shrink; therefore our system now contains two length scales. Moreover, as is clearly visible in the figure, the larger oil droplets contain water droplets of size similar to the smaller oil droplets. This is evidence that our system has moved from the oil droplet phase as seen at timesteps into a coexistence region of oil and water droplet phases, in which two length scales exist, one connected to the size of all small droplets and one corresponding to the size of the larger oil droplets. The transition between a pure phase and two coexisting phases may be connected with an energy threshold, which explains the nucleation process that we see in our simulations.
In order to get quantitative evidence for this, we measured the sizes of droplets directly from the visualized data and plotted a histogram of number of droplets vs. droplet area for several timesteps. We observe that, associated with the nucleation process, a gap emerges in the histogram. Whereas at early times about of all droplets have radii between and , this value drops below at timesteps after nucleation. The existence of this gap can be shown very drastically: Although we allow a large overlap of ‘small’ (radii between 2 and 11) and ‘large’ (radii between 5.5 and 50) droplets, Fig. 8 shows that we are really dealing with two length scales in our system. These plots of the time evolution of small and large droplets show opposite behaviour after a common early-time growth: Whereas the size of the smaller droplets decreases slightly during the time scales observed, the larger droplets grow considerably. Similar studies have been made for several values of , all showing the same typical behaviour. However, the characteristics of the existence of two length scales become weaker with increasing surfactant concentration. This is connected to the noisy behaviour in the fast growing late-time regime, which is visible in Fig. 6 for . We explain this as follows: Since an increasing amount of surfactant means that the average size of a droplet shrinks, the distinction between larger and smaller droplets becomes more difficult to make, and even after the nucleation takes place, there is a rapid exchange of particles between the two typical droplet sizes. Therefore the gap in the droplet size histogram vanishes gradually. As a result we see a wildly fluctuating overall domain size after the nucleation takes place.
Perhaps most interesting is that the surfactant molecules seem to play two distinct and opposing roles in the two growth regimes. The early time growth is further and further suppressed by the presence of amphiphiles in our system, resulting in a drop of the growth exponent from values of at to at . This can be explained by the reduction of oil-water interface tension, resulting in a decrease of the phase separation driving force. After the nucleation, however, the growth exponent increases with from values of at up to at . Therefore we conclude that surfactant molecules play a catalytic role in the nucleation process.
When we increase the surfactant concentration still further, we observe deviations from the algebraic early-time growth, as shown in Fig. 9, whereas the late time behaviour (in spite of the noise mentioned above) can still be described as algebraic growth. In order to investigate whether the presence of surfactant now leads to logarithmically slow growth, we have plotted the domain size vs. on a logarithmic scale. The results for and are shown in Fig. 10. This kind of logarithmic growth, , suggests that our system shares some common features with pinned domain growth in systems with quenched disorder [5], reported by Laradji et al. [24] and in the study of the self-assembly kinetics of the sponge phase using the same lattice gas model [10]. We observe logarithmic growth in the early time regime from a surfactant:oil ratio up to , during which the exponent decreases from to . This slow growth of the oil droplets indicates that we are now very close to the point when the oil droplet domains become saturated. At late times, however, we still observe nucleation followed by very noisy growth.
Saturation of oil droplets is first reached at , when we see clear deviations from the logarithmic growth at timesteps, as shown in Fig. 11. Also the nucleation process stops, since the noise at late times vanishes — the tendency of surfactant to sit at oil-water interfaces has overcome the immiscibility of oil and water. As shown in Fig. 12, oscillations in the average droplet size decrease with a further increase of the surfactant concentration. These fluctuations also occurred in the study of the sponge phase [10], and correspond to the continual break up and reformation of droplets, resulting from the finely balanced competition between the immiscibility of oil and water and the action of the surfactant molecules. We again checked explicitly whether finite size effects lead to arrested domain growth and found none on the time scales of our simulations. The fit of domain growth to the stretched-exponential form (Eq.IV.4) is also included in this figure and successfully describes the behaviour of the system over the whole time-scale of these simulations. Of the four coefficients of this function, only the decay rate and the stretching exponent are of physical interest. Whereas does not depend very strongly on the surfactant concentration, increases with it.
A possible explanation of this stretched exponential form of domain growth can be given, when we assume that close to the saturation point relaxation times accumulate in our system. If we also include an essential singularity as a weighting function and cutoff of the different relaxation times, we then get
| (IV.5) |
instead of a simple exponential decay. Applying the method of steepest descent to the integrand, we derive , where and . If we look at the values of and as functions of the surfactant concentration, we see that both go asymptotically to a finite value that is always reached at . Whereas decreases to approach , increases until it reaches . This asymptotic behaviour might indicate that and are more fundamental variables than and . Stretched exponential decay has been reported by NMR experiments in porous media [30] and it seems plausible that the complex systems of surfactant mixtures inhibit similar features. However, we are far from an understanding of the physical reasons of the accumulation of relaxation times.
V Transition between Droplet and Sponge Phase
In addition to our other results, we also performed several simulations to study the transition between the droplet and the sponge phase. In order to access both of these different phases, we changed our interaction parameters to the set used in [3], which already proved to accommodate both phases, depending on the concentrations of oil, water and surfactant. In our simulations we used a lattice, set the temperature-like parameter , and the interaction parameters to
There are some slight differences in these values compared to those used in Sec. IV. We increased and decreased in order to reduce the tendency of the interfaces to bend, while promoting the propensity of surfactant to align at oil-water interfaces. We kept the reduced densities of water and surfactant fixed at and , while varying the reduced density of oil from up to . This means that we start with a dilute oil phase, where the surfactant-oil ratio is , and so well above the value we found necessary in the previous section to form a stable droplet phase. The upper limit with equal amounts of oil and water still contains enough surfactant to form a sponge phase [10].
We expect that with increasing oil concentration the saturated state would contain increasingly larger and deformed droplets indicating the tendency to reduce the interfacial free energy and the consequential formation of larger structures. At one point, these deformed droplets will percolate, resulting in the sponge phase. An interesting question is whether the stretched-exponential form of domain growth can be consistently applied during the phase transition. Whereas this form was shown to give good results in both limits, the applicability in the crossover has yet to be shown.
We investigated our results by visualization and plots of domain size against timesteps on different scales. In all cases we could not see algebraic growth even at early timesteps, indicating that the high amount of surfactant used drastically changes the usual domain growth. For the early-time behaviour we found logarithmic growth, , with growth exponents of for , for and and for and . At late times, however, the data points for all simulations but for , which will be discussed below, are consistently below that function and move towards a saturated value. Fitting the data to the stretched exponential form gave good agreement with the measured points, as shown in Fig. 13. This indicates that the stretched exponential form is applicable in describing the domain growth in a wide range of microemulsion phases. For , however, we saw behaviour similar to our results in the droplet phase with . Following an early-time logarithmic growth, a nucleation process takes place after which we observe very noisy behaviour. Visualization of these simulations also revealed similarities, with the formation of two distinct droplet-sizes and formation of water droplets in larger oil droplets. Visualization of the other simulations confirmed that at we see stable circular oil droplets of one size. At we find that some of the droplets continue to grow and are deformed into ellipses and stripes, but do not yet connect to form the larger structures that are characteristic of the sponge phase. At the latter structures have formed, and are difficult to distinguish from the case , where equal amounts of oil and water are present.
VI Discussion and Conclusions
We have studied both binary immiscible fluid and ternary amphiphilic fluid dynamical behaviour in off-critical quenches using our hydrodynamic lattice-gas model. In the binary case we found algebraic scaling laws in the early and late time behaviour of the system over a wide range of concentrations of the minority phase. In the late time regime, our results give a growth exponent of for minority phase concentrations ranging from up to . This is in agreement with other simulations [6, 8, 17], which all studied domain growth for one or two different concentrations, but is below the theoretical prediction by Furukawa [4] and San Miguel et al. [11]. In the early time regime we do not find such a dominating scaling regime. Instead we find a strong dependence of the growth exponent on the concentration of the minority phase. Although noise interferes with our results, we find a growth exponent of as the lowest value in the early time regime, slightly below the value of , predicted by a renormalization group approach [20]. Results from the ternary amphiphilic fluid case indicate that the lower threshold is even below the value of , as the presence of surfactant, which has shown to move the system towards early-time growth [10], reduces the early-time growth exponent to . Possible reasons for the variation of are the existence of two or more growth regimes or corrections of scaling regimes, that lead to an asymptotic behaviour of the growth exponent.
In the ternary case with surfactant present, the kinetics of the droplet phase self-assembly have been studied. Little is currently known experimentally about amphiphilic kinetics, so simulations provide the only way to deal with the effects that arise in these systems. We find that the presence of amphiphilic molecules affects the self-assembly kinetics very dramatically. For the early time dynamics we find algebraic growth, the growth exponent diminishing as the surfactant concentration is raised. At sufficiently high surfactant concentrations, we find a second scaling regime in which the surfactant hastens the process of domain growth. We were able to show that after this nucleation process two length scales control the behaviour of our system. We found evidence that the system is then in a coexistence region of the oil- and water-droplet phases. This nucleation process has never been reported before. At surfactant concentrations above twice the oil concentration we find that the growth law can be better described as logarithmic, . This behaviour has been found in several earlier papers [10, 24], which studied the dynamics of the sponge phase, and might be a common feature of emulsions. At surfactant concentrations that are three times as high as the oil concentration, we find saturation of the oil droplets that can be described well with a stretched exponential function. As domain saturation occurs, the nucleation mechanism is no longer seen in our simulations, indicating that the stability of the droplet phase is now beyond the critical value at which the system undergoes a transition into the coexistence region.
Finally we studied the transition between the droplet and the sponge phases, where we demonstrated that our system consistently simulates the correct behaviour in the transition between both of these limits. The validity of the stretched exponential form during this transition was shown. We were able to show that an accumulation of relaxation times combined with an essential singularity in the weighting function of the relaxation times can result in a stretched exponential form.
Detailed experimental studies of amphiphilic self-assembly kinetics would be valuable for comparison with the stretched exponential behaviour found here, and to explore further the nature of the nucleation process revealed in the present study.
Acknowledgements
FWJW, PVC and BMB would like to thank Alan Bray, Colin Marsh, Andrew Rutenberg and Julia Yeomans for stimulating discussions. FWJW is indebted to the Bayerische Begabtenförderung and Balliol College, Oxford University, for supporting his stay in Oxford. BMB and PVC acknowledge NATO grant number CRG950356 and the CCP5 committee of EPSRC for funding a visit to U.K. by BMB. PVC is grateful to Wolfson College and the Department of Theoretical Physics, Oxford University, for a visiting fellowship (1996-1998).
REFERENCES
- [1] Gelbart, W.M., Roux, D., Ben-Shaul, A. (eds) Modern Ideas and Problems in Amphiphilic Science. Berlin: Springer (1993).
- [2] Gompper, G., Schick, M., Phase Transitions and Critical Phenomena. 16 (1994) 1-181.
- [3] Boghosian, B.M., Coveney, P.V., Emerton, A.N., Proc. Roy. Soc. Lond. A. 452 (1996) 1221-1250.
- [4] Furukawa, H., Adv. Phys. 34 (1985) 703.
- [5] Bray, A.J., Adv. Phys. 43 (1994) 357-459.
- [6] Velasco, E., Toxvaerd, S., Phys. Rev. E 54 (1996) 605.
- [7] Lookman, T., Wu, Y., Alexander, F.J., Chen, S., Phys. Rev. E 53 (1996) 5513.
- [8] Coveney, P.V., Novik, K.E., Phys. Rev. E 54 (1996) 5134.
- [9] Kumar, P.B.S., Rao, M., Phys. Rev. Lett. 77 (1996) 1067.
- [10] Emerton, A.N., Coveney, P.V., Boghosian, B.M., Phys. Rev. E 55 (1997) 708.
- [11] San Miguel, M., Grant, M., Gunton, J.D., Phys. Rev. A 31 (1985) 1001.
- [12] Furukawa, H., Phys. Rev. A 31 (1985) 1103.
- [13] Osborn, W.R., Orlandini, E., Swift, M.R., Yeomans, J.M., Banavar, J.R., Phys. Rev. Lett. 75 (1995) 4031-4034.
- [14] Yao, J.H., Elder, K.R., Guo, H., Grant, M. Phys. Rev. B 45 (1992) 8173 and ibid. 47 (1993) 14110.
- [15] Chakrabarti, A., Toral, R., Gunton, J.D. Phys. Rev. E 47 (1993) 3025.
- [16] Chen, S., Lookman, T., J. Stat. Phys. 81 (1995) 223.
- [17] Wu, Y., Alexander, F.J., Lookman, T., Chen, S., Phys. Rev. Lett. 74 (1995) 3852.
- [18] Velasco, E., Toxvaerd, S., J.Phys. Cond. Matt. 6 (1994) A205.
- [19] Haas, C.K., Torkelson, J.M., Phys. Rev. E 55 (1997) 3191.
- [20] Corberi F., Coniglio A., Zannetti, M., Phys. Rev. E 51 (1995) 5469.
- [21] Kawakatsu, T., Kawasaki, K., Furusaka, M., Okabayashi, H., Kanaya, J. Chem. Phys. 99 (1993) 8200-8217.
- [22] Laradji, M., Guo, H., Grant, M., Zuckermann, M.J., J. Phys. A : Math. Gen. 24 (1991) L629.
- [23] Laradji, M., Guo, H., Grant, M., Zuckermann, M.J., J. Phys.: Cond. Matt. 4 (1992) 6715-6728.
- [24] Laradji, M., Mouritsen, O.G., Toxvaerd, S., Zuckermann, M.J., Phys. Rev. E 50 (1994) 1243-1252.
- [25] Boghosian, B.M., Coveney, P.V., in preparation.
- [26] Chan, C.K., Liang, N.Y., Europhys. Lett. 13 (1990) 495-500.
- [27] Chen, H., Chen S., Doolen, G.D., Lee, Y.C., Rose, H.A., Phys. Rev. A 40 (1989) R2850-2853.
- [28] Rothman, D.H., Keller, J.M. J. Stat. Phys. 52 (1988) 1119-1127.
- [29] Huse, D.A., Phys. Rev. B 34 (1986) 7845.
- [30] Kenyon, W.E., Day, P.I., Straley, C., Willemsen, J.F., Soc. Petroleum Engineers 3 (1988) 622.
Figures
Figure 1: Temporal (time-steps) growth of domain size (lattice units), , for , shown on a logarithmic-scale plot. The concentrations of the minority phase are, from top to bottom: . The straight lines are included as guides to the eye only and have slopes of , respectively. In order to make the plots more distinguishable, the ordinates have been multiplied by factors , from top to bottom.
Figure 2: Temporal (time-steps) growth of domain size (lattice units), , for , shown on a logarithmic-scale plot. The concentrations of the minority phase are, from top to bottom: . The straight lines are included as guides to the eye only and have slopes of and , respectively. The upper ordinates have been multiplied by a factor of .
Figure 3: Temporal (time-steps) growth of domain size (lattice units), , for binary fluid and , shown on a logarithmic-scale plot. The concentrations of the minority phase are, from top to bottom: . The straight lines are included as guides to the eye only and have slopes of and , respectively. The upper ordinates have been multiplied by a factor of .
Figure 4: Growth exponent plotted against the concentration of the minority phase. Diamonds () denote the values for , triangles () are for and boxes () for . The diagram is symmetric due to the symmetry of the model with respect to the coloured particles. Note that only the early-time exponents are plotted for the crossover regime, where .
Figure 5: Temporal (time-steps) growth of domain size (lattice units), , for a ternary amphiphilic fluid, shown on a logarithmic-scale plot. The value of is 0.25 for the upper and 0.625 for the lower curve. The ordinates for the upper curve have been multiplied by 1.5 in order to make the plots more distinguishable. The straight lines are included as guides to the eye only and have slopes of and respectively.
Figure 6: Temporal (time-steps) growth of domain size (lattice units), , for a ternary amphiphilic fluid, shown on a logarithmic-scale plot. The value of is, from top to bottom, and . The ordinates for the upper curve have been multiplied by 2, the ones for the lower curve by in order to make the plots more distinguishable. The straight lines are included as guides to the eye only and have slopes of and for the upper, and for the middle and and for the lower curve.
Figure 7: Temporal evolution of a ternary system with . Oil majority sites are red, water sites are black and surfactant sites are green. Note that the nucleation sets in between 3000 and 4000 timesteps.
Figure 8: Temporal evolution of different droplet sizes (lattice units), , for a ternary amphiphilic fluid, shown on a logarithmic-scale plot. The value of is . Boxes () show all droplets with radii between and , triangles () are for droplets with radii between and and diamonds () mark droplets with radii between and .
Figure 9: Temporal (time-steps) growth of domain size (lattice units), , for a ternary amphiphilic fluid, shown on a logarithmic-scale plot. The value of is The straight line is included as guide to the eye only and has a slope of
Figure 10: Growth of domain size (lattice units), , for a ternary amphiphilic fluid against (time-steps), shown on a logarithmic-scale plot. The value of is, from top to bottom, and . The ordinates of the upper curve have been multiplied by 1.5 in order to make the plots more distinguishable. The straight lines are included as guides to the eye only and have slopes of and respectively.
Figure 11: Growth of domain size against , shown on a logarithmic-scale plot. The value of is . The straight line is included as guide to the eye only and has a slope of
Figure 12: Growth of domain size (lattice units) against (time-steps), shown on a linear-scale plot. The results are from the study of the droplet phase; the value of is for the upper and for the lower curve. The ordinates of the upper curve have been multiplied by 1.5. The solid lines are stretched exponential fits to the data.
Figure 13: Growth of domain size (lattice units) against (time-steps), shown on a linear-scale plot. The results are from the study of the transition between sponge and droplet phase; the value of the reduced density of oil is for the upper and for the lower curve. The ordinates of the upper curve have been multiplied by 1.5. The solid lines are stretched exponential fits to the data.


Tables
Table I: Results from the nucleation regime. is the timestep at which nucleation occurs, the average domain size, and are the algebraic growth exponents in the early and late time regime, respectively, and is the surfactant:oil ratio.