Theory of self-diffusion in GaAs
Abstract
Ab initio molecular dynamics simulations are employed to investigate
the dominant migration mechanism of the gallium vacancy in GaAs as well as
to assess its free energy of formation and the rate constant of gallium
self-diffusion. Our analysis suggests that the vacancy migrates by second
nearest neighbour hops. The calculated self-diffusion constant is in good
agreement with the experimental value obtained in isotope heterostructures and at significant variance with that
obtained earlier from interdiffusion experiments in
GaAlAs/GaAs-heterostructures.
| KEYWORDS: | III-V compounds, self-diffusion, vacancy formation, vacancy mi- |
| gration, ab initio molecular dynamics |
1 Introduction
Gallium self-diffusion in GaAs is a fundamental process with important technological implications as to e.g. degradation of heterostructure devices. It is experimentally well established that this diffusion process is mediated by gallium vacancies [1, 2]. The gallium self-diffusion constant is hence proportional to the diffusivity of gallium atoms mediated by the migration of a single vacancy and to the concentration of gallium vacancies. However, the mechanism of vacancy migration is still unknown. Migration of a gallium vacancy may involve atoms on either of the two sublattices, possibly transforming one point defect into complexes of others. In fact, it has not been identified so far whether the diffusion involves only the gallium sublattice or whether it proceeds by successive nearest neighbour hops between the two sublattices.
The gallium self-diffusion constant deduced from interdiffusion experiments in multiple quantum well structures is generally associated with an activation energy of [1, 3]. Rouviere et al. [3] extracted an unusually high value for the vacancy formation entropy of from interdiffusion data compatible with a diffusion entropy of obtained earlier [1]. This is in contrast to a more recent study for GaAs isotope heterostructures. For these it was found [4] that gallium self-diffusion has an activation energy of and an entropy of diffusion .
In the present ab initio molecular dynamics study we investigate the microscopic aspects as well as the thermodynamical properties of the gallium vacancy diffusion. In section 3 we calculate the free energy of formation and the formation entropy of the gallium vacancy, which determine its concentration at thermal equilibrium. In section 4 we investigate the question for the dominant migration mechanism by ab initio molecular dynamics simulations of the motion of the neutral vacancy. Guided by our simulations we discuss the diffusion events identified therein also including the effects of the Fermi level. In section 5, the rate constant for the dominant mechanism is finally evaluated employing ab initio molecular dynamic simulations and the self-diffusion constant is calculated.
2 Computational Method
Diffusion in covalently bonded materials implies breaking and making of bonds of the migrating atom to its neighbours. This requires a method to quantitatively describe the bonding and re-bonding process along all possible migration paths. Density functional theory [5] together with a reliable approximation to exchange and correlation provides a sound basis for such a study. We employ the local density approximation to the exchange-correlation functional [6, 7]. The electron ground state is obtained by solving the Kohn-Sham equation [8], in which the core electrons are treated by the frozen-core approximation and the corresponding ion cores are replaced by fully-separable [9] norm-conserving pseudopotentials [10]. The defect system is represented by a 63 atom super cell, which is periodically repeated on a simple cubic lattice. The Kohn-Sham orbitals are expanded in a plane wave basis set including plane waves up to an energy cut-off of 8 Ry.
To study the motion of the gallium vacancy and to calculate ensemble averages related to the entropy of formation and the rate constant we perform detailed ab initio molecular dynamics simulations on the Born-Oppenheimer surface [11]. In this approach the dynamics of the gallium and arsenic nuclei is treated by classical mechanics, i.e. the motion of the nuclei is governed by Newton’s equation of motion. For any configuration of the nuclei we first find the electron ground state using density functional theory and calculate the forces. We then integrate the equation of motion of the nuclei for the next time step using the Verlet algorithm [12]. This allows for a time step of – where is the highest phonon-frequency in GaAs. This time step is much longer (by a factor 27 [13]) than that used in the Car-Parrinello method [14]. The simulations are carried out at constant volume. A Nosé-Hoover thermostat [15, 16] enables the inclusion of temperature allowing for the calculation of canonical ensemble averages.
In order to analyse the observed diffusion events and to assess migration barriers we have calculated adiabatic potential energy surfaces. In these calculations the adiabatic potential energy surface is obtained as a function of the relevant migration coordinates by constraining these coordinates and allowing for the relaxation of the other degrees of freedoms.
3 Free energy of formation
In thermodynamic equilibrium and at constant volume the concentration of intrinsic point defect is determined by the free energy of formation
where is the concentration of sites in the crystal open to the defect [17]. GaAs is a compound material and in thermal equilibrium the stoichiometry of the crystal is determined by the chemical environment. For example, an arsenic overpressure results in a higher concentration of arsenic antisite defects and gallium vacancies. The chemical potential of arsenic and of gallium may vary only within certain bounds in order to preserver the stability of the GaAs crystal. Otherwise the crystal would decompose into more stable gallium and arsenic phases. The free energy of defect formation is given by
| (1) |
where is the free energy of the super cell containing the defect, arsenic atoms and gallium atoms; and are the chemical potentials of the two species. Depending on the charge state of the defect electrons are exchanged between the electron reservoir (the Fermi level) and the defect levels. In thermal equilibrium the chemical potentials of the gallium reservoir, the arsenic reservoir and the bulk phase of GaAs are related: . Therefore we consider only the deviation of the arsenic chemical potential from the value of an arsenic-crystal: . With this definition the free energy is expressed as
| (2) |
where and is the free energy of formation with respect to a reservoir of arsenic bulk material. The allowed range for is estimated considering the bulk phases of gallium and arsenic as the limiting cases [18]. This corresponds to the range , where is the heat of formation of GaAs.
Thermodynamic integration together with ab initio molecular dynamics simulations provides a method to accurately calculate the free energy differences. It accounts for the vibrational contribution to the free energy differences also including anharmonic contributions. In this method the coupling of a gallium atom to the other atoms in the simulation cell is reduced by means of a coupling parameter in order to create a vacancy. The value refers to the perfect crystal. At the same time this atom is coupled to a harmonic oscillator to confine its motion in the cell. The decoupling is accomplished by reducing the strength of the pseudopotential of this atom by the factor , and by removing the corresponding fraction of electrons from the highest occupied defect levels. The free energy difference is then obtained by
| (3) |
where and is the total energy of the system. The derivative of the total energy with respect to the coupling parameter is readily evaluated and the canonical averages are calculated by molecular dynamics simulations. The numerical integration in Eq. (3) is performed by Gaussian integration and requires the evaluation of typically at four values of . We have calculated for the neutral vacancy at . The averages are calculated for simulations as long as and the overall statistical uncertainty in is . Having calculated , is readily obtained from
| (4) |
where is the free energy of the neutral gallium atom coupled to the oscillator potential. The chemical potentials of GaAs bulk and As bulk are obtained from total energy calculations together with the corresponding entropies, which we have calculated from the phonon spectrum in the case of GaAs bulk and taken from calorimetric measurements [19] in the case of the As bulk. We thus obtain . The resulting value for the entropy of the neutral vacancy is , which is within the range , estimated by Bernholc et al. [20] for the triply negative vacancy by a similar approach.
In the interdiffusion experiments by Rouviere et al. [3] in -type GaAlAs/GaAs multi layer quantum well structures -gas was considered as the relevant reservoir. The gallium vacancy () formation is then governed by the reaction
| (5) |
The entropy of formation deduced from these experiments amounts to . The ideal gas contribution of the -gas to the entropy has been explicitly removed from the value and for comparison we do not include it as well. In -type material the vacancies are created in a triply negative charge state and we approximate the vibrational contribution to the formation entropy by that of the neutral vacancy. For the reaction in Eq. (5) we thus obtain an entropy of . The experimental value is four times larger than our value. Note, that there is a good agreement between experiment and theory in the case of the silicon vacancy and that the formation entropies of the vacancy in silicon and the gallium vacancy in GaAs are similar. The experimental value has been determined from interdiffusion data in GaAlAs/GaAs multi layer quantum wells together with three other parameters describing the interdiffusion constant by a simultaneous fit. In the model it was assumed that the interdiffusion is essentially described by gallium self-diffusion. In fact the high experimental value may be due to other processes than the formation of gallium vacancies or even due to difficulties in the experimental analysis related to the small temperature range between and in which experimental data have been obtained.
4 The gallium vacancy migration path
Migration of atoms in solids is a fairly complex process. Especially in compound semiconductors like GaAs hops between the gallium and arsenic sublattice always imply the formation of antisite defects. Migration of the gallium vacancy may solely proceed on the gallium sublattice or by nearest neighbour hops as has been proposed by Van Vechten [21]. A migration mechanism involving nearest neighbour hops consists of a few intermediate stages, where in the final stage all the antisite defects are removed. Otherwise such a mechanism would create an unfavourable excess of antisite defects beyond the equilibrium concentration.
In order to learn about the likely events in vacancy diffusion we have performed molecular dynamics simulations of the neutral vacancy close to the melting temperature of the crystal and at constant volume. The volume of the simulation cell was fixed at the theoretical lattice constant. Our simulations identify several interesting phenomena. For example, we find that nearest neighbour hops (i.e., from the As sublattice into the Ga vacancy) occur with a rather high probability.
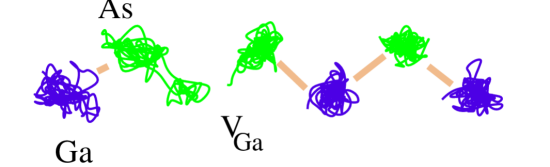
In Fig. 1 the trajectories of the atoms in the GaAs zig-zag chain containing the gallium vacancy and the hopping arsenic atom are plotted as a projection onto the (110)-plane. The simulation has been performed at a temperature of and the part shown corresponds to a simulation time of . The figure shows that the arsenic atom has jumped into the vacancy. Thereby it leaves an arsenic vacancy () behind and an arsenic antisite-vacancy complex (-) is created. Yet, after a short time () the arsenic atom returns to its initial site. For the short time when the - complex exists we find attempts of the three nearest neighbour gallium atoms to hop into the vacancy. However, analysing the potential energy surface as a function of the displacement of one of the gallium neighbours we find a plateau at the typical bond distance instead of a local minimum. Hence such a hop is impossible in the neutral charge state.
In a simulation at a temperature of we observe an attempt of a second nearest neighbour hop. The gallium atom leaves its lattice site and approaches the ideal interstitial site as close as . An analysis of the time-evolution of the bond distances to the four nearest neighbours reveals that the bond distance of three of these atoms remains effectively unchanged during this event. Only the distance to the neighbouring arsenic atom farthest away from the vacancy increases by and eventually becomes as large as .
We proceed by further analysing the events identified in the simulations. The transition state and the migration energy barrier associated with these events are evaluated by calculating the adiabatic potential energy surfaces for the coordinates we have identified supported by the simulations. In a reaction of intrinsic defects the initial defect and the final defect may be in a different charge state for a given position of the Fermi level [22]. We also include this effect in our discussion and evaluate the adiabatic potential energy surfaces for different charge states of the defect system. The migration energy barrier then depends on the position of the Fermi level.
First we discuss the nearest neighbour hop as function of the Fermi level. The coordinate
| (6) |
describes the position of the arsenic atom on the ideal bond axis with respect to the three neighbouring gallium atoms, where is the unit vector in the (111)-direction. This coordinate is compatible with what we have inferred from our simulations and it fulfils the conditions [23] for a migration coordinate. We have calculated the potential as a function of this coordinate for the relevant charge states of the defect minimising the total energy with respect to all other coordinates
| (7) |
where is the number of additional electrons in the defect levels and is the Fermi level. Note that only one coordinate is constrained and the resulting migration path of the arsenic atom not necessarily coincides with the bond axis.
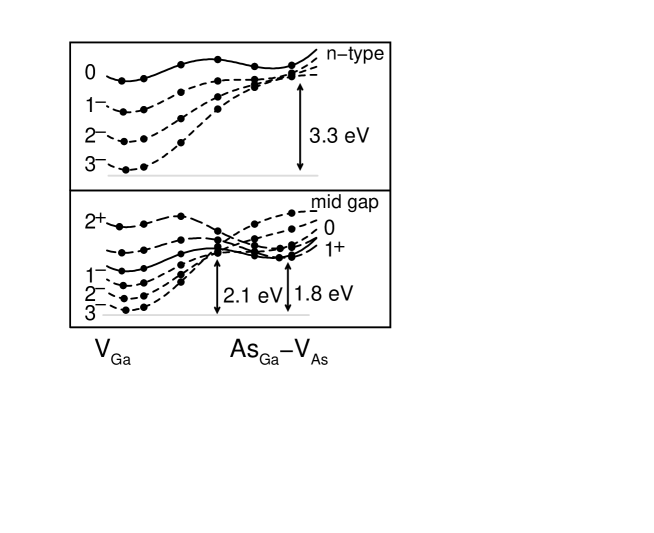
The resulting energy surfaces corresponding to negative charge states of the defect have only one local minimum at the configuration where the vacancy is at the gallium site. The -complex is thus instable in a negative charge state. For the neutral and positive charge states there exist two local minima and the -complex is stable in these charge states.
In Fig. 2 the function is plotted for two different positions of the Fermi level: close to the conduction band minimum and at mid gap. For a Fermi level close to the conduction band minimum only the negatively charged defect is favourable and as discussed above the -complex is instable. Hence a nearest neighbour hop is impossible. With a Fermi level at mid gap the gallium vacancy is in a triply negative charge state whereas for the -complex the local minimum corresponds to the neutral charge state. This energy is higher than that of the gallium vacancy. Therefore, during the hop of the arsenic atom into the gallium vacancy three electrons need to be transferred to other distant defect states. The minimum barrier for the hop is , assuming the three excess electrons are transferred instantaneously to the reservoir. For a Fermi level close to the valence band maximum the -complex is in a triply positive charge state, i.e. all electrons are removed from the localised defect levels in the band gap. The gallium vacancy is under this condition by energetically less favourable than the complex.
Most experiments for gallium self-diffusion [1, 2, 4] have been performed in -type or intrinsic material. This hop is impossible in -type material. Hence, we do not consider this mechanism as a relevant diffusion mechanism.
Guided by our simulations we develop in the following a microscopic picture of the second nearest neighbour hop. We have seen that the gallium atom in moving into the interstitial region breaks its bond to the nearest neighbour arsenic atom farthest away from the vacancy. In passing on it leaves its lattice site vacant and hops half way between the two vacant lattice sites through a plane perpendicular to the (110)-direction. This plane is a plane of mirror symmetry of the problem, i.e. if a migration path of the system through a saddle point is not symmetric with respect to this symmetry than there exist two paths related to each other by symmetry. The four gallium atoms indicated in Fig. 3a are located in this plane and form a gate through which the hopping atom has to pass. We take the centre of this gate as the origin and consider the following coordinate for the gallium atom
| (8) |
where is the unit vector in the (110)-direction. Due to the inward relaxation of the arsenic neighbours of the vacancy, the arsenic atom to which the hopping gallium atom is bonded sticks out of the plane by . During the hop this atom has to pass onto the opposite side of the gate. However, the correlation of this motion with that of the gallium atom and the path are a priori not known. Therefore we also include the coordinate defined similar to in Eq. (8) in the calculation of the potential energy surface. The potential energy surface is obtained by constraining the two coordinates and minimising the total energy with respect to all other degrees of freedom of the neutral system
| (9) |
The result is shown in Fig. 3b. The stars indicate the minima corresponding to the vacancy being on either side of the gate. We find two saddle points marked by crosses. These saddle points constitute the bottle neck through which the system has to pass in hopping to the other minimum. At the saddle points the gallium atom is located in the gate while the arsenic atom moves by out of the plane to either side. The migration barrier for the neutral system is . The configuration with the gallium atom and the arsenic atom located in the gate at the same time is by higher in energy. It is the local maximum on the potential energy surface located between the two saddle points.
There are two migration paths connecting the two minima. Along one path the gallium atom pushes the arsenic atom out of the gate in the direction of the hop. When the gallium atom has passed through the gate both atoms are located on the same side of the plane till the arsenic atom finally moves to the other side. Along the other path the gallium atom first pulls the arsenic atom through the gate before passing it. By time reversal symmetry and by mirror symmetry with respect to the plane these two paths are in fact equivalent. This corresponds to the point symmetry with respect to the origin of the potential energy surface in Fig 3b. However, if the temperature is sufficiently high both atoms may pass with a high probability through the gate at the same time. The bottle neck then also includes the local maximum at and the dividing surface separating the equivalent minima may be described to a good approximation by the plane ().
We have also calculated the migration barrier for the triply negative charge state. The configuration at the saddle points corresponds to that of the neutral system. The migration barrier in this charge state is compared to for the neutral system. Hence for the second nearest neighbour hop Fermi level effects are negligible.
5 Rate constant of the second nearest neighbour hop
As discussed above we consider the second nearest neighbour hop as the relevant mechanism of vacancy migration. Therefore we calculate the rate constant for this mechanism.
Since the migration barrier is fairly high the occurrence of such a hop is a rare event, even at high temperatures. The rate constant of such a rare event is well described by transition state theory [24]. Most of the neighbours of the vacancy will oscillate at their lattice site and the energy of the system will be close to the local minimum. Only seldom a second nearest neighbour hops through the dividing surface into the vacancy. The reduction of this surface for the two relevant coordinates is indicated by the dashed line in the contour plot of Fig. 3b. However, this dividing surface is high dimensional and involves also the other 187 degrees of freedom of the super cell, which are contributing to the entropy of the event.
At low temperatures the migrating system will closely follow the migration path depicted in Fig. 3b. The two dividing points are equivalent by symmetry and the overall rate constant is twice as large as the rate constant for one of the two migration paths. At high temperatures paths through the dividing surface passing in the vicinity of the local maximum have a considerably higher weight than at lower temperatures. In this case the two migration paths loose their importance and the migration is described by a single coordinate. As discussed in the previous section we consider the coordinate as the migration coordinate in the calculation of the rate constant.
Since paths through the dividing surface deviating considerably from the two migration paths have relevance as discussed above, we also include the anharmonicity of the potential energy surface in the calculation of the rate constant. The method suggested by Paci et al. [25] enables such calculation. In this method the corresponding ensemble averages are evaluated by molecular dynamics simulations considering all coordinates of the system. We have calculated the rate constant for the neutral vacancy at by this method. The value we obtain is
| (10) |
With an energy barrier this corresponds to . The prefactor is a factor larger than the highest phonon frequency in GaAs by which this prefactor is usually approximated in lack of a better value.
The gallium self-diffusion constant is obtained from the free energy of formation and the rate constant by
| (11) |
where is the number of second nearest neighbour sites () and is the distance between these sites (, where is the lattice constant). Gallium self-diffusion has been mainly investigated in material grown in an arsenic-rich environment and for -type doping [1, 2]. Thus the triply negative vacancy has to be considered in Eq. (11). The free energy of formation in arsenic rich environment depends on the position of the Fermi level and consequently also the diffusion constant. The experimental self-diffusion constant is therefore related to intrinsic conditions as a reference. Under these conditions the activation energy, given by the sum of the formation energy and the migration barrier , amounts to . For the activation energy Chen et al. [26] and Dabrowski et al. [27] arrived at the same value of . The prefactor , which is determined by amounts to , approximating by the value obtained for the neutral system. The gallium self-diffusion constant we obtain is . In the Arhenius-plot of the self-diffusion constant of Fig. 4 we compare our result with the fit by Tan et al. [28] to experimental interdiffusion data from GaAlAs/GaAs-heterostructures and with the fit to self-diffusion data obtained in 69GaAs/71GaAs isotope-heterostructures by Wang et al. [4]. The result for the interdiffusion constant by Tan et al. [28] is described by an activation energy of and a prefactor of . It clearly deviates from our theoretical result and the experimental result obtained in isotope heterostructures by Wang et al. [4]. Whereas the latter, described by an activation energy of and a prefactor of , is in good agreement with our result.
6 Summary and conclusion
The gallium self-diffusion in GaAs as mediated by the gallium vacancy has been investigated by means of ab initio molecular dynamics simulations. We have employed this technique as a microscope to analyse the motion of the vacancy and to assess the free energy of vacancy formation and the self-diffusion constant. It has been shown that the vacancy migrates by second nearest neighbour hops solely on the gallium sublattice. The pronounced Fermi level dependence of the migration barrier of the nearest neighbour hop lets us exclude a migration mechanism by nearest neighbour hops for the relevant experimental conditions. For a Fermi level close to the conduction band minimum the hop is even impossible. The gallium self-diffusion constant has been obtained from the calculated free energy of formation and the rate constant of the second nearest neighbour hop. Our result disagrees with a fit by Tan et al. to interdiffusion data obtained in GaAlAs/GaAs heterostructures. However, it is in good agreement with self-diffusion data measured by Wang et al. in isotope heterostructures.
References
- [1] T. Y. Tan, U. M. Gösele, and S. Yu, Crit. Rev. Solid State Phys. 17, 47 (1991).
- [2] D. G. Deppe and J. N Holonyak, J. Appl. Phys. 64, R93 (1988).
- [3] J.-L. Rouviere et al., Phys. Rev. Lett. 68, 2798 (1992).
- [4] L. Wang et al., Phys. Rev. Lett. 76, 2342 (1996).
- [5] P. Hohenberg and W. Kohn, Phys. Rev. 136B, 864 (1964).
- [6] D. M. Ceperley and B. J. Alder, Phys. Rev. Lett. 45, 567 (1980).
- [7] J. P. Perdew and A. Zunger, Phys. Rev. B 23, 5048 (1981).
- [8] W. Kohn and J. L. Sham, Phys. Rev. 140A, 1133 (1965).
- [9] L. Kleinman and D. M. Bylander, Phys. Rev. Lett. 48, 1425 (1982).
- [10] D. R. Hamann, Phys. Rev. B 40, 2980 (1989).
- [11] M. Bockstedte, A. Kley, and M. Scheffler, Comp. Phys. Comm. submitted, (1996).
- [12] L. Verlet, Phys. Rev. 159, 98 (1967).
- [13] Q.-M. Zhang et al., Phys. Rev. B 42, 5071 (1990).
- [14] R. Car and M. Parrinello, Phys. Rev. Lett. 55, 2471 (1985).
- [15] S. Nosè, J. Chem. Phys. 81, 511 (1984).
- [16] W. G. Hoover, Phys. Rev. A 31, 1695 (1985).
- [17] U. Scherz and M. Scheffler, in Semiconductors and Semimetals, edited by Willardson and Beer (Academic Press, New York, 1993), Vol. 38, Chap. 1.
- [18] G.-X. Qian, R. M. Martin, and D. J. Chadi, Phys. Rev. B 38, 7649 (1988).
- [19] C. T. Anderson, J. Am. Soc. 52, 2296 (1930).
- [20] J. Bernholc et al., in Proc. 22nd Conf. Phys. Semicond., edited by D. J. Lockwood (World Scientific, Singapore, 1995), p. 2259.
- [21] J. A. Van Vechten, J. Phys. C 17, L933 (1984).
- [22] G. Baraff and M. Schlüter, Phys. Rev. B 33, 7346 (1986).
- [23] C. H. Bennett, in Algorithms for Chemical Computation, edited by R. E. Christofferson (American Chemical Society, Washington, DC, 1977), Chap. 4, p. 63.
- [24] G. H. Vineyard, J. Phys. Chem. Solids 3, 121 (1957).
- [25] E. Paci and G. Ciccotti, J. Phys. Cond. Matt. 4, 2173 (1992).
- [26] B. Chen, Q.-M. Zhang, and J. Bernholc, Phys. Rev. B 49, 2985 (1994).
- [27] J. Da̧browski and J. E. Northrup, Phys. Rev. B 49, 14286 (1994).
- [28] T. Tan and U. Gösele, Appl. Phys. Lett. 52, 1240 (1988).
Figure captions
Fig. 1:
Nearest neighbour hop of an arsenic atom into the vacancy.
Trajectories are projected onto the (110)-plane containing the gallium vacancy and the
hopping arsenic atom.
Fig. 2:
Nearest neighbour hop: Potential energy vs.
reaction coordinate for the relevant charge states for a Fermi level
corresponding to -type conditions and a Fermi level at mid gap.
Fig. 3:
Second nearest neighbour hop: (a) geometry. The four
atoms labelled ,…, form the gate through which the
hopping gallium atom has to pass. The arrow indicates the direction of the hop
and the point of return of the gallium atom found in the simulations is also
shown. (b) potential energy surface. The coordinates and
are as depicted in (a) (c.f. text). The crosses mark the saddle
points and the stars indicate the minima. The dividing surface is indicated by
the dashed line.
Fig. 4:
Gallium self-diffusion constant vs. inverse temperature.
Comparison of the theoretical result (solid) with the fit by Tan
et al. [28] to interdiffusion data (dashed) and the fit by Wang
et al. [4] to self-diffusion data (dashed-dotted).