Electronic Properties of the Semiconductor RuIn3
Abstract
Temperature dependent measurements of the resistivity on RuIn3 single crystals show a semiconducting behaviour, in contrast to previously published results Roof ; Poettgen . In the high temperature range the semiconducting gap was measured to be eV. We observe an anisotropy of the resistivity along [110] and [001] orientations of the tetragonal single crystals. At low temperatures two activation energies of impurities were estimated to 1 meV and 10 meV. The temperature dependence of the specific heat and the band structure calculations provide also a semiconducting behaviour of RuIn3.
pacs:
71.20.Lp, 72.20.-i, 71.20.Mq,Nr, 81.10.-hI introduction
Intermetallic compounds formed by elemental metals with good conductivity are usually metallic conductors as well. A decade ago, R. Pöttgen Poettgen in a study of the crystal structure and physical properties of RuIn3 reported on metallic conductivity of this compound. However, for the isostructural compounds FeGa3 and RuGa3 electrical resistivity measurements revealed a semiconducting behaviour Haeussermann . Since isostructural gallides and indides of the same group of transition elements have the same number of conduction electrons, the same type of conduction mechanism should be expected. All these compounds crystallise in the tetragonal FeGa3 structure (space group P42/mnm) and should show anisotropic electrical properties.
The measurements on RuIn3 Poettgen were performed on polycrystalline material obtained by solid state reactions in sealed tantalum tubes, while the measurements on FeGa3 and RuGa3 Haeussermann were performed on small unorientated single crystals grown from a Ga-flux. In this article we report on anisotropic transport properties and on caloric properties on RuIn3 single crystals, which confirm the semiconducting nature of this compound. The experimental results were strongly supported by LDA band structure calculations, which give an indirect band gap of 0.41 eV. Furthermore, the band structure calculations provide a qualitative explanation of the observed transport anisotropy.
II experimental
Single crystals of RuIn3 were grown using the flux method Canfield with Indium as reactant and as flux medium. An ingot of Ruthenium (0.4 g) was placed at the bottom of a small Al2O3 crucible which was subsequently filled with liquid Indium. The mass ratio of Ru to In used was about 1:20. The crucibles were wrapped by Zr foil and placed in a vertical tube furnace under flowing Ar at atmospheric pressure. Afterwards the furnace was heated to 1150 ∘C and cooled with a rate of 4 ∘C/h to 600 ∘C and below this temperature with a faster rate to 20 ∘C.
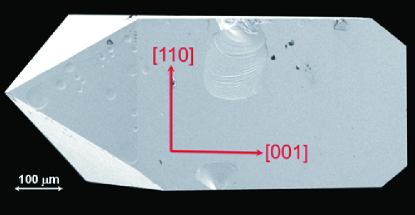
The crystals were removed from the solidified In by heating the crucibles to 200 ∘C and decanting the liquid Indium excess. The single crystals were then etched in dilute HCl to remove the residual In from their surfaces. Well-shaped silvery-gray crystals with sizes of up to 5 mm and masses of about 250 mg were typically obtained. The crystals consist on parallelepipeds with [110]-faces and two pyramidal apexes with [111]-faces (see Fig. 1). The different faces of the single crystals were characterised by x-ray diffraction and the orientations were controlled by Laue-diffraction. The stoichiometry of the crystals determined by EDX analysis gives a composition of 250.2 at% Ru and 750.45 at% In.
To measure the anisotropy of the resistivity the Montgomery-geometry Montgomery was chosen (see inset Fig. 2). The crystals were cut by spark erosion in cubes with edge lengths of 1.5 mm and supplied with four metallic contacts at the corners of the cubes. In addition measurements of the Hall-coefficient were performed on thin platelets of the same crystals. The measurements of the resistivity were done between 0.06 K and 400 K with a standard Lock-In technique. The measurements of the Hall-coefficient and specific heat were performed between 2 K and 300 K using a Quantum Design PPMS.
III results
The temperature dependence of the resistivity obtained by the Montgomery-method on a single crystal of RuIn3 is shown in Fig. 2.

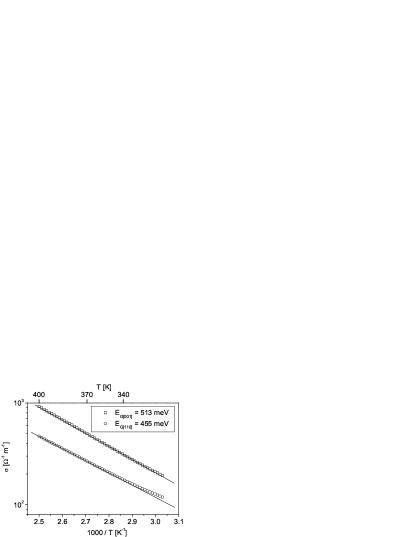
The resistivity ratio [110]/[001]=2.3 at T=400 K shows the anisotropy of the tetragonal crystals. The resistivity increases with decreasing temperature in the range from 400 K to 270 K. In this temperature range the conductivity can simply be fitted by the equation for the intrinsic conductivity of a semiconductor. From a plot of vs. inverse temperature shown in Fig. 3 the gap energy of RuIn3 can be estimated to =0.455 eV and =0.513 eV, respectively.
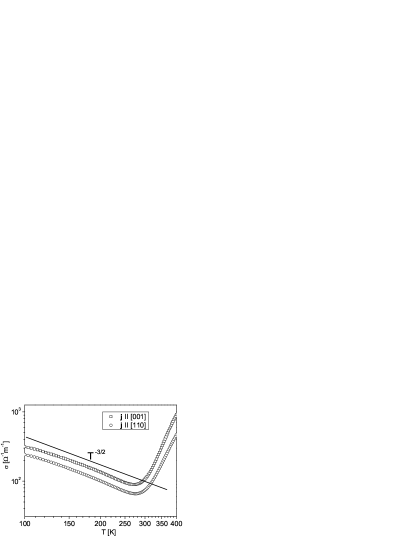
In the temperature region between 270 K and 120 K the Hall-coefficient of all measured samples is more or less constant and therefore the carrier concentrations were assumed to be constant. In this case the temperature dependence of the conductivity is caused by the temperature dependence of the mobility. If the scattering of the carriers is dominated by acoustic phonons a dependence should be observed. Fig. 4 shows the conductivities for both crystal orientations in a double-logarithmic plot together with a straight line which demonstrates that in the range 120 KT250 K the scattering is dominated by acoustic phonons.
Below 120 K the Hall-coefficient of the RuIn3 single crystals is negative and increases with decreasing temperature. In this temperature range the conductivity diminishes caused by the freezout of the extrinsic electrons and holes. Due to the different binding energies of the extrinsic carriers and the temperature dependence of the corresponding mobilities the temperature dependence of is rather complex. In a two band model with electrons and holes the Hall-coefficient is given by
| (1) |
with the concentrations and the mobilities of the holes and the electrons. From the measured conductivity and the Hall-coefficient the product
| (2) |
can be obtained, which temperature dependence is easier to interpret. In Fig. 5 the product is given as a function of temperature. At low temperatures (T20 K) the value of is very small since most of the carriers are frozen at their impurity sites. steeply increases above 50 K reaching a maximum at about 90 K. Since the sign of is negative the increase is caused by the thermal activation of electrons from donors with a small activation energy .
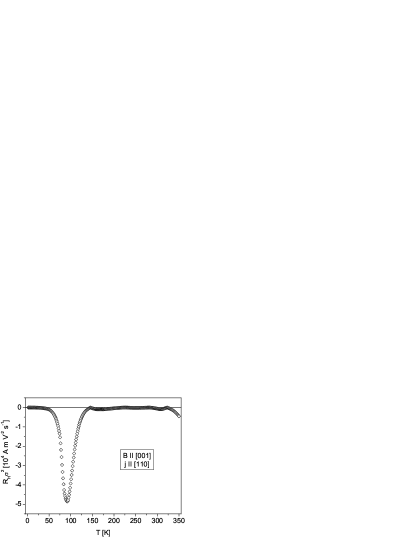
Above 90 K decreases strongly reaching =0 at about 150 K. The decrease of in the range 90 KT150 K will be produced by the thermal activation of holes from acceptors with a larger activation energy . It should be noted that is comparably small in the whole temperature range 150 KT300 K. This could be a hint to the fact, that both kinds of carriers originate from the same type of structural defects. The activation energies and can be obtained from the plot of vs. inverse temperature in the temperature range 5 KT50 K , which is given in Fig. 6.
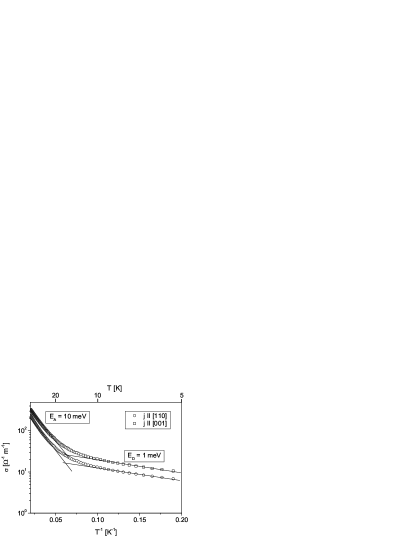
Typical values obtained for the activation energies on different single crystals are =1.0-1.5 meV for the donors and =10meV for the acceptors. In the temperature range K the quantity becomes negative again. In this regime intrinsic conductivity dominates and . From it follows , which in turn implies . The interpretation of this observation will be given in connection with band structure calculations.
The specific heat of RuIn3, measured on a single crystal with a mass of m25 mg is given in Fig. 7. shows the typical temperature dependence of a semiconductor or an insulator in the temperature range 2 KT300 K with a value of 100 J mol-1 K-1 at 300 K. The inset of Fig. 7 shows the low temperature data (2 KT4 K) in a C/T vs. T2 plot.
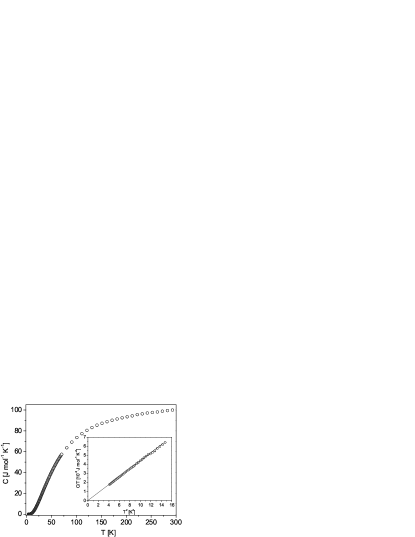
The extrapolation to T=0 K goes through the origin, and indicates that the contribution of the carriers is very small. This fact corroborates the semiconducting behaviour of our transport measurements. The value of the slope is A=4.510-4 J mol-1 K-4. From this result the Debye-temperature = of RuIn3 can be calculated to =258 K.
IV band structure calculation
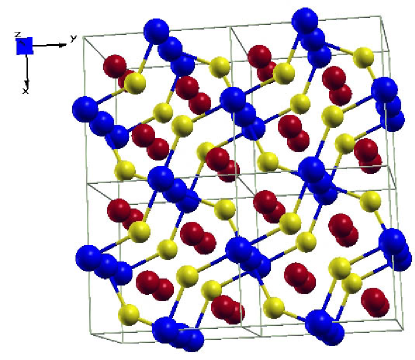
State-of-the-art electronic structure calculations from first principles are based on density functional theory (DFT) within the local density approximation (LDA). To calculate the electronic structure of RuIn3, the TB-LMTO-ASA package v.47 (Tight Binding, Linear Muffin-Tin Orbitals, Atomic Sphere Approximation) Andersen was used with experimentally obtained values of the lattice constants ( Å, Å, tetragonal space group P42/mnm 136 Poettgen ). The Ru sites occupy 4f Wyckoff positions (, , ) and there exist two crystallographically inequivalent In sites at positions 4c for In1 (, , ) and 8j for In2 (, , ). The crystal structure is presented in Fig. 8.
Atomic spheres radii were chosen to be R(Ru)=2.88 a.u., R(In1)=2.92 a.u. and R(In2)=2.97 a.u.. The orbital basis consists of 5s, 5p, 4d muffin-tin orbitals for Ru and 5s, 5p for In1 and In2 sites. To fill the space of the unit cell several empty (without nuclei charge) atomic spheres were introduced. The calculations were performed with 405 irreducible k-points (161616 spacing) in the first Brillouin zone.
In Fig. 9 we present the densities of states (DOS) obtained within the LMTO method. The upper panel displays the total DOS with an energy gap of 0.41 eV. The individual contributions of Ru 5s, 5p and 4d states and the 5s, 5p states of both In sites to the total DOS are shown in the middle and lower panels of Fig. 9, respectively.
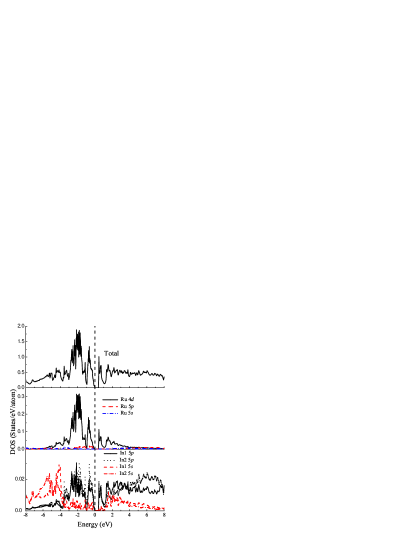
By comparing the total and partial DOS, one can identify several evident features. The energy range below -4.5 eV is dominated by In1(2) 5s states. In the energy interval eV one observes that the 5p states of In1 and In2 hybridise relatively strongly with Ru 4d states. Finally, above 2 eV there are predominantly In 5p states (see lower panel, Fig. 9).
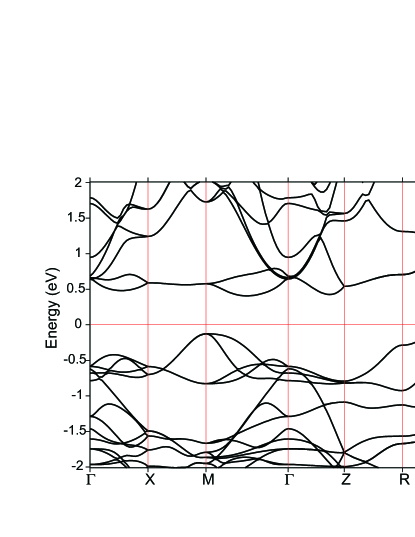
The observed anisotropy of transport properties with different resistivities along and directions is quite generally consistent with the simple tetragonal crystal structure of the compound. In order to qualitatively explain why the resistivity is larger than the one along we first note that the properties of hole transport will be determined by the top of the valence band located at k-point of the RA high symmetry direction (see Fig. 10), because the energy gap is much larger than the experimental temperature and there are no other bands below this one within the interval of energies corresponding to the experimental temperature.
From the LDA band structure analyses one can conclude that the orbitals contributing to the top of the valence band along the RA high symmetry direction in Fig. 10 can be separated into those lying in the XY plane and those along the Z-axis. The former are superpositions of In2 5px, 5py and Ru 4dxz, 4dyz orbitals,
the latter obtained from In1 5pz and again Ru 4dxz, 4dyz orbitals, and a small In2 5pz contribution seven . There is also an In1 5s contribution to the top of the valence band which is anisotropic. Contributions of other symmetries are negligible.
The strongest orbital overlap is obtained for nearest neighbours. In the XY-plane these nearest neighbours are In2-Ru and Ru-Ru, In1 sites do not have nearest neighbours in the XY-plane. Along the Z-axis nearest neighbours are Ru-In1 and In1-In2. Together with the previous classification of the orbitals contributing to the top of the valence band we can have In2-Ru hybridisation (In2 5pz and Ru 4dxz and 4dyz) and Ru-Ru hybridisation (Ru 4dxz-4dxz, Ru 4dyz-4dyz) Koster in the XY-plane. These two types of hybridisation are known to be quite weak Andersen78 . Along the Z-axis the possible hybridisation are Ru-In1 (Ru 4dxz,4dyz and In1 5s), In1-In2 (In1 5s and In2 5px,5py,5pz) and (In1 5pz and In2 5pz), which in principle are stronger Andersen78 than the ones found for the XY-plane, thus qualitatively explaining the better conductivity along the Z-axis.
A similar argumentation can be applied to the electron transport dominated at low temperatures by the bottom of the conduction band in the middle of the direction.
Since the angles between bonds are not ideal in RuIn3 (90∘ or 180∘), there will of course be other types of hybridisation. Furthermore, next nearest neighbour hoppings will contribute as well. All these effects will further reduce the anisotropy and lead to three dimensional behaviour despite the layered structure of RuIn3. Given all these partially compensating effects a final quantitative answer on the size of the anisotropy thus surely requires more detailed numerical investigations.
The band structure of RuIn given in Fig. 10 shows a maximum of the valence band along in the Brillouin zone near . The calculated effective hole mass is . The minimum of the conduction band is formed by a flat band along with a large effective electron mass . Therefore in the intrinsic regime the quantity should be positive in contrast to the observed high temperature behaviour in Fig. 5. However, the band structure shows a second minimum of the conduction band along near with a substantial smaller effective mass of . The energy difference between the two conduction band minima is only meV, which is smaller as the thermal energy at K. Hence, the small effective electron mass of the conduction band minimum near with the implication is responsible for the negative sign of observed by the experiments in the intrinsic range.
V Summary
Measurements of the resistivity and of the Hall-coefficient of RuIn3 single crystals identify this compound as a semiconductor with a gap energy of -eV, in contrast to previously published results, which report on metallic conductivity. The calculated band structure based on the density functional theory gives a similar value of eV.
The experimentally observed slight anisotropy of the resistivity can qualitatively be explained by a theoretical symmetry analyses which predict a better conductivity along the -axis of the tetragonal compound. The negative sign of the Hall-coefficient in the intrinsic region can also be explained by the calculated conduction band structure with two energetically nearly equivalent minima but with very different effective electron masses.
In the extrinsic range at low temperatures a small activation energy for electrons from donors of -meV and a larger activation energy for holes from acceptors of meV were determined from the transport measurements. Both kinds of extrinsic carriers seems to originate from the same type of structural defects, since is nearly zero in a large temperature range KK. The low temperature data of the specific heat show a negligible contribution of charge carriers and corroborate the semiconducting nature of RuIn3.
Acknowledgements.
IN thanks A. Postnikov for many helpful discussions. This work was supported in part by RFBR grants 05-02-16301 (IN), 05-02-17244 (IN), 06-02-90537 (IN), by the joint UrO-SO project (IN), and programs of the Presidium of the Russian Academy of Sciences (RAS) ”Quantum macrophysics” and of the Division of Physical Sciences of the RAS ”Strongly correlated electrons in semiconductors, metals, superconductors and magnetic materials” and the by the DFG through the collaborative research grant SFB 602 (TP,IN). I.N. acknowledges support from the Dynasty Foundation and International Center for Fundamental Physics in Moscow program for young scientists and also from the grant of President of Russian Federation for young PhD MK-2242.2007.02, and thanks the Faculty of Physics of the Georg-August University of Göttingen for its hospitality.References
- (1) R.B. Roof, Z. Fisk, and D.L. Smith, Powder Diffraction 1, 20 (1986).
- (2) R. Pöttgen, J. Alloys and Compounds 226, 59 (1995).
- (3) U. Häussermann, M. Boström, P. Viklund, Ö. Rapp, and T. Björnängen, J. Solid State Chemistry 165, 94 (2992).
- (4) see for instance: P.C. Canfield, and Z. Fisk, Phil. Mag. B 70, 1117 (1992) and references therein.
- (5) H.C. Montgomery, J. Appl. Phys. 42, 2971 (1971).
- (6) O.K. Andersen, O. Jepsen, and D. Glötzel, in Highlights of Condensed-Matter Theory, edited by F. Bassani, F. Fumi, and M.P. Tosi (North-Holland, New York, 1985); O.K. Andersen and O. Jepsen Phys. Rev. Lett. 53, 2571 (1984).
- (7) Since RuIn3 cristallizes in a tetragonal structure without distortions, there is no need to introduce a local coordinate system for each particular atom to properly resolve the orbitals with respect to their magnetic quantum number.
- (8) J. C. Slater and G. F. Koster, Phys. Rev. 94, 1498 (1954).
- (9) O. K. Andersen, W. Klose and H. Nohl, Phys. Rev. B 17, 1209 (1978).