Spatial Coherence of a Polariton Condensate
Abstract
We perform a Young’s double-slit experiment to study the spatial coherence properties of a two-dimensional dynamic condensate of semiconductor microcavity polaritons. The coherence length of the system is measured as a function of the pump rate, which confirms a spontaneous build-up of macroscopic coherence in the condensed phase. An independent measurement reveals that the position and momentum uncertainty product of the condensate is close to the Heisenberg limit. An experimental realization of such a minimum uncertainty wavepacket of the polariton condensate opens a door to coherent matter-wave phenomena such as Josephson oscillation, superfluidity, and solitons in solid state condensate systems.
Simple, yet profoundly connected to the foundation of quantum physics, the Young’s double-slit experiment has been a benchmark demonstration of macroscopic spatial coherence – off-diagonal long range order (ODLRO) of a macroscopic number of particles Penrose and Onsager (1956) – in Bose-Einstein Condensation (BEC) of cold atoms Andrews et al. (1997); Bloch et al. (2000); Hadzibabic et al. (2006). Recently, a similar phase transition has been reported for the lower branch of exciton-polaritons (LPs) in planar semiconductor microcavities Dang et al. (1998); Senellart and Bloch (1999); Huang et al. (2002); Deng et al. (2002, 2003); Richard et al. (2005); Kasprzak et al. (2006); Deng et al. (2006), and supporting theoretical frameworks have been developed Littlewood et al. (2004); Keeling et al. (2007); Malpuech et al. (2003); Kavokin et al. (2004); Cao et al. (2004); Doan et al. (2005); Sarchi and Savona (2006); Baas et al. (2006). Interestingly, LPs are free particles in a two dimensional (2D) system where genuine BEC exists only at zero temperature in the thermodynamic limit Mermin and Wagner (1966); Hohenberg (1967). A quasi-BEC can be defined for a 2D system of a finite size if a macroscopic number of particles occupy a single ground state and if an ODLRO is established throughout the system Bagnato and Kleppner (1991); Lauwers et al. (2003). Yet in the LP experiments to date, the system size is ambiguously defined by the spot size of the pump laser, and there is no quantitative study of the relation between the size and the coherence length of a condensate Richard et al. (2005); Kasprzak et al. (2006). In this work, we perform a Young’s double slit experiment on a LP gas to measure its spatial coherence properties across the phase transition, and compare the measured coherence length with the condensate size. We also measure the position-momentum uncertainty product of the condensate and compare it to the Heisenberg limit.
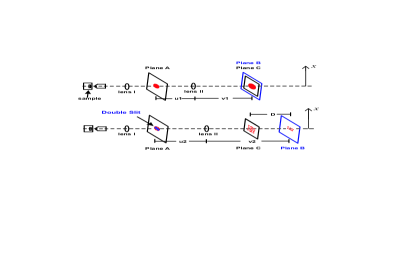
A sketch of the setup is shown in Fig. 1. The microcavity sample is first magnified by a factor of 37.5 and imaged to a plane A, which is in turn imaged by a lens II to a charge-coupled-device (CCD) at plane C for measurement of spatial distribution. For the double-slit experiment, we insert a pair of rectangular slits at plane A, and move the lens II such that the image of plane A (denoted by plane B) is a distance behind plane C. Effectively, we observe on the CCD the interference pattern of the LP emission passing through the double-slit. In our experiment, cm, the width of the slit image at plane B is m, and the average wavelength of the LP emission is nm. Correspondingly, the Fresnel number , thus the far-field condition is satisfied at plane C. When mapped onto the sample surface, the slit width seen by the LPs is m, which is less than the intrinsic coherence length m of a single LP not (a), and much less than the LP system size of m. Hence neglecting the variation in LP distribution within each slit, we obtain the intensity distribution on the CCD camera Borns and Wolf (1997):
| (1) |
The subscript denotes the slit number. are the x-coordinates of the slits on plane B (Fig. 1), is the x-coordinate on plane C, is the center of the double-slit on plane C, is the LP field amplitude at slit , is the free space average wavenumber of the LP emission, and is the separation between the images of the two slits at plane B. is the intensity distribution if only slit is open. is a fixed phase difference of LPs between the two slits. is a varying phase close to the path length difference from the two slits, giving rise to a cosine modulation on the far-field intensity distribution. After proper normalization, the amplitude of the cosine modulation equals the first order coherence function . Using six sets of double-slit with varying slit separations , we measured from m, close to the intrinsic coherence length of a single LP, up to m, close to the LP system size. By varying the pumping intensity, we studied the characteristics of across the phase transition.
The sample we investigated has a GaAs cavity sandwiched between Ga0.865Al0.135As/AlAs distributed Bragg reflectors. Three stacks of quantum wells (QWs) are placed at the central three antinodes of the microcavity, each stack consisting of four 6.8 nm-wide GaAs QWs separated by 2.7 nm-wide AlAs barriers. We pump the sample with linearly polarized pico-second mode-locked Ti-Sapphire laser. At an incidence angle of from the sample growth direction, the laser is resonant with the exciton-like LP modes. The sample is kept at K. The cavity-photon energy at zero in-plane wavenumber is meV above the bare QW exciton resonance, corresponding to an optimal detuning for thermal-equilibrium condensation of the LPs Deng et al. (2006). The threshold pumping density is W/cm2 not (b).
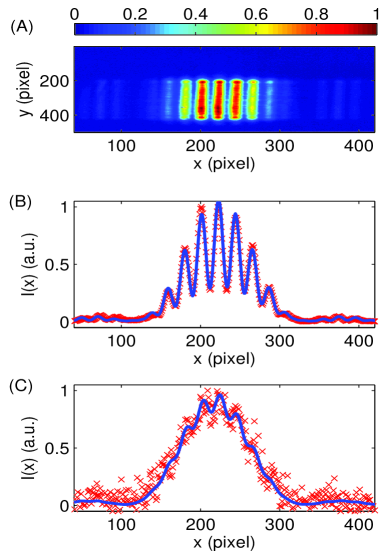
A typical interference pattern observed at a pump rate above the condensation threshold is shown in Fig. 2A. Distinct interference fringes are readily observed imposed on a sinc function distribution. To obtain , we integrate over a narrow strip along the y-axis and fit it with Eq. 1. , , and are free fitting parameters, while , , and are estimated from experimental parameters with a 10 allowed variation. As shown in Fig. 2B, Eq. 1 fits the data very well for . At , the interference patterns are barely observable or non-existing; one example is given in Fig. 2C.
In Fig. 3A we show the increase of with for a few slit separations . A salient feature in Fig. 3A is that, there is a jump in when the pump rate is increased above a condensation threshold, even at up to the laser pump spot size of m. When the pump spot size is increased to m, was also observed up to m, limited again by the pump spot size Lai . This demonstrates the sudden appearance of macroscopic coherence above the condensation threshold. Another feature is that, the increase of with is slower at larger . This shows that the macroscopic coherence is built up gradually throughout the pump beam spot size when the phase space density of LPs is increased.
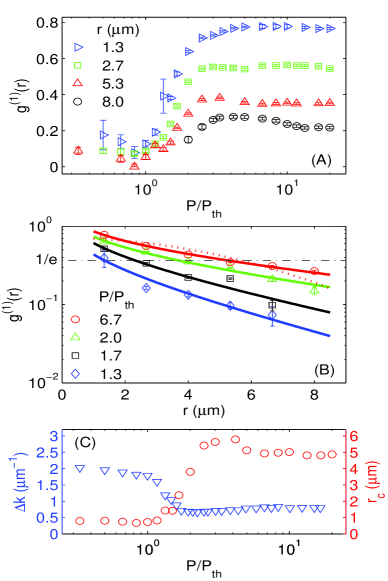
To study the spatial coherence properties quantitatively, we plot in Fig. 3B how decays with , and define a coherence length as . The normalized pump power dependence of is shown in Fig. 3C. As a reference, for a classical Maxwell-Boltzmann (MB) gas in thermal equilibrium:
| (2) |
Here is the thermal de Broglie wavelength, is the mass of the particles and is temperature. For the current system at K, m.
Below condensation threshold density, we measured a , since the system is far from thermal equilibrium. In fact, the finite at m is consistent with the intrinsic coherence length m of a single LP due to its finite lifetime not (a): . Above condensation threshold, we found . Fitting of the data with Eq. 2 with temperature as a free parameter also fails to describe the data (dashed lines in Fig. 3B).
Since is the Fourier transform of the momentum distribution , we resort to the actual momentum distribution of the system. It was found that above the condensation threshold, the LPs become highly degenerate in the states with the lowest kinetic energies (e.g., Fig. 2 in Ref. Deng et al. (2006)). Their momentum distribution deviates from the MB distribution, but follows well the Bose-Einstein (BE) distribution with chemical potential . In this quantum degenerate limit, , most of the emission comes from LPs with . Hence we can obtain the following approximate form of :
| (3) | |||||
Here is the LP’s in-plane wavenumber, is the constant momentum density of state, and denote the 2D Fourier and Hankel transform of , respectively. As shown in Fig. 3B (solid lines), , the modified Bessel function of the first kind, fits very well the measured for .
If we extrapolate the decay length of from the fitting and compare it to at 4 K, it is at , and at .
In Fig. 3C, we compare the pump rate dependence of and , the width of the measured first-order coherence function and the measured momentum distribution function , respectively. At pump rates lower than the condensation threshold, is m, limited by the intrinsic coherence length of a single LP, while is m-1 due to the slow energy relaxation dynamics of the LPs. The product is close to 2, the value expected for a thermal MB distribution. When increases toward , more injected LPs relax to the lower energy states and gradually narrows, but is still limited by , hence a decrease in . Once above the threshold, there is a sudden increase of by more than five fold up to m, which manifests the spontaneous build-up of a global phase among the LPs due to the phase coherent stimulated scattering of LPs into the ground state. Correspondingly, is reduced by about four fold since the LPs form a quantum degenerate Bose gas. Further increasing the pump rates, decrease slightly while the momentum distribution is broadened, potentially because stronger LP-LP scattering at high densities introduces condensate dephasing Sarchi and Savona (2006).
Finally, it is instructive to compare with the measured condensate size Deng et al. (2003). We have consistently observed an abnormally slow increase of the condensate size in comparison to the spot size of a photon laser based on electron-hole pairs (Fig. 6C in Ref. Deng et al. (2003)).
Due to the discrete jump in quantum efficiency at the condensation threshold (Fig. 1 in Ref. Deng et al. (2003)), the emission in a condensate region is much brighter. Since the pump beam has a Gaussian spatial profile, the center of the spot reaches a threshold first, leading to a sharp decrease of the emission spot size at , for both a LP condensation and a photon laser. At , the emission spot size measures the area which reaches the threshold. In a photon laser, threshold density is determined by the local density of electron-hole pairs independent of the system size. Hence the spot size can be estimated as:
| (4) |
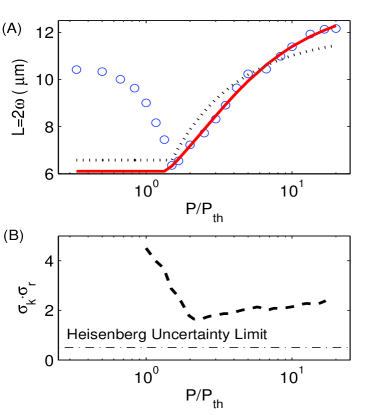
where is the pump spot size. Eq. 4 describes very well the photon laser data (Fig. 6C in Ref. Deng et al. (2003)), but fails to explain the data of a LP condensate (Ref. Deng et al. (2003) and Fig. 4A). Here we propose that for a LP condensate, reflects the size of the condensate in which a condensation threshold is satisfied. Then the critical LP density increases with the system size , and the pumping rate needs to be modified as , where is the condensate size at . As a simplified model, consider for a 2D boson gas confined in a finite size Ketterle and van Druten (1996): , then we obtain:
| (5) |
Eq. 5 fits the data very well (solid line in Fig. 4A), with and as fitting parameters. This suggests that measures the size of the coherent condensate above threshold.
With the distribution functions in both spatial and momentum domains, we can evaluate how well the system can be described by a single-particle wavefunction. The standard deviation and are calculated from the momentum and spatial distribution data and at , respectively; their product is compared to the Heisenberg minimum uncertainty limit in Fig. 4B. The sharp decrease of at indicates that a large number of the LPs in the system condense into a single quantum state. Deviation from the Heisenberg limit shows that there are some thermal LPs coexisting with the coherent condensate. The slight increase of at may be caused by condensate depletion due to LP-LP interactions at high densities Sarchi and Savona (2006); Orzel et al. (2001).
In conclusion, we studied the spatial coherence of a microcavity polariton condensate. A Young’s double-slit setup is implemented to measure the first order coherence function of the LPs. The system acquires macroscopic coherence above a condensation threshold, manifested as a sudden jump of . The observed vs. is well described by the Fourier transform of a degenerate Bose-Einstein distribution in the momentum space. The coherent condensate expands from the central region of the pump spot to the full pump spot size, and a slow growth of the condensate size is well understood by a simple model of quasi-BEC with a finite size. We also confirm the position and momentum uncertainty product of the LPs decreases toward the Heisenberg uncertainty limit above a condensation threshold.
Acknowledgements.
The authors thank C.W. Lai and N.Y. Kim for useful comments, and acknowledge support by the Quantum Entanglement Project, SORST, JST and Special Coordination Funds for Promoting Science and Technology.References
- Penrose and Onsager (1956) O. Penrose and L. Onsager, Phys. Rev. 104, 576 (1956).
- Andrews et al. (1997) M. R. Andrews, et al., Science 275, 637 (1997).
- Bloch et al. (2000) I. Bloch, T. W. Hänsch and T. Esslinger, Nature 403, 166 (2000).
- Hadzibabic et al. (2006) Z. Hadzibabic, et al., Nature 441, 1118 (2006).
- Dang et al. (1998) L. S. Dang, et al., Phys. Rev. Lett. 81, 3920 (1998).
- Senellart and Bloch (1999) P. Senellart and J. Bloch, Phys. Rev. Lett. 82, 1233 (1999).
- Huang et al. (2002) R. Huang, et al., Phys. Rev. B. 65, 165314 (2002).
- Deng et al. (2002) H. Deng, et al., Science 298, 199 (2002).
- Deng et al. (2003) H. Deng, et al., Proc. Natl. Acad. Sci. 100, 15318 (2003).
- Richard et al. (2005) M. Richard, et al., Phys. Rev. Lett. 94, 187401 (2005).
- Kasprzak et al. (2006) J. Kasprzak, et al., Nature 443, 409 (2006).
- Deng et al. (2006) H. Deng, et al., Phys. Rev. Lett. 97, 146402 (2006).
- Littlewood et al. (2004) P. Littlewood, et al., J. Phys.: Cond. Matt. 16, S3597 (2004), and refereces therein.
- Keeling et al. (2007) J. Keeling, et al., Semicond. Sci. Technol. 22, R1 (2007).
- Malpuech et al. (2003) G. Malpuech, et al., Semicond. Sci. Technol. 18, S395 (2003).
- Kavokin et al. (2004) K. Kavokin, et al., Phys. Rev. Lett. 92, 017401 (2004).
- Cao et al. (2004) H. T. Cao, et al., Phy. Rev. B 69, 245325 (2004).
- Doan et al. (2005) T. D. Doan, et al., Phys. Rev. B. 72, 85301 (2005).
- Sarchi and Savona (2006) D. Sarchi and V. Savona Phys. Rev. B. 75, 115326 (2007).
- Baas et al. (2006) A. Baas, et al., Phys. Rev. Lett. 96, 176401 (2006).
- Mermin and Wagner (1966) N. D. Mermin and H. Wagner, Phys. Rev. Lett. 17, 1133 (1966), erratum: PRL, Vol. 17, No.26, 12/26/66.
- Hohenberg (1967) P. Hohenberg, Phys. Rev. 158, 383 (1967).
- Bagnato and Kleppner (1991) V. Bagnato and D. Kleppner, Phys. Rev. A. 44, 7439 (1991).
- Lauwers et al. (2003) J. Lauwers, A. Verbeure, and V. A. Zagrebnov, Journal of Physics, A 36, L169 (2003).
- not (a) of a single LP is defined by the Fourier transform of the LP’s far field radiation pattern and calculated by a transfer matrix method. A detailed procedure is given in G. Bjork et al., Phy. Rev. A 44, 669 (1991).
- Borns and Wolf (1997) M. Borns and E. Wolf, Principles of Optics (Cambridge Univ. Press, Cambridge, England, 1997).
- not (b) The operational threshold is defined at the steepest slope of the input-output curve for LPs at .
- (28) Chih-Wei Lai et.al., to be publisehd.
- Ketterle and van Druten (1996) W. Ketterle and N. J. van Druten, Phys. Rev. A 54, 656 (1996).
- Orzel et al. (2001) C. Orzel, et al., Science 291, 2386 (2001).