Effects of grains’ features in surface roughness scaling
Abstract
We study the local and global roughness scaling in growth models with grains at the film surfaces. The local roughness, measured as a function of window size , shows a crossover at a characteristic length , from a rapid increase with exponent to a slower increase with exponent . The result is explained by the large height differences in the borders of the grains when compared to intragrain roughness, and must not be interpreted as a consequence of a diffusion dominated intragrain dynamics. This exponent shows a weak dependence on the shape and size distribution of the grains, and typically ranges from for rounded grain surfaces to for the sharpest ones. The scaling corrections of exactly solvable models suggest the possibility of slightly smaller values due to other smoothing effects of the surface images. The crossover length provides a reasonable estimate of the average grain size in all model systems, including the cases of wide grain size distributions. In Kardar-Parisi-Zhang growth, very different values of are obtained, ranging from for the films with smoothest surfaces to values in the range for systems with large cliffs separating the grains. Possible applications to real systems which show this crossover with similar exponents are discussed.
pacs:
68.35.Ct, 68.55.Jk, 81.15.Aa, 05.40.-aI Introduction
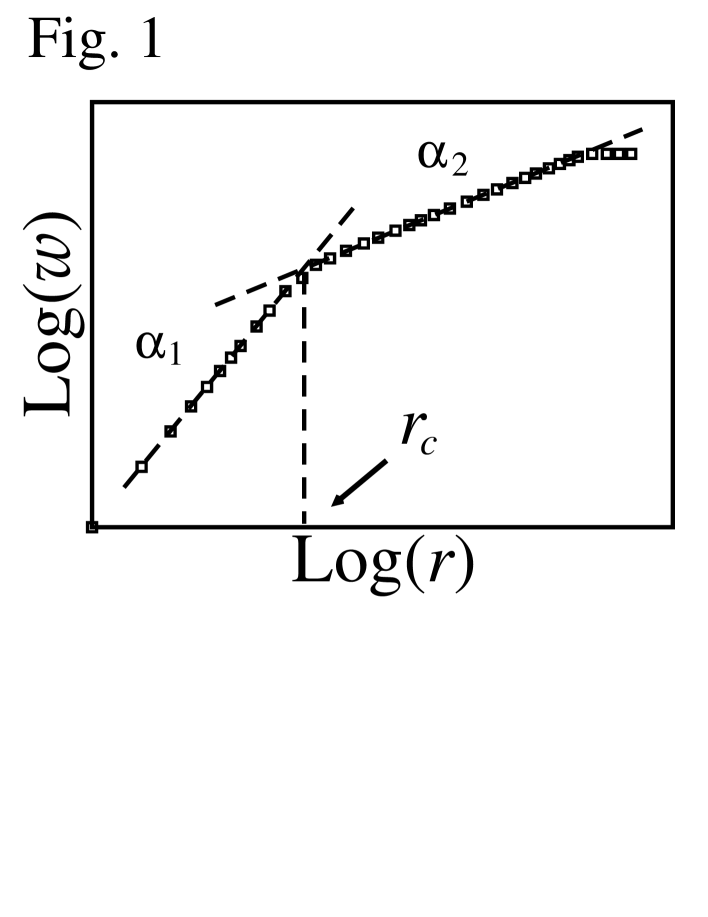
In the last twenty years, many works on thin film and multilayer growth analyzed the scaling properties of the local surface roughness (interface width) , which represents height fluctuations in different lengthscales, and of the global roughness , which represents the height fluctuations of the full system. Alternatively, some works considered height-height correlation functions, which exhibit the same scaling of the local roughness. In a certain growth process, the measured set of scaling exponents suggests its association with some universality class, consequently it is a useful tool to find the dominant growth mechanisms barabasi ; krug ; krim ; evansreview . However, simple scaling features famvic are observed only in a small number of real systems, as well as in a small number of growth models chamereis . Instead, a crossover in the roughness scaling is frequently observed as the window size or the time varies lita ; vasco ; kleinke ; ebothe ; vazquez ; marta ; tersio ; mendez ; otsuka ; hiane ; nara ; auger ; pehlivan . This crossover may be related to the presence of grains at the film surface lita ; vasco ; kleinke ; ebothe ; vazquez , with the typical size dependence of the local roughness illustrated in Fig. 1 ( is an average over windows of size gliding through a much larger surface). For small , one obtains with . For large , is obtained, with typically ranging from to (in electrodeposition works, is also frequent). When is of the order of the lateral correlation length, saturates at . The expected time evolution may also show a crossover, i.e. different values of may be found in different time regions.
It is usually suggested that the characteristic length of the first crossover in Fig. 1 is of the same order of the average grain size. Moreover, the usual interpretation for is that the small lengthscale features are related to a diffusion dominated, Wolf-Villain (WV) type growth barabasi ; wv . At longer lengthscales, the height fluctuations follow a different dynamics. When is obtained, it is usually associated with the Kardar-Parisi-Zhang (KPZ) growth kpz - see also Ref. kpz2d . The interpretation of smaller but nonzero values of is not so clear. However, when , the process is associated with the Edwards-Wilkinson (EW) class ew .
Despite the large number of works showing the roughness scaling of Fig. 1, it seems that no systematic analysis of these apparently universal features in surface growth models has been presented yet. As far as we know, this crossover was illustrated only with a very simple model of grain aggregation in Ref. vazquez , while a crossover in the exponent was discussed in Ref. albano . The aim of the present work is to fill this gap by studying statistical growth models with grains at the film surface, focusing on the effects of the shapes of the grains, their average size and their size distributions. Our first step is to show that the result is a consequence of the large height differences between neighboring grains when compared to the intragrain height fluctuations. Thus, this result is not related to the intragrain growth dynamics. Subsequently, the effects of the shape of the grains, of their average size and size distribution are addressed by more refined models of grain aggregation (the simplest ones inspired in the model of Ref. vazquez ). The qualitative behavior illustrated in Fig. 1 is obtained in all models, with , and is shown to be an accurate estimate of the average grain size. The effect of size distribution is relatively weak, but rounded grain surfaces may reduce to values near and rounded grain boundaries may play the same role. We also discuss other nontrivial features, such as the small effective exponents in some KPZ models, which may be relevant for some applications.
In all models presented here, the microscopic mechanisms of grain formation are not represented, but only the intergrain aggregation properties. We are implicitly assuming that the characteristic time in which a grain is formed is much smaller than the time interval between aggregation of two neighboring grains. Other models of polycrystalline growth albano ; huang ; rubio also adopt different stochastic rules to form the grains and to generate large scale correlations. Despite this limitation, such an approach is essential to analyze large three-dimensional deposits with reasonable computational effort. Also notice that our growth models are analyzed in the growth regime (, where is the large substrate length and is the growth exponent), which parallels the typical experimental conditions.
The rest of this work is organized as follows. In Sec. II we analyze simple, exactly solvable models with grains at the surface, which explains the result . In Sec. III we analyze the effects of the shape of the grains using models with grains of fixed size and constraints in the local height differences. In Sec. IV we present the models for deposition of grains with different size distributions and give evidence of their KPZ scaling in the continuous limit. The scaling of the local and global roughness of these models are studied in Sec. V, where we also discuss possible applications. In Sec. VI we summarize our results and present our conclusions.
II The origin of the crossover with
Here we consider simple but instructive models with grains regularly placed in infinitely large lattices, with the unit lattice parameter corresponding to the size of an image pixel. They have the advantage of being exactly solvable and of easy interpretation (a related model is used in Ref. chatraphorn for calculation of height-height correlations). For three-dimensional structures, the local roughness is the configurational average (angular brackets) of the root mean squared (rms) height fluctuation in square windows (overbars) of integer size which span the whole surface of the deposit. For two-dimensional structures, the one-dimensional windows are linear segments of size .
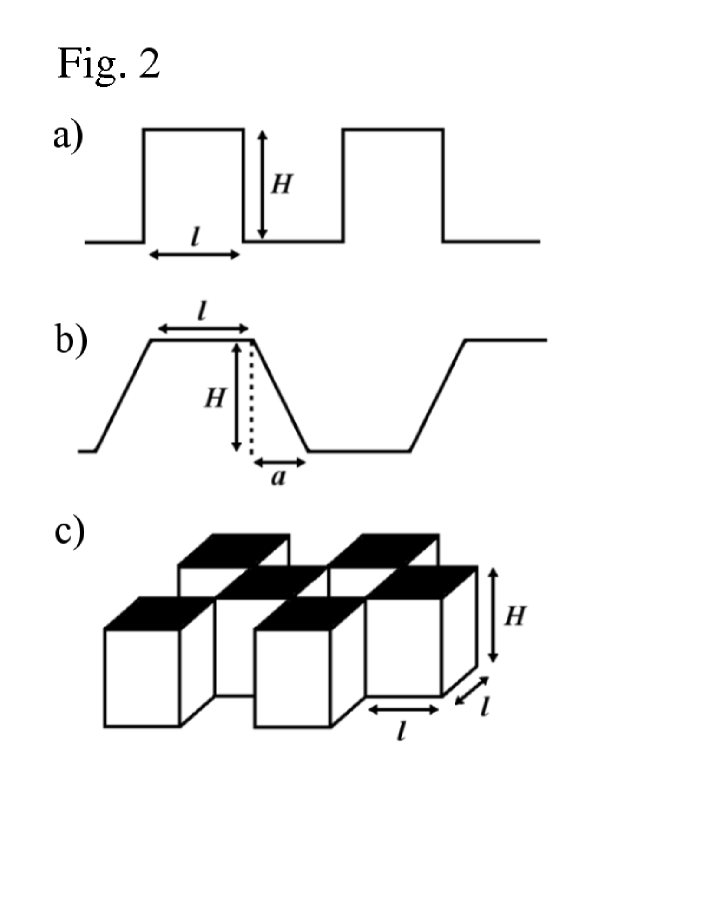
The first model is the square wave, shown in Fig. 2a, where the grains are rectangles of width and height . This structure contains the most important geometric feature of a deposit with grains at the surface: The height difference between bordering sites is much larger than the roughness of the surface of a grain (top of the grain). Due to the translation invariance, it is relevant to calculate the roughness only for . In the interesting limit , the sums over the possible window positions are turned into integrals and lead to
| (1) |
When the window size varies and and are kept fixed, we obtain , consequently . This linear dependence follows from the contribution of the windows that partly cover one grain (height ) and partly cover the substrate (zero height), since the fraction of windows with this property is , i.e. it is proportional to .
In order to show that this result is also valid in three-dimensional systems, we also calculated the local roughness in the structure shown in Fig. 2c: The grains are blocks of lateral size and height , which are formed by cubic units of size (the unit lattice parameter). We obtain
| (2) |
It also gives a dominant contribution as , thus . Again, this contribution comes from the windows that partly cover one grain (height ) and partly cover the substrate (zero height), whose number is proportional to .
Equation (2) shows that the deviation from the linear relation between and is determined by a factor near . Thus, even for , the deviations are below . Indeed, only small deviations from are found in the three-dimensional growth models presented in Secs. III-V.
However, there is a weakness in the above model systems: the images obtained from microscopy techniques usually do not show the steep surface features of Fig. 2a, even if they are present in the real surfaces. Instead, the surfaces usually look smoother in the final images. For this reason, we also analyzed the structure shown in Fig. 2b: within a region of size , with , the local height varies from the lowest to the highest value. This ”smoothened square wave” was also discretized in order to adopt the same scheme for the calculation of the roughness. Assuming and for converting the sums into integrals and expanding in powers of , we obtain after some algebra
| (3) |
It also shows a dominant term with , i.e. with . The correction term is proportional to , with negative coefficient of order . This correction is small even when , but the negative value suggests that the effective exponent may be slightly below one under these conditions. In real images, this result may be important for the smallest window sizes.
The above analysis shows that is a consequence of two simple facts: The contribution of the grain borders dominates the average roughness ( at those regions) and the fraction of windows with this property is proportional to . Consequently, this roughness exponent must not be associated with a particular intragrain growth dynamics.
At this point, it is important to recall that a diffusion dominated growth with negligible nonlinear effects also has roughness exponent in dimensions. This system is described by the linear molecular-beam epitaxy (MBE) equation (or Mullins-Herring equation) mullins ; herring ( is a constant) in the hydrodynamic limit. Certainly our results do not discard this possibility in a real system, but our conclusion is that simple dimension-independent geometric features are sufficient to explain for a system with grains at the surface, regardless of the intragrain dynamics.
A possible suggestion to identify the origin of this scaling exponent is to analyze the average squared roughness . It differs from only by the stage of the averaging process in which the square root of a height fluctuation is calculated, but both are expected to have the same scaling properties at long lengthscales. For the system of Fig. 2c, we obtain
| (4) |
A log-log plot of the rms roughness versus gives because the factor also appears in the expression of as a consequence of the configurational average. The main problem of studying this quantity is that is close to in several systems, such as KPZ ones, thus other corrections to scaling may hide the crossover.
III Effects of the shape of the grains on the local roughness
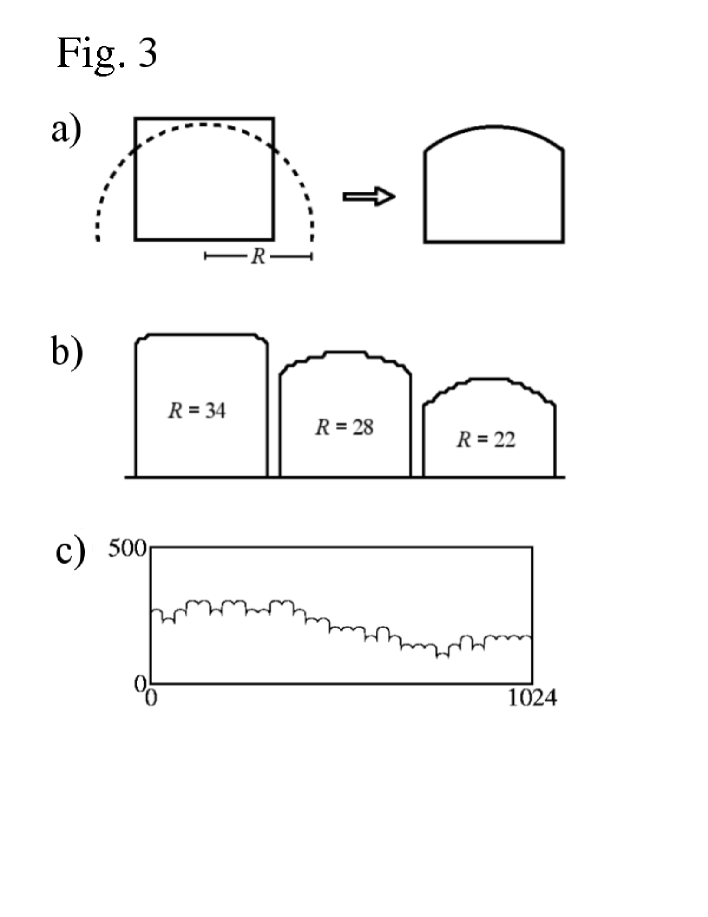
Now we consider the first set of three-dimensional models for thin film growth with the presence of grains at the surface. This type of model was formerly proposed in Ref. vazquez . The first step is to grow a deposit with cubic particles of unit size following the rules of some simple growth model. The first one is the restricted solid-on-solid (RSOS) model, in which the aggregation of the incident particle is accepted only if the heights differences of nearest neighbors are always or , otherwise the aggregation attempt is rejected kk . The second one is the Family model, in which the incident particle aggregates at the column with the smallest height among the incident column and its nearest neighbors family . In both cases, deposits with small local slopes are formed. After growing the film with one of these rules, the size of each particle is enlarged by a factor , i.e. each particle is transformed in a cubic grain of size . Finally, the upper parts of the grains at the surface of the film are polished with the shape of a sphere of radius , as shown in Fig. 3a. The cross section of the resulting grains for and several values of are shown in Fig. 3b. A cross-sectional view of the surface of a deposit grown with the RSOS model and is shown in Fig. 3c.
Square substrates of lateral length are considered for both models, with deposition times below (in units of number of deposition attempts per substrate site), which ensures that the systems are in the growth regime (). The lateral length of the final lattice with grains is .
In the hydrodynamic limit, the RSOS model is described by the KPZ equation, in which the local height evolves as ( and are constants and is a Gaussian noise). The Family model is described in that limit by the EW equation, which corresponds to the KPZ equation with .
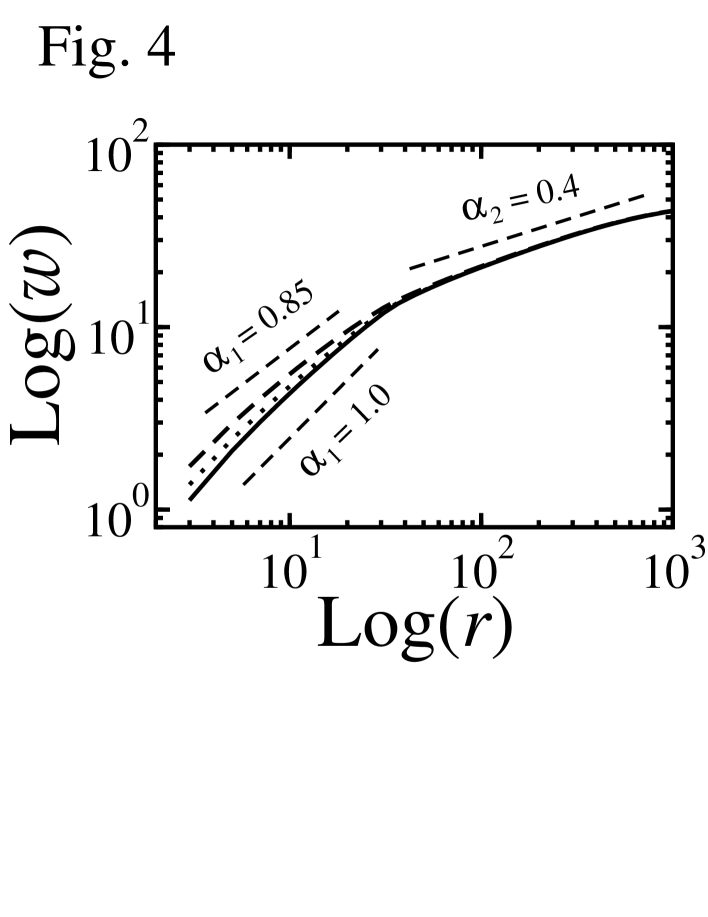
In Fig. 4 we plot the local roughness as a function of window radius for the RSOS model with and two values of , as well as the case with nonpolished, cubic grains (). Even with smooth grain surfaces and the constraint in the local slopes between the grains, the crossover in the local roughness scaling is present. Estimates of the crossover lengths are obtained from the intersections of linear fits in two scaling regions (see illustration of the method in Fig. 1). In all cases shown in Fig. 4, is very close to the grain size ; when is considered, the maximum difference between and is , and this difference tends to decrease for larger . The average slopes of the curves before the crossover () range from for the cubic grains to for the smoother grain surfaces (). After the crossover, we obtain for all shapes, which is in good agreement with the best currently known estimates for the KPZ class kpz2d . The same qualitative results were obtained with the Family model, but with after the crossover, which is hard to distinguish from the saturation at the global roughness .
Some experimental works presented values of and close to the above ones for the KPZ model lita ; kleinke ; marta ; nara , while slightly larger values of were obtained in electrodeposition works of Refs. vazquez ; otsuka ; hiane . Our results confirm the interpretation of asymptotic KPZ scaling in the cases where was obtained. The formation of grains or other surface structures separated by cliffs are responsible for the crossover. However, one important conclusion of the above analysis is that their average sizes may be estimated with reasonable accuracy from the crossover lengths calculated with the procedure shown in Fig. 1, independently of the shape of the grains. This is reinforced by results for other models in Sec. V. Finally, the above results show that the conclusion of Sec. II can be extended to surfaces with large lengthscale fluctuations: is related to simple geometric features and not to the intragrain dynamics. Thus, in a particular application, this dynamics remains to be clarified by specific models accounting for the interactions between individual atoms or molecules.
IV Models of grain aggregation and their universality class
Now we introduce a more realistic model for grain aggregation, which, in contrast to the model of Sec. III, represents deposition of grains of different sizes and disorder in their aggregation positions. This section is devoted to the presentation of the model and the study of its universality class. The discussion of local and global roughness scaling, as well as possible applications, is done in Sec. V.
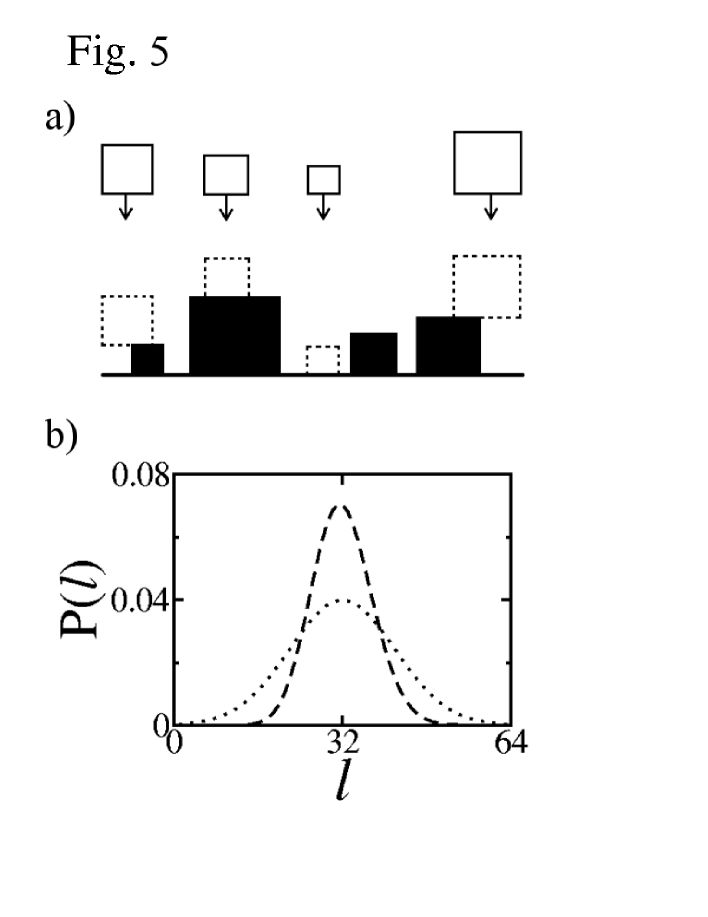
The model is defined in a simple cubic lattice where the length unit is the lattice parameter. The grains have cubic shapes and the lateral size of each one is chosen from a certain distribution. They sequentially incide perpendicularly to an initially flat substrate, with two of their faces parallel to the substrate. The incident grain permanently aggregates to the deposit when its bottom touches a previously aggregated grain (thus, there is no lateral aggregation). The process is illustrated in Fig. 5a. Three grain size distributions are considered here: Delta distribution (fixed grain size), Poisson distribution with average size , and Gaussian distribution with average size and width . The Poisson and Gaussian distributions with are illustrated in Fig. 5b. In most simulations in the growth regime (small depositon times), substrate sizes will be considered. The time unit is chosen to correspond to the deposition time of one monolayer of individual atoms, i.e. atoms.
Similarly to the previous models, this one does not account for the details of the grain formation, but assumes that it takes place in a relatively small time interval, in which the atoms arriving in a region of size diffuse in this neighborhood until finding a final position of aggregation. On the other hand, this model leads to the formation of a porous deposit which resembles those produced with Tetris model for compaction of granular media tetris or ballistic deposits vold . However, we are only interested in surface features and, consequently, the main aspect to be considered here is the generation of intergrain correlations along the surface. For instance, notice that the aggregation of a new grain only depends on the current surface features and not on the bulk properties. The size distributions considered here are also not expected to be representative of real growth processes (see e. g. Refs. weaire ; castro ), but just designed to the investigation of qualitative effects.
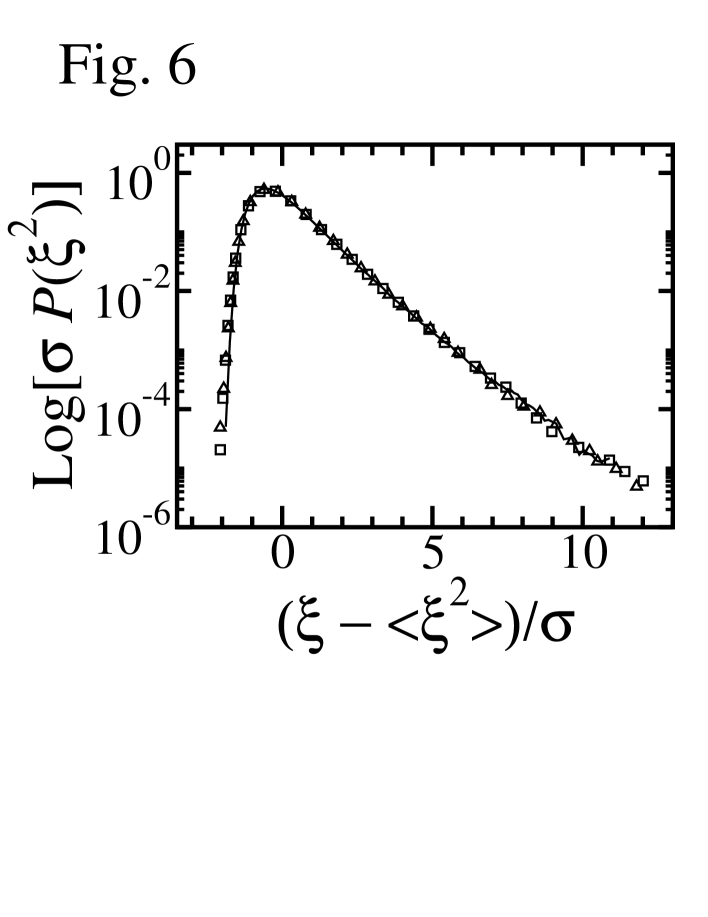
Due to the formation of pores in the deposit, it is natural to expect that this model is in the KPZ class for any grain size distributions. This is confirmed by the comparison of global roughness distributions at the steady states () with other KPZ models - see e. g. an application of the method for ballistic deposition in Ref. distrib . In Fig. 6 we show the steady state squared roughness distributions of the Poisson and the Gaussian models with and and the distribution for the original RSOS model with , which is the most accurate representative of the KPZ class in dimensions distrib . There, is the probability that the global square roughness is in the range , is the average squared roughness and is the rms deviation in each distribution. The good data collapse of the normalized distributions suggests that the grain models are also in the KPZ class. The estimates of their skewness and kurtosis provide additional support: , , and , which are very close to the values and obtained with the RSOS and other KPZ models distrib . Results for smaller confirmed this result with higher accuracy. Results for larger are not so accurate because it is difficult to attain steady states in lattices that are large enough to satisfy the condition (this is a necessary condition when we search for a continuous description of the discrete model).
V Effects of grain size and size distribution on local and global roughness
Here we analyze the global and local roughness scaling in the models presented in Sec. IV, focusing on the features of the growth regime, where correlation lengths along the surface are much smaller than the lateral system sizes.
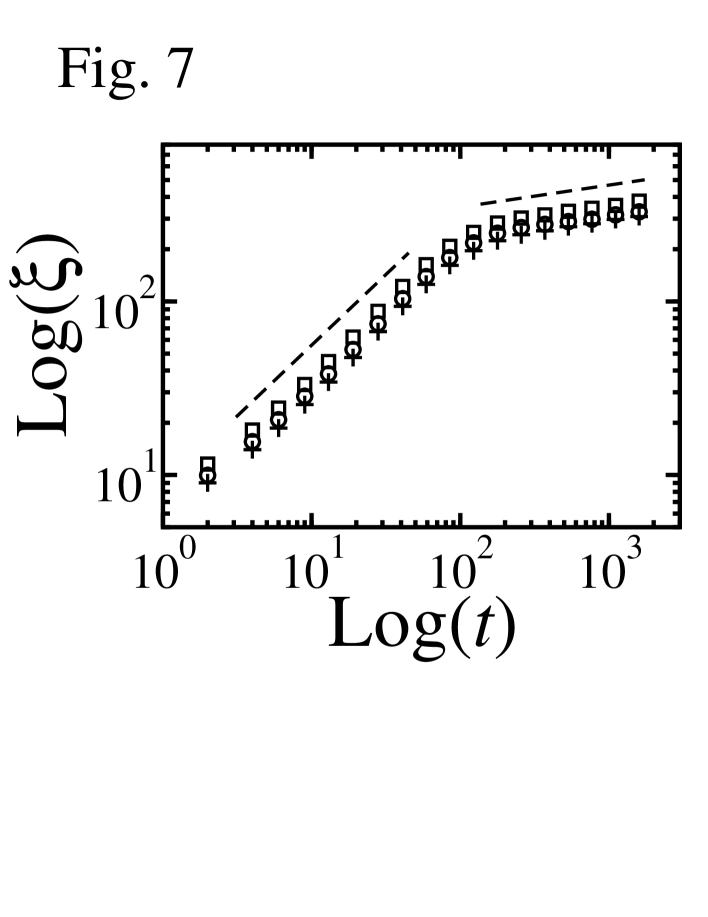
In Fig. 7 we show the time evolution of the global roughness for the models with Poisson, Gaussian and delta distributions with average grain size . There is no qualitative difference in these curves, but only a small shift to larger values of due to the presence of larger grains in the Gaussian case, followed by the Poissonian case (see Fig. 5b). Up to , there is a rapid increase of the roughness, approximately as . This roughly corresponds to five layers of grains. A growth exponent at small times is typical of a columnar growth, where some points of the substrate are exposed while the average height is linearly increasing in time. For longer times, is slowly increasing with exponent , which is much lower than the KPZ value kpz2d . No crossover to the asymptotic KPZ value is observed in our simulations up to , even for smaller values of .
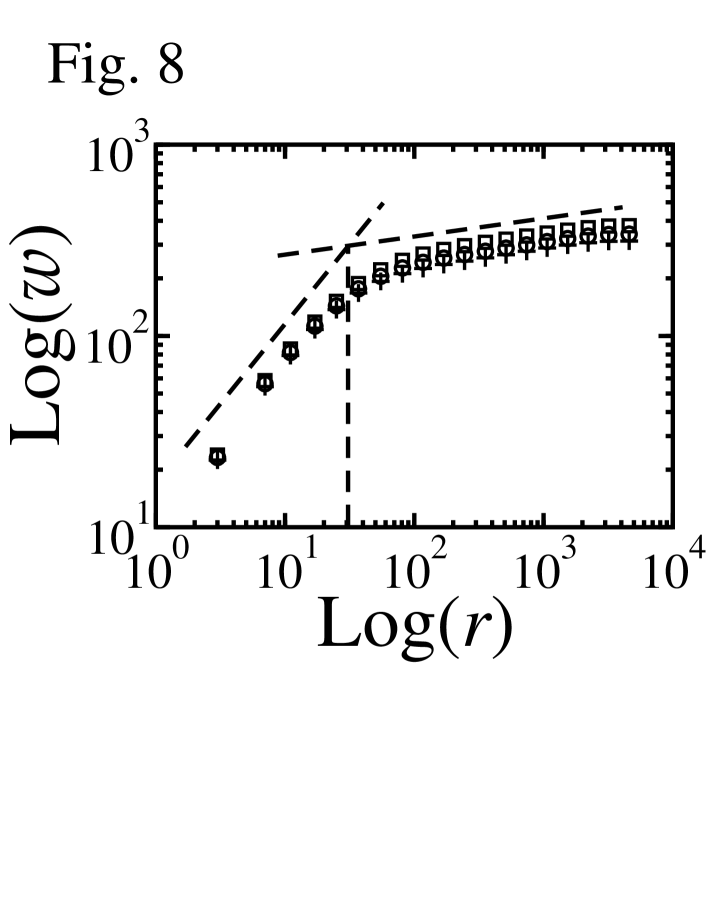
In Fig. 8 we show the local roughness as a function of the window size at for the same distributions of grain sizes. We do not identify long regions with a power-law growth of in that plot, but only approximate power laws for regions of small and large , as illustrated by the dashed lines of Fig. 8. For small , we obtain , independently of the average grain size and grain distribution, as expected from the sharp shape of the grains (see Secs. II and III). All estimates of are very close to ; for instance, in Fig. 8 we have and . This is confirmed by results for other grain size distributions. Moreover, slightly different choices of the regions for the linear fits (dashed lines in Figs. 1 or 8) do not give very different values of . These results confirm that the crossover length (obtained with the procedure illustrated in Fig. 1) is a reliable estimate of the average grain size, and not only an estimate of its order of magnitude.
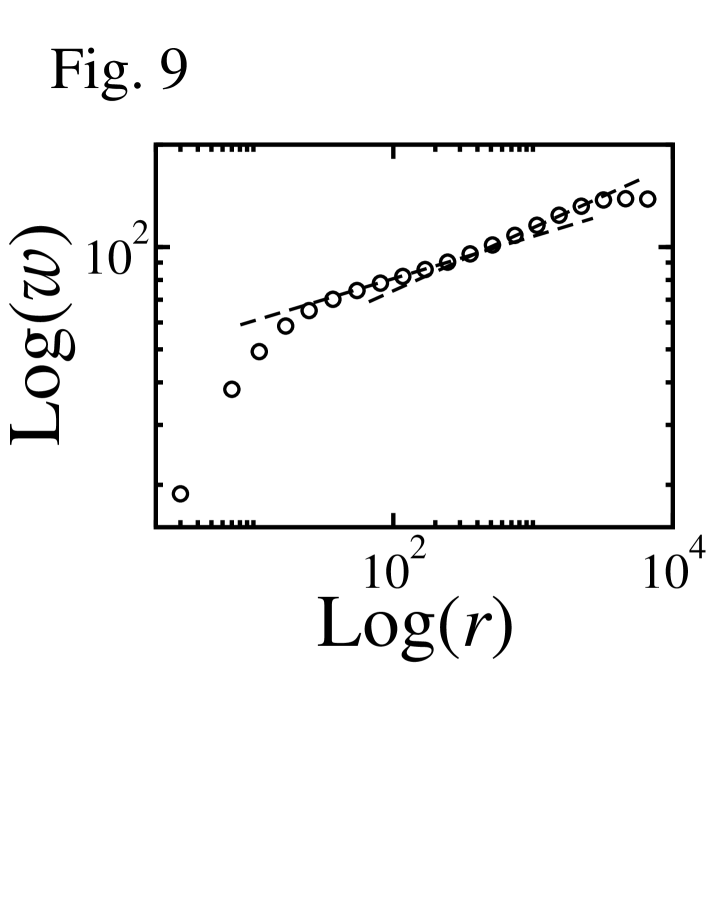
However, we obtain in Fig. 8, which is much lower than the KPZ exponent . Simulation for longer times and small shows that a slow increase of the slope of the plot takes place. This is illustrated in Fig. 9, where we plot the local roughness for (Poisson distribution) at time : after the crossover at , the local slope of the plot increases from to within two decades of . Thus we conclude that the exponents calculated from roughness scaling in these systems are not consistent with their true asymptotic class, which was shown to be KPZ in Sec. IV. Instead, the small values of may lead to a confusion with the logarithmic scaling () of linear EW growth, which would be an absolutely wrong interpretation of the growth dynamics.
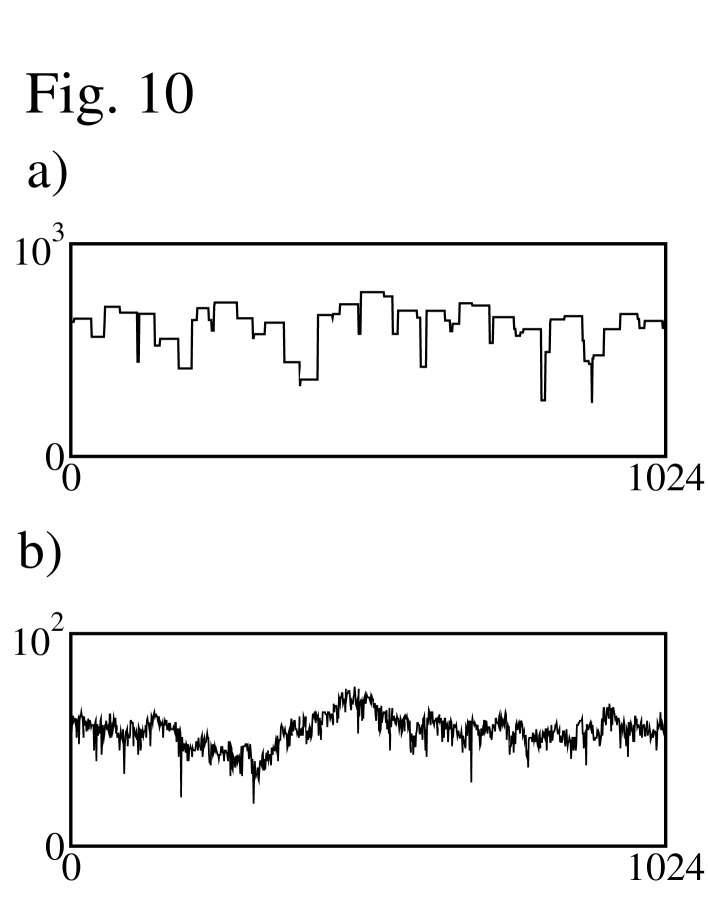
The inefficiency of local roughness scaling to show the true universality class of a growing system was already observed in several situations chamereis . In the present case, the explanation for the discrepancies seem to be the presence of large local slopes at the borders of the grains. In Figs. 10a and 10b, we show cross-sectional views of the surfaces of deposits grown with the grain deposition model and with the ballistic deposition model barabasi ; vold , which has similar surface features. They look much rougher than the surface of the KPZ model of Fig. 3c (based on RSOS growth) because the height differences were limited to the grain size in that system. On the other hand, we recall that the finite-size estimates of roughness exponents of ballistic deposits are also much smaller than the KPZ values eytan ; haselwandter ; balfdaar . This comparison reinforces the interpretation that the deviations of from the KPZ value in the grain deposition models are related to the large surface cliffs, whose depths are frequently much larger than the grain sizes (Fig. 10a).
Instead of being viewed as a limitation of our model, these deviations establish an interesting point for investigation because similar estimates of and are obtained in some real processes. Examples are films of deposited by spray pyrolysis ebothe . For low flow rates, the scaling of the local roughness gives , which suggests KPZ scaling. However, for high rates, two scaling regions of the local roughness are observed, with and . We believe that this result does not discard the possibility of KPZ scaling for high flow rates. Instead, the deviation from the KPZ value may be a consequence of the presence of grains and an intergrain KPZ dynamics leading to a surface geometry similar to the present model (although the details of the dynamics are probably very different there).
Our results also suggest a careful interpretation of estimates and . The latter is usually interpreted as a signature of EW scaling (logarithmic growth). However, it is reasonable to expect that small data fluctuations may give a power law with a small instead of a logarithmic growth, particularly when small scaling regions are considered. Some systems which present these exponents estimates are pulsed laser deposition of perovskites, in which they were obtained from power spectral density (PSD) scaling vasco , and cooper electrodeposition with additives mendez . In the latter, and were obtained in two scaling regions which are separated by an intermediate regime with intermediate slope in the plot. We believe that the investigation of a possible KPZ scaling to represent the long range correlations is justified in these and related systems.
VI Conclusion
We studied models of thin film growth with a focus on the effects of grain shape, average size and size distribution on the scaling of local and global roughness. They were simplified in order to avoid the complexities of the dynamics of grain formation and to allow the simulation of three-dimensional deposits with large system sizes. The local roughness shows a crossover from a rapid increase with the window size , for small , to a slower increase for larger , respectively with effective roughness exponents and . The result is explained by the large height differences in the borders of the grains and must not be interpreted as a consequence of a diffusion dominated intragrain dynamics, although the latter gives the same roughness exponent. The value of shows a weak dependence on the shape and size distribution of the grains, typically varying from for the smoothest grain surfaces to for the sharpest ones. The scaling corrections of exactly solvable models suggest that slightly smaller values may be obtained with pronounced rounding of the grain boundaries. The crossover length provides reasonable estimates of the average grain size even in the case of large size distributions. On the other hand, large ranges of values of are obtained in KPZ systems: when the height difference between the grains is limited, is near the KPZ value , but systems with large local slopes (typically with large cliffs separating the grains) show in the range .
The observed crossover from to is observed in several real growth processes, which is an evidence of KPZ scaling. However, much smaller values of are also found in some systems. Our results suggest that this may be an effect of the presence of grains with large height differences between them, while the long range correlations are still governed by the KPZ equation. Thus, we believe that this work motivates more realistic approaches to model growth processes with formation of grains. For each particular process, it may provide a better knowledge of the crossover in roughness scaling and the exponents involved there. They also motivate the analysis of other quantities for a more reliable test of the universality class of growing systems, such as height or roughness distributions distrib .
Finally, it is important to recall that the models presented here are not cases of anomalous lopez ; schwarzacher nor super rough scaling auger , in which the global roughness exponents are very large (). Indeed, KPZ or EW systems do not show anomalous scaling lopez . Again, we stress the conclusion that the explanation to the crossover observed in deposits with grain’s features is much simpler, since it is related to the configurational average in the calculation of the local roughness.
Acknowledgements.
TJO acknowledges support from CAPES and FDAAR acknowledges support from CNPq and FAPERJ (Brazilian agencies). FDAAR thanks Prof. M. U. Kleinke and Prof. R. Priolli for helpful discussion.References
- (1) A. L. Barabási and H. E. Stanley, Fractal concepts in surface growth (Cambridge University Press, Cambribge, England, 1995).
- (2) J. Krug, Adv. Phys. 46, 139 (1997).
- (3) J. Krim and G. Palasantzas, Int. J. Mod. Phys. B 9, 599 (1995).
- (4) J. W. Evans, P. A. Thiel, and M. C. Bartelt, Surf. Sci. Rep. 61, 1 (2006).
- (5) F. Family and T. Vicsek, J. Phys. A 18 L75 (1985).
- (6) A. Chame and F. D. A. Aarão Reis, Surf. Sci. 553, 145 (2004).
- (7) E. Vasco, C. Polop, and C. Ocal, Eur. Phys. J. B 35, 49 (2003).
- (8) J. Ebothé, A. El Hichou, P. Vautrot, and M. Addou, J. Appl. Phys. 93, 632 (2003).
- (9) L. Vázquez, R. C. Salvarezza, P. Herrasti, P. Ocón, J. M. Vara, and A. J. Arvia, Phys. Rev. B 52, 2032 (1995); Surf. Sci. 345, 17 (1996).
- (10) M. U. Kleinke, J. Davalos, C. Polo da Fonseca, and A. Gorenstein, Appl. Phys. Lett. 74, 1683 (1999).
- (11) A. E. Lita and J. E. Sanchez, Jr., Phys. Rev. B 61, 7692 (2000).
- (12) T. G. S. Cruz, M. U. Kleinke, and A. Gorenstein, Appl. Phys. Lett. 81, 4992 (2002).
- (13) M. E. R. Dotto and M. U. Kleinke, Phys. Rev. B 65, 245323 (2002).
- (14) N. C. de Souza, V. Zucolotto, J. R. Silva, F. R. Santos, D. S. dos Santos Jr., D. T. Balogh, O. N. Oliveira Jr., and J. A. Giacometti, J. Coll. Int. Sci. 285 544 (2005).
- (15) M. A. Auger, L. Vázquez, O. Sánchez, M. Jerger, R. Cuerno, and M. Castro, J. Appl. Phys. 97, 123528 (2005).
- (16) E. Pehlivan and G. A. Niklasson, J. Appl. Phys. 100, 053506 (2006).
- (17) S. Mendez, G. Andreasen, P. Schilardi, M. Figueroa, L. Vázquez, R. C. Salvarezza, and A. J. Arvia, Langmuir 14, 2515 (1998).
- (18) I. Otsuka and T. Iwasaki, J. Vac. Sci. Technol. B 14, 1153 (1996).
- (19) M. Hiane and J. Ebothé, Eur. Phys. J. b 22, 485 (2001).
- (20) D. E. Wolf and J. Villain, Europhys. Lett. 13, 389 (1990).
- (21) M. Kardar, G. Parisi and Y.-C. Zhang, Phys. Rev. Lett. 56 889 (1986).
- (22) E. Marinari, A. Pagnani and G. Parisi, J. Phys. A 33, 8181 (2000); F. D. A. Aarão Reis, Phys. Rev. E 69, 021610 (2004).
- (23) S. F. Edwards and D. R. Wilkinson, Proc. R. Soc. London 381, 17 (1982).
- (24) E. V. Albano, R. C. Salvarezza, L. Vázquez, and A. J. Arvia, Phys. Rev. B 59, 7354 (1999).
- (25) C. M. Huang, C. L. Joanne, B. S. V. Patnaik, and R. Jayaganthan, Appl. Surf. Sci. 252, 3997 (2006).
- (26) J. E. Rubio, M. Jaraiz, I. Martin-Bragado, J. M. Hernandez-Mangas, J. Barbolla, and G. H. Gilmer, J. Appl. Phys. 94, 163 (2003).
- (27) P. P. Chatraphorn, Z. Toroczkai, and S. Das Sarma, Phys. Rev. B 64, 205407 (2001).
- (28) W. W. Mullins, J. Appl. Phys. 28, 333 (1957).
- (29) C. Herring, in The Physics of Powder Metallurgy, ed. W. E. Kingston, McGraw-Hill, New York, 1951.
- (30) J.M. Kim and J.M. Kosterlitz, Phys.Rev.Lett. 62, 2289 (1989).
- (31) F. Family, J. Phys. A 19 L441 (1986).
- (32) E. Caglioti, V. Loreto, H. J. Herrmann, and M. Nicodemi, Phys. Rev. Lett. 79, 1575 (1997).
- (33) M. J. Vold, J. Coll. Sci. 14, 168 (1959); J. Phys. Chem. 63, 1608 (1959).
- (34) D. Weaire, J. P. Kermode, and J. Wejchert, Phylos. Mag. B 53, L101 (1986).
- (35) M. Castro, A. Sanchéz, and F. Domínguez-Adame, Phys. Rev. B 61, 6579 (2000).
- (36) F. D. A. Aarão Reis, Phys. Rev. E 72, 032601 (2005); Physica A 364, 190 (2006).
- (37) E. Katzav and M. Schwartz, Phys. Rev. E 70, 061608 (2004).
- (38) C. A. Haselwandter and D. D. Vvedensky, Phys. Rev. E 73, 040101(R) (2006).
- (39) F. D. A. Aarão Reis, Phys. Rev. E 63, 056116 (2001).
- (40) W. Schwarzacher, J. Phys. Condens. Matter 16, R859 (2004).
- (41) J.M. López, Phys. Rev. Lett. 83, 4594 (1999).