Multiple-source optical spectral weight transfer in ferromagnetic EuB6
Abstract
We present the first wide range (2 meV5.5 eV) optical conductivity of EuB6 from reflectivity and ellipsometry measurements. Upon the ferromagnetic transition at Tc=15.5 K, interband transition decreases at three different energy =0.5, 1.4, 2.75 eV and the lost spectral weight is transferred to the Drude at 0.33 eV. We succeeded in explaining this unprecedented multiple-energy change using LDA+U calculated band structure by Kunes and Pickett (Phys. Rev. B, 69, 165111). Our finding supports strongly that (1) EuB6 is a semimetal and (2) the exchange-driven band splitting is the primary source of the drastic and changes at T Tc.
pacs:
78.20.Ls,78.40.Kc,71.20.Eh,71.70.GmInterplay of itinerant carrier with localized magnetic moment can lead to novel magneto-resistance effect in solid. When the moments align with long range ferromagnetic order, dc-resistivity exhibits a drastic change as seen in EuO and (Ga,Mn)As. Theories such as the Kondo-lattice model, Ruderman-Kittel-Kasuya-Yosida (RKKY) interaction and spin-polaron model propose possible microscopic mechanism of the carrier-moment coupling in magnetic conductors.
Europium hexaboride EuB6 is a simple cubic compound where dilute conducting carrier ( 1019cm-3) coexists with localized 4f spin of Eu+2 (S=7/2). The latter undergoes ferromagnetic (FM) transition at Tc=15.5 K where simultaneously dc-resistivity drops sharply Guy et al. (1980) and the infrared plasma frequency (=) suddenly increases Degiorgi et al. (1997). Such dramatic FM-driven changes were seen in the manganites like (La0.7Ca0.3)MnO3 cmr whereas EuB6 being free from complications like lattice distortion and random substitution offers a cleaner and ideal example of ferromagnetic metal where the carrier-moment interaction can be studied in more fundamental level.
In the Kondo-lattice model itinerant electron band is split in FM phase by the s-f exchange interaction into two spin-polarized sub-bands. Kreissl and Nolting applied this theory to EuB6 to find that the band splitting brings about a significant increase of the carrier density Kreissl and Nolting (2005). The drop and increase are attributed to it. In contrast Hirsch proposed an alternative model that conduction band becomes broader in FM state because the spin-polarization reduces the bond-charge repulsion effect Hirsch (1999, 2000). This band width increase or equivalently carrier mass decrease is considered as a source of the enhanced metallicity. Pereira suggested yet another scenario that at TTc the disordered spin background can localize the carriers via their exchange interaction and it introduces a mobility edge in the conduction band Pereira et al. (2004). FM spin alignment reduces the localization effect, lowering the mobility edge position, and the carriers become delocalized. This theoretical diversity shows that EuB6 is an important prototype of metallic ferromagnetism. At present it is not clear which model is correctly describing it.
Probing electronic band structure is an essential step to solve this issue. According to the de Haas-van Alphen and Shubnikov-de Hass experiments Goodrich et al. (1998); Aronson et al. (1999), electron- and hole-pockets coexist on the Fermi surface of EuB6. This semimetal picture is employed in the Kondo-lattice theory of Ref. 4. On the other hand, angle-resolved photoemission spectroscopy (ARPES) showed that EuB6 is an insulator with a sizable gap of 1 eV Denlinger et al. (2002). The localization theory of Pereira is constructed based on this picture. This apparent controversy on the electronic band structure is by itself another long-standing open question. In particular none of the experiments mentioned above revealed how the PM electronic structure changes in FM phase. Clearly current understanding of this material is far from complete and further study is needed to resolve the two issues, i.e, origin of FM-driven changes and nature of the electronic band structure.
In this Letter, we used reflectivity and ellipsometry measurements to obtain the optical conductivity spectrum of EuB6 over the wide frequency region 2 meV5.5 eV which greatly extends the previous infrared work Degiorgi et al. (1997). We observe that at TTc exhibit rich and novel changes in the interband transition region up to 4 eV as well as in the Drude region. We propose an electronic band model that explains all the spectral changes coherently. It allows simultaneous solutions to the aforementioned two issues.
Single-crystal EuB6 samples were synthesized by the boro-thermal flux method Rhyee et al. (2003a, b). The normal incidence reflectivity, , was measured at 5 KT100 K in the 2 meV1 eV range using a Fourier transform spectrometer with the in situ overcoating technique Homes et al. (1993). For 0.75.5 eV range, optical dielectric constants were measured using spectroscopic ellipsometor (Woollam VASE).
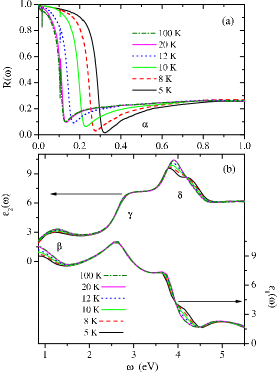
Fig. 1(a) shows of EuB6 for 5 KT100 K. The high reflectivity in the low frequency region is due to the metallic Drude response. The plasma edge shifts to higher energy as T decreases below 20 K, which is consistent with the earlier report by Degiorgi Degiorgi et al. (1997). Complex dielectric constants and from the high-frequency ellipsometry measurement are shown in Fig. 1(b). Three absorption peaks are observed at 1.4 eV, 2.8 eV, and 4 eV (labeled as , and respectively) which correspond to interband electronic transitions. The spectra exhibit systematic change with T. It occurs even at 4eV which is remarkably higher than the temperature scale.
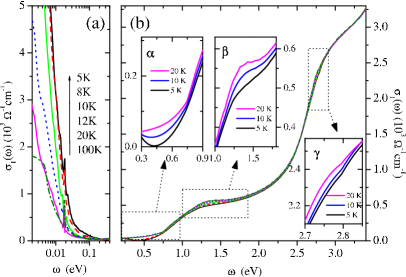
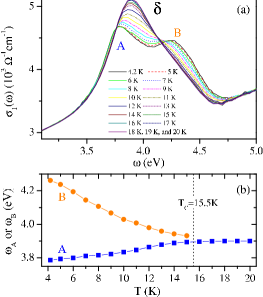
To investigate the T-dependent change, we extract optical conductivity from and . We used the Kramers-Kronig (KK) constrained variational fitting method in this analysis Kuzmenko (2005). Fig. 2 shows in the Drude part and in the interband transition (IB) part separately. At TTc Drude increases reflecting the blue-shift of the plasma edge. On the other hand, IB transition peaks and show the opposite behavior, the decrease. The decrease is seen also at 0.5 eV where the IB transition sets in. We label this IB onset as com (a). The peak will be discussed separately later.
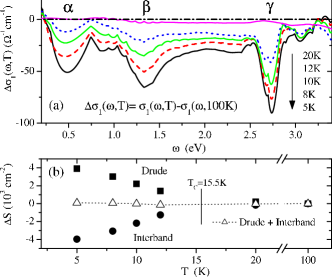
In Fig. 3(a), we show the change more closely by plotting the difference curve =-. The three negative humps represent the decrease at , and . The humps appear at T=12 K ( Tc=15.5 K) showing that they are induced by the FM transition. For quantitative analysis, we calculate the IB spectral weight change = over 0.333.3 eV and also for the Drude-change at 00.33 eV. Fig. 3(b) shows that decreases while increases below Tc. Note that they almost cancel each other +0. It means that weight is transferred from the IB part to the Drude part. Optical weight transfer is widely seen in strongly correlated electron materials particularly insulator-metal transition compounds where Drude weight change comes from some region at higher frequency. EuB6 is, however, very different in that the Drude weight comes not from single high- source but from the three different , and -humps. Such multiple-source weight transfer is unique and unprecedented. Further, while -hump is on border of the Drude peak, - and -hump are far remote from it. -hump is located at 2.75 eV which evidently has no energy overlap with the Drude conductivity at 0.33 eV. It is remarkable that nevertheless the two separate features are “communicating” with each other. These novel behaviors of interband suggest that electronic band structure of EuB6 undergoes an unusual change at Tc.
To gain insights into the weight transfer, we start from the band calculation results by Massidda Massidda et al. (1997) and Kuneš Kuneš and Pickett (2004). In Fig. 4(a), the flat band at -1 eV represents the localized Eu 4f7 levels. The valence band (VB) and the conduction band (CB) originate from B 2p and Eu 5d orbital hybridization. The two bands cross the Fermi level at X producing the semimetal hole and electron carriers. An empty Eu 5d band is located at 3 eV.
Now let us consider possible optical interband transitions. The arrows A, B, and C indicate dipole-allowed transitions VBCB, Eu 4fCB, and VBEu 5d respectively. We will calculate their absorption spectra I()=2 where is the energy difference between the final and initial state, and is the transition matrix element. The prefactor 2 represents the spin-up and down channels. In B, the i-band electrons have the same spin () and therefore only the channel is activated. We assume that is constant for simplicity. The calculated I() for A,B, and C are shown Fig. 4(c).
The band electrons interact with localized 4f moment through s-f Kondo exchange coupling Kuneš and Pickett (2004). In the FM phase, the bands split into two spin-polarized sub-bands as a result. In CB the spin-up (parallel to the Eu 4f spin) band is lowered in energy while the spin-down (antiparallel) band shifts upwards. Eu 5d band splits similarly. In contrast for the VB, the exchange integral has opposite sign and the spin-bands shift to opposite directions. According to Ref. 17, the split at X is 0.3 eV (CB) and 0.2 eV (VB) and it decreases as or . In Fig. 4(b), we reproduce the original LDA+U bands approximately using simplified form ban .
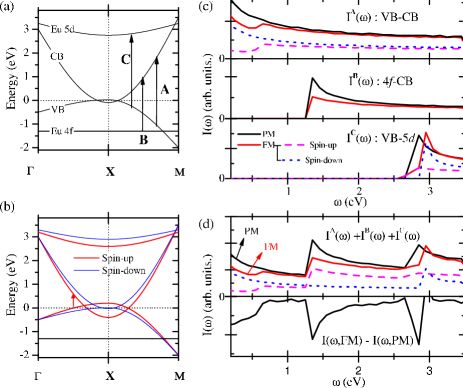
The band splitting brings about interesting changes in the Drude conductivity and I(). For VB(), the upward band shift leads to two effects; (i) the hole pocket expands (ii) the number of the occupied state (E()EF) decreases. (ii) occurs at the expense of (i). (i) will increase the Drude conductivity. Due to (ii) we can foretell that IB transition originating from this band will decrease. For VB(), the band shifts oppositely and so are the effects (i) and (ii). In CB(), the effects are similar with VB(), i.e, (i) the electron pocket expands. (ii) the empty states (E()EF) decrease. On this basis we calculate I()= I() + I() for FM. First consider A() transition where (i, f) = (VB(), CB()). In both bands -space available for the transition decreases due to (ii). IA(,) in Fig.4 (c) shows that the transition is suppressed significantly at 0.5 eV. Along note that the transition has an onset at where E()EF as indicated by the small arrow in Fig. 4(b). It has finite energy 0.5 eV below which the transition is absent. In PM the onset energy was almost zero. The IA(,) suppression is due to this transition gap created by the band splittings. For A() channel the effects (ii) are opposite and accordingly I() will increase. However, the change is less dramatic than in A(): note that IA() is almost the same as that in PM, (,PM). In total, IA()= IA() + IA() is reduced in FM. Similar I() suppression occur in B and C. In B, the i-band Eu4f () remains without shift while the f-band CB() shifts downward. Again by (ii), IB() decreases. In C, IC() is suppressed due to the i-band shift similarly to that of A.
In Fig. 4(d), we show the total intensity spectra I()=IA()+IB()+IC() for PM and FM and their difference I()=I(,FM)I(,PM). The latter shows excellent agreement with the data in Fig. 3(a). The three-hump structure is reproduced. The peak positions and the shapes agree remarkably well com (b). To ensure the result we consider intermediate temperatures 5 K15 K where the FM ordering is partial. Here the s-f band splitting will be reduced. We repeat the calculation with smaller splittings and find that I() is consistent with the data, i.e, the hump strength becomes weaker while the positions are maintained.
In the Drude part, the hole and electron density change due to the effect (i). It will alter the plasma frequency . We estimate the density n and the band mass mb from the Fermi surface volume and the band dispersion, respectively and calculate the total =[() +()]+[()+()], the sum of the four contributions. We obtain 3500cm-1 and /4.9. The enhancement comes mostly from the n increase of the h() and e() which overwhelms the n decrease of the () ones. The change of mb is negligibly small. To compare with experiment, we calculate from the sum rule with =0.3 eV. By taking at T=5 K (=FM) and 20 K (=PM), we find 3300cm-1 and /4.4. Again, the results are in good agreement. It shows that the band splitting is the primary source of the increase and consequently the drop at TTc.
The success of the IB and Drude analysis shows clearly that the band diagram we employed represents the intrinsic EuB6 electronic structure. The multiple structure IB change stems from the VB, CB, and Eu 5d band spin-splittings. It is particular that VB and CB cross EF because their splittings remove weight from the IB part and restore it into the Drude part. We showed that in this way the Drude weight can come from as high as 2.75 eV (), seeming unlikely remote energy. If both VB and CB did not cross EF (insulator picture) or one of them didn’t, the observed change is not produced. It is needed that both bands cross EF to explain the multiple-structure optical weight transfer. It therefore supports the semimetal band picture. Although our I( calculation is rather primitive (k-dependence of is ignored and only part of the whole BZ was taken into account), the analysis is sufficient to support the conclusions. In the m*-change picture Hirsch (1999, 2000) or the localization-delocaliztion picture Pereira et al. (2004) mentioned in the introduction, CB or VB change in width or in the mobility-edge position. One needs to calculate change for each case and compare with our result. While rigorous analysis is not available at this point, it appears that they both fail to explain the observed data.
In Fig. 5, we show the high energy peak at 4 eV. At TTc it splits and the splitting reaches 0.48 eV at T=4.2 K. This behavior is perhaps another result of the band splitting. We associate with VB and Eu5d(II) band fig . Here Eu5d(II) represents an empty band at 3 eV5 eV region (not shown in Fig. 4). Both Eu5d(II) and VB exhibit van Hove singularities at and therefore VB Eu5d(II) transition will contribute strong absorption intensity like . At , Eu5d(II) is at +3.5 eV and it splits by 0.5 eV in FM whereas VB is at -0.5 eV and remains unsplitted. Kuneš and Pickett (2004). Then the -transition from VB to Eu5d(II) will have 4 eV energy and 0.5 eV splitting. The splitting will be induced by magnetic field as well which may be useful for UV magneto-optical application.
In summary we found that optical conductivity of EuB6 exhibits rich and novel spectral changes along with the FM transition: the multiple-energy IB suppression (0.5, 1.4, and 2.75 eV), the absorption peak splitting at 4 eV, and the Drude weight increase. We showed that they are results of the semimetal band structure and the Kondo coupling. This work provides new insights on the two long standing unsolved issues of EuB6.
We thank C.C. Homes for helping reflectivity measurement. This work was supported by the KRF Grant No. -070-C00032 and the KOSEF through CSCMR. The work at Toronto was supported by NSERC Discovery Grant Research Tools and Instrumentation grant.
References
- Guy et al. (1980) C. N. Guy, S. von Molnar, J. Etourneau, and Z. Fisk, Solid State Commun. 33, 1055 (1980).
- Degiorgi et al. (1997) L. Degiorgi, E. Felder, H. R. Ott, J. L. Sarrao, and Z. Fisk, Phys. Rev. Lett. 79, 5134 (1997).
- (3) Colossal Magnetoresistance Oxides, edited by Y. Tokura (Gordon Breach, New York, 2000).
- Kreissl and Nolting (2005) M. Kreissl and W. Nolting, Phys. Rev. B 72, 245117 (2005).
- Hirsch (1999) J. E. Hirsch, Phys. Rev. B 59, 436 (1999).
- Hirsch (2000) J. E. Hirsch, Phys. Rev. B 62, 14131 (2000).
- Pereira et al. (2004) V. M. Pereira, J. B. L. dos Santos, E. V. Castro, and A. H. C. Neto, Phys. Rev. Lett 93, 147202 (2004).
- Goodrich et al. (1998) R. G. Goodrich, N. Harrison, J. J. Vuillemin, A. Teklu, D. W. Hall, Z. Fisk, D. Young, and J. Sarrao, Phys. Rev. B 58, 14896 (1998).
- Aronson et al. (1999) M. C. Aronson, J. L. Sarrao, Z. Fisk, M. Whitton, and B. L. Brandt, Phys. Rev. B 59, 4720 (1999).
- Denlinger et al. (2002) J. D. Denlinger, J. A. Clack, J. W. Allen, G.-H. Gweon, D. M. Poirier, C. G. Olson, J. L. Sarrao, A. D. Bianchi, and Z. Fisk, Phys. Rev. Lett. 89 (2002).
- Rhyee et al. (2003a) J.-S. Rhyee, B. K. Cho, and H.-. C. Ri, Phys. Rev. B 67, 125102 (2003a).
- Rhyee et al. (2003b) J.-S. Rhyee, B. H. Oh, B. K. Cho, H. C. Kim, and M. H. Jung, Phys. Rev. B 67, 212407 (2003b).
- Homes et al. (1993) C. C. Homes, M. Reedyk, D. A. Crandles, and T. Timusk, Appl. Opt. 32, 2976 (1993).
- Kuzmenko (2005) A. B. Kuzmenko, Rev. Sci. Instrum. 76 (2005).
- com (a) The change of arises from above the plasma edge (at 0.1-0.6 eV) where decreases as T decreases.
- Massidda et al. (1997) S. Massidda, A. Continenza, T. M. D. Pascale, and R. Monnier, Z. Phys. B 102, 83 (1997).
- Kuneš and Pickett (2004) J. Kuneš and W. E. Pickett, Phys. Rev. B 69, 165111 (2004).
- (18) ()=(3,-3.4,-3.03)X-Γ and (3.5,-3.9,-3.53)X-M for CB, (0.5,0.7,0.505)X-Γ and (-2,2.2,2.005)X-M for VB, and (3.25,-0.6,-0.4) for Eu 5d. To plot the PM bands, we took spin-average of the FM bands.
- com (b) The Drude tail overlaps with the -hump. The suppression of - at 0.5 eV is due to the T-dependent Drude part which is not accounted for in the I() calculation.
- (20) From Eu 5d orbital, total 5 empty bands are derived where the +3eV one is the lowest-lying branch. We refer the next branch as Eu5d(II).