Simulations on the elastic response of amorphous and nanocomposite carbon
Abstract
Theoretical calculations of the elastic response of carbon composites and amorphous carbon are reported. The studied composites consist of crystalline nanoinclusions, either spherical diamonds or carbon nanotubes, embedded in amorphous carbon matrices. The elastic constants of the composites were calculated and found to systematically increase as the density increases. The elastic recovery under hydrostatic pressure for all structures was also investigated and was found to be significantly high for both nanocomposite and amorphous carbon, but decreases as the material becomes more dilute.
I Introduction
Novel carbon materials are studied intensively due to their enormous potential utility. Nanocomposite films are materials formed by various carbon crystallites embedded in an amorphous carbon (-C) matrix. Interest on these materials is growing since their properties, both mechanical and electronic are expected to tailor and improve the properties of the single-phase -C system. Depending on the density and the specific structure of the crystalline inclusion, the properties of the two parts of the system can intermingle leading to materials with diverse and interesting properties.
The nanoinclusions can range from conformations to entirely ones, which in the absence of a matrix may interact via van der Waals (VDW) forces. Carbon composites have been studied theoretically nc@aC ; CNT@aC ; bulknD@aC , while there is also insight from experimental work. Diamond composites formed by a nanometer sized diamond surrounded by -C are potential candidates for superhard materials with applications in electromechanical devices such as MEMS/NEMS or as coatings. Such composites have recently been grown Lifshitz in both hydrogenated and pure -C matrices. On the other hand, carbon nanotubes (CNT) cnt , which are fully forms of carbon have attracted many experimental and theoretical studies as they have inspired interesting advances in science. Although their production methods are continuously improving, in many cases not only pure CNT but also other crystalline as well as amorphous carbon structures are formed. Thereby, either intentionally or not, CNTs can be found in -C, forming films with potentially improved mechanical, thermal, and electronic properties for technological applications.
In this work, we study some mechanical properties of carbon nanocomposites. Recently, we investigated how diamond composites respond to the application of strain, in the regime where fracture occurs, and we extracted their strength bulknD@aC . Here, instead, we focus on the elastic regime, i.e., the region where the stress is still directly proportional to the strain applied. The elastic constants and moduli and the elastic recovery are the representative quantities to unravel the behavior of the two nanomaterials within this regime.
II Numerical set-up
Computer simulations are used to model various -C networks and carbon composites. The latter contain either a spherical diamond or a CNT, in order to capture the effects of a fully and a fully inclusion on the properties of the composite. Monte Carlo calculations within the empirical potential approach are carried out. These are effective methods for the analysis of structural and mechanical properties of composite systems. The atomic interactions are modeled by the Tersoff potential tersoff . In the case of nanotube composites (CNT/-C), a typical 12-6 Lennard-Jones potential was also added to effectively model the interaction of the CNT atoms and those of the surrounding matrix CNT@aC . The parameters used for this potential (=2.964 meV, =3.407 Å) have been previously used to describe the bulk properties of solid and multiwall nanotubes ljparam .
This scheme is capable of describing large systems, while it is also well tested and provides a fairly good description of the structure and energetics of a wide range of crystalline carbon and -C phases nc@aC ; kelires94 ; Donadio . In particular, the Tersoff potential has been fitted and well tested with respect to reproducing the elastic constants, defect energies and phonon frequencies of diamond and graphite. Work by Mathioudakis and Kelires MathiouJNCS showed that the potential describes well the variation and softening of elastic moduli of amorphous semiconductors as a function of temperature. In addition, it gives valuable information on the elastic properties and stress in various a-C forms kelires94 ; kelires00 . These issues are closely related and valuable to the present work. However, the potential does not describe interactions properly, due to the absence of dihedral-angle forces, giving rise to excessive mixed hybrids. The absence of repulsion between non-bonded orbitals Stephan ; Kaukonen ; Jager leads to some overestimation of the density for a given sp3 content kelires00 ; Mathiou . This mostly occurs at intermediate sp3 contents, while low-sp3 (evaporated a-C) and high-sp3 (tetrahedral ta-C) networks are properly described in this respect. For ta-C (sp3 fraction about 80%) the overestimation is 3-4%. This shortcoming is not expected to seriously affect the energetics and elastic moduli of the nanocomposites, because these are determined primarily by the bond character of the network, which is very well treated by the potential.
All structures were generated by quenching from the melt, a simulational method that is widely used to generate amorphous networks with a variety of different methods, ranging from first principles calculations or tight binding schemes to more empirical methods as the one presented in this paper. This procedure, produces generic structures that cannot be directly associated with the nonequilibrium as-deposited structures, but can be definitely associated with and can be used to study the equilibrium ground state of carbon composite films, i.e., with structures sufficiently relaxed under moderate thermal annealing. The generated structures depend on applied conditions, such as the quenching rate. This issue has been examined thourougly in previous studies nc@aC ; kelires93 . We use the optimized rates obtained in these studies. The structures also depend on the applied pressure (variable volume simulation) or the chosen initial density (constant volume). We are able to produce a wide range of fractions by appropriately choosing the density/pressure of the simulation.
In the case of nanocomposites, the crystalline atoms of the inclusion were kept frozen throughout the quenching process. After quenching, which produces amorphization of the surrounding matrix, the cells are thoroughly relaxed with respect to atomic positions and density. Relaxations are particularly important at the interface region, where the crystallites mainly adjust to the host environment. One way of checking the stability of nanocrystals, is to subject them to thermal annealing. A stable structure should be sustained in the amorphous matrix, while an unstable structure should shrink in favor of the host.
Details have been given elsewhere nc@aC ; CNT@aC , where it was also shown that diamond crystallites are stable (under conditions of thermodynamic equilibrium) in dense -C matrices nc@aC , while nanotubes are stable (or slightly metastable) in low density matrices CNT@aC . Here, we are interested only on these stable composites, which could be used for practical purposes.
Spherical diamonds or single-wall CNTs of different sizes are embedded into amorphous matrices of various densities. Cubic cells with periodic boundary conditions, containing 500-5000 atoms, were used and the diameters of the crystalline inclusions were allowed to vary. All the steps in the generation of the structures was done with the Monte Carlo method within the Tersoff empirical potential approach.
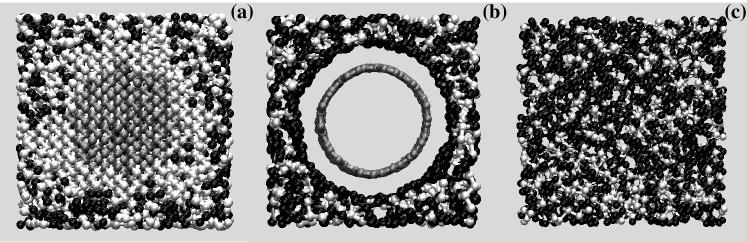
The nanodiamond diameters range from 0.5 to 2 nm, while for nanotubes they lie within 0.8-2.7 nm. For all structures, the initial distance between the inclusions due to the periodicity of the cells is in the range 0.9 - 1.1 nm. After the generation of the matrix and the relaxation, this distance will vary as some -C atoms at the crystalline-amorphous interface are expected to crystallize (dense composites) or atoms of the inclusions may amorphisize (more dilute composites). Representative models of all different structures, both composites and single-phase -C, that have been studied here are shown in Fig.1. Simulations on multi-wall nanotube composites were also carried out. These will not be extensively analyzed, but will serve as a comparison to single-wall nanotube composites. All properties are calculated at a low temperature. The () compositions of the structures given in the following analysis refer to the amorphous matrices, while the densities refer to the whole structure, unless otherwise stated. The amount of atoms for all cases studied here is negligible and the threefold () atoms can be directly estimated from the fourfold () atoms.
III Elastic Constants
The elastic constants and moduli of diamond and nanotube composites are studied using standard techniques elastConst at the lowest-energy configurations. These supplement previous results on their bulk moduli CNT@aC ; bulknD@aC and are compared to the a-C values kelires94 . Strain is applied to the cubic cells and the elastic energy directly proportional to the elastic constants is obtained. The strain is small and leads to small deviations from cubic symmetry, allowing us to refer to cubic elastic moduli. A volume conserving orthorombic strain was applied to calculate the shear modulus equal to , while the elastic constant is given by shearing the cell with a monoclinic strain. The equilibrium bulk modulus was extracted through a fit to the energy-versus-volume curve using the Birch-Murnaghan isothermal equation of state murnachan . The Young’s modulus is calculated from the bulk modulus through the relation , with being the Poisson ratio. This is defined as the ratio of the contraction normal to the applied strain divided by the extension in the direction of the applied strain. According to the theory of isotropic elasticity, its values should be in the range from -1 to 0.5. We show here that this ratio for diamond and nanotube composites is between 0.1 and 0.3. The calculated for bulk diamond and for a free standing CNT of 1 nm, using the Tersoff potential, is 443 and 200 GPa, respectively. These values are in very good agreement with experimental results for the former, and with ab initio simulations for the latter bulkCNT .
| (g cm | B | shear | Y | ||||
|---|---|---|---|---|---|---|---|
| 2.6 | 215 | 493 | 76 | 210 | 208 | 0.13 | 473 |
| 2.7 | 241 | 566 | 78 | 240 | 244 | 0.12 | 547 |
| 2.9 | 268 | 636 | 84 | 289 | 276 | 0.12 | 616 |
| 3.1 | 307 | 735 | 93 | 341 | 321 | 0.11 | 714 |
| 3.3 | 344 | 817 | 107 | 366 | 355 | 0.12 | 792 |
| 3.4 | 359 | 856 | 110 | 387 | 373 | 0.11 | 831 |
We begin with calculations related to diamond composites. The trends followed by the bulk moduli are similar to those given by more accurate tight-binding simulations bulknD@aC . As a general result, all the elastic moduli show an increase as the structure becomes more dense or the inclusion larger. For example, a nanodiamond with 1.7 nm in diameter embedded in a dense matrix (with 80% content) has a bulk modulus close to 360 GPa and a Young’s modulus of 830 GPa. The corresponding values for a nanodiamond with a diameter of 2.1 nm in a similar matrix rise up to 370 and 865 GPa, respectively. The shear modulus of these two composites increases from 373 to 388 GPa. In order to elucidate the trend of increasing moduli with increasing density, the calculated values for a composite with a 1.7 nm diamond inclusion are presented in Table 1. These clearly reveal the hardening of the composite as the -C matrix becomes more dense and the behavior is similar to the case of pure -C kelires94 . The effect of the diamond core on the properties of a composite should almost be the same for all densities (especially for the stable dense nanocomposites) and the variation of the elastic constants with density should mainly be determined by the matrix, which becomes more incompressible as it gets denser. However, for low densities (high fraction) the moduli of the composites are lower than those of single-phase -C networks with the same density. For high densities, the increase over the -C values is 8% for a 1.7 nm diamond inclusion and 13% for a 2.1 nm nanodiamond. Hence, in dense composites, both the inclusion and the surrounding matrix are quite incompressible and the whole structure is quite rigid, while in the opposite limit not only the matrix becomes more dilute, but the inclusion becomes more deformed and contributes to the softening of the whole structure. These softening mechanisms are mainly related to sites, which contribute less to the rigidity of the material kelires00 . Therefore, composites with low density (high content) matrices have elastic constants that are lower than those of single-phase -C. On the other hand, the Poisson ratio shows no significant fluctuations indicative of the fact that the enhancement in both and is similar and contraction versus extension is almost the same for all D/-C structures. Also, the shear value is smaller than the bulk modulus for the same structure, verifying what is known for most materials, i.e., they resist a change in volume (determined by the bulk modulus) more than they resist a change in shape. This is also the case for nanotube composites.
A first look at these CNT/-C structures reveals that their elastic moduli are in general smaller than those of D/-C. In our opinion, two are the main reasons behind this trend. Diamonds are stable in high density, thus more rigid matrices, but CNTs can be found mainly in less dense (more soft) matrices CNT@aC . A second important factor in CNT/-C is related to the empty regions of appreciable volume inside and directly outside the nanotube were no atoms occur. As shown in Ref. CNT@aC , no covalent bonding between CNT atoms and the matrix exists. Instead, the VDW forces drive a reconstruction of the surrounding medium, producing a graphitic wall at a distance of 3.4 Åfrom the CNT. See panel (b) of Fig. 1. Thus, the resulting open space (voids), together with the relative high ratio lower the moduli of such materials, rendering them softer. Again, similar to the bulk modulus trends, all elastic parameters of the dense composites are enhanced. Some of the results are summarized in Table 2, where Y∥ and Y⟂ are the contributions in the Young’s modulus in directions along and perpendicular to the tube axis calc . It is clear that for the same nanotube diameter all moduli increase as the density of the whole material increases. This strenghtening is again necessitated by the more dense (more rigid) -C matrix. Here, the Poisson ratio is slightly higher than for diamond composites and its fluctuations are more significant. This is again a signature of the higher anisotropy that the nanotube composites show. The transverse contraction over the longitudinal extension when strain is applied to CNT/-C is higher than for D/-C. Comparison of similar, in terms of density, CNT/-C structures reveals again an enhancement of the moduli as the CNT diameter increases. For example, a composite with a nanotube 1.2 nm in diameter has a shear modulus of 79 GPa and a Young’s modulus of 273 GPa, while these values rise to 131 and 416 GPa for a 1.7 nm CNT. Both composites have a density of 2 g cm-3. We note that different nanotube chiralities did not affect any of the results, thereby the nanotubes are rather anonymous and we refer only to their diameter.
At this point, a comment regarding the differences between single and multi-wall nanotube composites has to be made. The trends followed by the latter composites are similar to the former ones, since they also become more rigid for higher densities and larger nanotube diameters. Nevertheless, there is an additional feature that plays a crucial role in the rigidity of multi-wall nanotube composites. This is related to the number of walls that form a multi-wall nanotube. As the number of walls increases, while the total nanotube diameter remains constant, the elastic moduli increase because of the repulsive forces between the CNT walls at short distances.
IV Rule of mixtures
Thus far, the contribution of the a-C matrix and its component in the determination of the elastic parameters was examined. In this section, we seek to find out in what extent the properties of each constituent are mapped on the properties of the whole structure. Nanocomposites are a mixture of two or more different phases. It has been proposed that in such configurations the elastic moduli of the whole structure is proportional to the sum of the moduli of each of the constituents with their volume fractions serving as the weights in the summation Tabor . This is known as the rule of mixtures. We now investigate whether this rule applies here by comparing the moduli presented in the preceding section to the ones given through this rule. A diamond nanocomposite with a crystalline volume fraction of 33% and a total density 3.3 g cm-3 ( component about 25%) has a modulus of 346 GPa. The rule of mixtures for this composite leads to a value of 354 GPa. Similar are the results for all dense structures. As the density decreases, the deviation of the calculated moduli from those given through the rule of mixtures becomes larger. For a diamond composite with a total fraction of 50 % this difference is close to 40 GPa and gets larger with a decreasing fraction. These features indicate that diamond inclusions are not strongly affected by their presence in high density -C matrices, while this is not the case for dilute -C matrices in which the nanodiamonds are unstable and quite distorted, thus influenced by the embedding effect.
| D(nm) | (g cm-3) | B | Y | Y∥ | Y⟂ | ||||
|---|---|---|---|---|---|---|---|---|---|
| 1.2 | 2.2 | 337 | 121 | 79 | 193 | 273 | 0.26 | 476 | 290 |
| 1.2 | 2.4 | 418 | 104 | 108 | 209 | 377 | 0.20 | 601 | 364 |
| 1.6 | 2.0 | 290 | 78 | 71 | 149 | 257 | 0.21 | 478 | 231 |
| 1.6 | 2.1 | 384 | 81 | 94 | 182 | 356 | 0.17 | 564 | 306 |
| 2.1 | 1.9 | 295 | 79 | 97 | 151 | 262 | 0.21 | 490 | 258 |
| 2.7 | 1.7 | 251 | 72 | 82 | 132 | 219 | 0.22 | 404 | 216 |
On the other hand, the rule of mixture does not hold for composites with nanotube inclusions. This is a direct evidence that CNTs are strongly influenced by their presence in the mixture and show a stability which is in average lower than that for diamond inclusions. The axial and transversal Young’s moduli of a composite with a SWNT inclusion of a 1.65 nm diameter are 564 GPa and 306 GPa, respectively. The values obtained by the rule are = 297 GPa and = 323 GPa. In general, the axial moduli compared to the transverse part deviate more from the values calculated through the rule of mixtures and the anisotropy of the elastic moduli of free standing nanotubes is enhanced by their embedding into the matrix. In the axial direction the embedding effect is stronger and leads to a strengthening along this direction, while a slight softening is evident along transverse directions. The matrix is an isotropic medium and the anisotropy is induced by the CNT. It is stronger for the axial part of the Young’s modulus due to the infinite length of the CNT in this direction, along which the CNT actually dominates over the matrix. This happens regardless of the density. In transverse directions, the matrix contribution is stronger as it is leads to a softening along these directions.
V Elastic Recovery
Finally, we discuss the elastic recovery during a compression-decompression cycle of both composite and amorphous structures. Experimentally, this is often performed by atomic force microscopy or standard nanoindentation and nanoscratch experiments. Measurements for -C films show that these recover highly elastic ( 90%) recovExpr , but no variation with the fraction is known. In our knowledge there are no such experiments for the composites studied here and our results serve as predictions for the elastic recovery of these materials. Computationally, by applying hydrostatic pressure on these composite structures their contraction can be measured. A permanent deformation signifies a decrease of the volume expressed as a fraction of its initial value. A perfectly elastic material would have an elastic recovery equal to one, while for a perfect plastic one it would be zero. CNT ropes, as an example, have been found to have high elastic recovery even under high-deformation conditions (over 100 GPa) CNTelastRecov .
In order to reveal the elastic response of the composites, compression of all these stuctures up to 100 GPa took place, followed by full decompression. The behavior is directly dependent on the stability of the composites, i.e., the more stable the structure the higher its recovery. We mainly focus on the stable composites, since these are the ones that are of technological interest. It is now more efficient to refer to the total component for each case in order to promote comparison with the composite stuctures. Diamond composites are stable for an fraction over 60-70%, while for nanotube composites this value is in the range of 20-30%. The elastic recovery of single-phase -C is determined by its density or hybridization. It is almost perfectly elastic in the highly tetrahedral regime (-C). The recovery is not perfect as the fraction declines, but it is again high in good aggreement to the experimental results mentioned previously. An almost fully -bonded -C network regains its initial volume at about 95 %. For a much higher compression (up to 500 GPa) the dense networks again recover almost perfectly, but for the dilute ones (fully ) the recovery drops to about 80 %. Similarly, in diamond composites, the more stable these are the higher their recovery. It is again almost perfect (even for compression up to 500 GPa), but as their density lowers the recovery drops to 90%. Taking into account the high incompressibility of the diamond crystallites the decrease can only be assigned to the matrix and mainly to its threefold atoms, which are more easily deformed.
The response of nanotube composites is more interesting. Although, they recover their initial volume over 90%, there are essential configurational modifications after decompression. The CNT retains its shape, but a few covalent bridge bonds ( 1.6 Å) between the CNT and the matrix have been formed. During decompression the volume is changed (up to 10% depending on density) denoting that the system has been trapped into a local minimum. The bridge bonds, which start to form at a pressure close to 70 GPa, modify the structure and do not allow volume changes during decompression. In the case of unstable nanotube composites the volume change after decompression is again low, but inspection of the nanotube reveals the strong effect inflicted by the pressure. The tubular character is preserved, but the cross section is far from being circular, although no buckling similar to free-standing CNTs undercompression was evident buckl . The matrix and especially its part that immediately surrounds the inclusion is not seriously affected and no bridge bonds were formed.
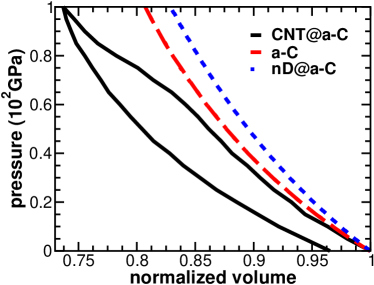
A sample of all cases studied is summarized in Fig.2. The elastic recovery for an -C network with 40% threefold atoms, as well as that for diamond and nanotube composites are shown. The composites shown were chosen according to their stability. In the case of -C, we show a network that serves as an upper bound (in terms of the fraction) to the perfectly elastic -C samples. More threefold atoms lead to deviations from this behavior as mentioned previously. The diameters of the inclusions and the fractions are 1.7 nm and 10% for the diamond composite, and 1.2 nm and 60% for the nanotube composite. The number of threefold sites in the case of the diamond composite is small, but the elastic recovery is similar for large components, as long as the composite retains its stability. The compression curves for -C and D/-C coincide to those for decompression, indicating the full elastic recovery of these structures. The curves related to CNT/-C show a hysterisis representing the change in the final volume after decompression. This behavior is related to the structural modification in the final configuration mentioned previously. Nanotube composites can be more easily compressed as shown in the figure. At the high pressure of 100 GPa, their volume can be reduced up to 25% from its initial value. The reduction for single-phase -C is 18%, while it is even less for diamond composites. For the latter, the component is much smaller compared to the CNT/-C and -C networks, but even for a larger component the compressibility is small. (A D/-C network with 73% of its atoms being is compressed up to 77% at 100 GPa. This value is again higher than it is for -C and CNT/-C.) Our results indicate that the compressibility from CNT/-C towards -C and D/-C is decreasing. The crucial quantity for the degree of recovery is the content. As long as it remains high, there is no perfect elastic recovery. Here, we only correlated this threefold component to the elastic recovery of the composites and -C. A next step would include a more extensive study of the size of the nanoinclusion.
VI Conclusions
A comparative study of the elastic constants of diamond and nanotube composites was presented. A systematic increase in these properties was found as the structures become more dense. The amorphous matrix and mainly the component contribute the most to this enhancement. Study of the elastic response of all composite structures and single-phase -C revealed a high elastic recovery. It is almost perfect for the stable composites and the amorphous networks, but decreases with increasing component. Nanotube composites are more easily deformed, followed by the pure -C networks and the diamond composites. The higher the fraction the higher the compression, which eventually leads to a lower elastic recovery.
Acknowledgements.
We thank G. Hadjisavvas for useful discussions and S. Kassavetis for helpful insights into his -C related experimental work. The work was supported by a grant from the EU and the Ministry of National Education and Religious Affairs of Greece through the action “EEAEK” (programme “AOPA”.)References
- (1) M.G. Fyta, I.N. Remediakis, and P.C. Kelires, Phys. Rev. B, 67, 035423 (2003).
- (2) M.G. Fyta and P.C. Kelires, Appl. Phys. Lett., 86 (2005) 191916.
- (3) M.G. Fyta, I.N. Remediakis, P.C. Kelires, and D.A. Papaconstantopoulos, Phys. Rev. Lett., 96 (2006) 185503.
- (4) Y. Yao, M.Y. Liao, T. Kohler, T. Frauenheim, R.Q. Zhang, Z.G. Wang, Y. Lifshitz, and S.T. Lee, Phys. Rev. B, 72 (2005) 035402; Y. Lifshitz, T. Kohler, T. Frauenheim, I. Guzmann, A. Hoffman, R.Q. Zhang, X.T. Zhou, and S.T. Lee, Science, 297 (2002) 1531.
- (5) S. Iijima, Nature, 354 (1991) 56.
- (6) J. Tersoff, Phys. Rev. Lett., 61 (1988) 2879.
- (7) P. Lu and W. Yang, Phys. Rev. B, 49 (1994) 11421; P. Lu, X.P Li, and R.M. Martin, Phys. Rev. Lett., 68 (1992) 1551.
- (8) P.C. Kelires, Phys. Rev. Lett., 73 (1994) 2460.
- (9) D. Donadio, L. Colombo, P. Milani, and G. Benedek, Phys. Rev. Lett., 83 (1999) 776.
- (10) C. Mathioudakis and P.C. Kelires, J. Non-Cryst. Solids, 266-269 (2000) 161.
- (11) P.C. Kelires, Phys. Rev. B, 62 (2000) 15686.
- (12) U. Stephan and M. Haase, J. Phys.: Condens. Matter 5, 9157 (1993).
- (13) H.-P. Kaukonen and R.M. Nieminen, Phys. Rev. Lett. 68, 620 (1992).
- (14) H.U. Jäger and K. Albe, J. Appl. Phys. 88, 1129 (2000).
- (15) C. Mathioudakis, P.C. Kelires, Y. Panagiotatos, P. Patsalas, C. Charitidis, and S. Logothetidis, Phys. Rev. B 65, 205203 (2002).
- (16) P.C. Kelires, Phys. Rev. B, 47, 1829 (1993)
- (17) M.J. Mehl, J.E. Osburn, D.A. Papaconstantopoulos, and B.M. Klein, Phys. Rev. B, 41 (1990) 10311.
- (18) F.D. Murnaghan, Proc. Natl. Acad. Sci. U.S.A. 30 (1944) 244; F. Birch, Phys. Rev., 71 (1947) 809.
- (19) S. Reich, C. Thomsen and P. Ordejon, Phys. Rev. B, 65 (2002) 153047.
- (20) The empty regions were subtracted from the volume of the composite. The volume of the CNT was assumed equal to 2RR, with R close to the graphite interplanar distance, a value widely used in the literature; R is the radius of the CNT after full relaxation of the cell.
- (21) D. Tabor, Rev. Phys. Technol., 1 (1970) 145.
- (22) C. Charitidis, S. Logothetidis, Thin Solid Films, 482 (2005) 120.
- (23) H. Liang and M. Upmanyu, Phys. Rev. Lett., 94 (2005) 065502.
- (24) B.I. Yakobson, C.J. Brabec, and J. Bernholc, Phys. Rev. Lett., 76 (1996) 2511.